Leilei Liu | Jie Liu* | Zuqing He | Huanle Liu | Chao Zhou | Xuegang Yan | Xiaojun Sun
© 2020 IIETA. This article is published by IIETA and is licensed under the CC BY 4.0 license (http://creativecommons.org/licenses/by/4.0/).
OPEN ACCESS
There is no precedent for the application of rotary flow jetting tool in the drainage gas recovery under gas wells. Based on the motion principles of jet flow and vortex flow, this paper designs a downhole rotary flow jetting tool, and verifies the feasibility of the tool through fluid simulation. Next, an indoor experiment device was established for drainage gas recovery with rotary flow jetting tool by the principle of similarity, and the structural parameters of the tool were subject to multi-objective optimization through orthogonal experiments. The optimized tool can achieve ideal rotary flow height and discharge volume. The results show that the proposed rotary flow jetting tool can effectively separate gas from liquid, and produce a rotary flow. The optimal structural parameters were determined as follows: the pitch diameter of spiral body is 45mm, the throat pipe length is 247mm, the spiral angle is 55°-60°, the spiral wing width is 4-6mm, and the nozzle diameter is 15-25mm. In addition, the number of side holes of the throat pipe has little effect on the jetting effect.
orthogonal experiment, jet flow, vortex flow jetting tool, drainage gas recovery
During the production of gas wells, especially in the middle and late stages, the bottomhole gas cannot carry the bottom liquid out of the wellbore, due to the slowdown of gas velocity with the reduction in reservoir energy. Then, fluid will accumulate in the gas wells, hindering normal production. If the wellbore fluid cannot be discharged in time, the well will be flooded and unable to produce gas [1].
The common drainage gas recovery technologies for gas wells have several problems: complex surface processes, long shutdown cycles, as well as intermittent and frequent operations. Compared with these traditional technologies, the vortex flow jetting tool is easy to operate, economical, and capable of draining liquid. More importantly, this tool can be combined with other drainage gas recovery technologies, namely, foam drainage [2, 3].
In 2002, Vortex Flow Inc. pioneered the application of vortex flow jetting tool in drainage gas recovery, aiming to curb the pressure drop in the tubing and reduce the critical gas velocity required for gas to carry liquid [4, 5]. Subsequently, Surendra et al. studied vortex flow jetting tool through indoor evaluation experiments and numerical simulations, respectively [6-14].
To improve the efficiency of vortex flow jetting tool, this paper fully integrates the jetting device with the vortex flow jetting tool. The jet was used to speed up the downhole fluid, and enhance the ability of gas to carry liquid at the bottom of the well. Next, orthogonal experiments were designed for indoor simulation of rotary flow jetting tools with different structural parameters. Then, the experimental results were evaluated by two metrics, i.e., the height of rotary flow and the discharge volume, to optimize the structural parameters of the rotary flow jetting tool.
The jet flow refers to the fluid ejected through an orifice or nozzle, while the flow area continues to decrease. With a high outflow velocity, the fluid relies on the initial momentum to maintain continuous movement. The high velocity of the ejected fluid will also take away the nearby air. Then, a negative pressure zone will be formed in a certain range, attracting different fluids nearby to converge.
The vortex flow takes another flow form: a straight-flowing fluid is guided by a spiral object, such that part of the flow velocity is converted into a tangential velocity; the greater the tangential velocity, the longer the duration of the vortex flow.
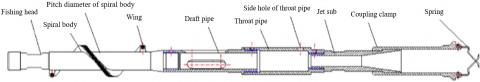
According to the motion principles of jet flow and vortex flow, this paper designs a preliminary model for downhole rotary flow jetting tool. As shown in Figure 1, the tool mainly consists of fishing head, spiral body, draft pipe, throat pipe, nozzle, and coupling clamp. The structural parameters are shown in Table 1.
Figure 1. The structure of rotary flow jetting tool
Table 1. The basic structural parameters of rotary flow jetting tool
|
Component |
Parameter |
Sign/Unit |
Value |
|
Spiral body |
Pitch diameter |
D1/mm |
35 |
|
Wing width |
L1/mm |
4 |
|
|
Wing height |
H1/mm |
16.5 |
|
|
Effective number of spiral turns |
Each |
1.5 |
|
|
Helix angle |
$\theta_{1}$ /° |
45 |
|
|
Draft pipe |
Inner diameter |
D2/mm |
30 |
|
Number of draft holes |
Each |
3 |
|
|
Throat pipe |
Inner diameter |
D3/mm |
38 |
|
Number of side holes |
Each |
3 |
|
|
Side hole diameter |
D4/mm |
10 |
|
|
Nozzle |
Outlet diameter |
D5/mm |
20 |
|
Throat-nozzle distance |
L2/mm |
30 |
|
|
Inlet diameter |
D6/mm |
40 |
|
|
Contraction angle of reducing section |
$\theta_{2}$ /° |
15 |
The rotary flow jetting tool, as a novel tool for drainage gas recovery, has not gone through any comprehensive indoor evaluation experiment, not to mention field experiment. Thus, this paper first theoretically verifies its feasibility through numerical simulation.
3.1 Modeling and meshing
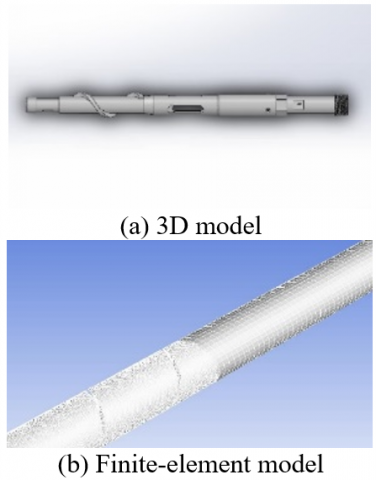
According to the structural design of the rotary flow jetting tool, a three-dimensional (3D) model was established by SolidWorks (Figure 2(a)). On this basis, the fluid domain of the tool was extracted through Boolean operation. Then, a 10m-long pipe of the tool was meshed into grids through Meshing. To make the calculation more efficient, the key parts of the tool were meshed into denser grids (Figure 2(b)).
During the numerical simulation, the Euler model was selected for the multiphase flow, and the Reynolds stress model for the turbulence [15, 16]. The fluid was set as air and water. The velocity inlet boundary condition was adopted for the inlet, with the velocity of 7.76m/s; the free outflow boundary condition was adopted for the outlet, using the standard wall function, using the liquid phase volume fraction of 0.01, and the relaxation factor of 0.3. The finite-element model was solved by the Semi-Implicit Method for Pressure Linked Equations (SIMPLE) algorithm.
3.2 Grid independence test
The results of fluid simulation partly depend on grid quality. For a specific geometric model, the smaller the grid size, the greater the number of grids, and the more accurate the calculation. However, the calculation will be prolonged if there are too many grids, and the calculation accuracy will not linearly increase with the number of grids. Hence, the finite-element model was subject to grid independence test.
The authors designed a simulation plan (Table 2) to verify the effects of structured grids, unstructured grids, and number of grids on the calculation accuracy.
Figure 2. The modeling and meshing of rotary flow jetting tool
Table 2. The levels of grid number
|
Name of plan |
Plan 1 |
Plan 2 |
Plan 3 |
Plan 4 |
Plan 5 |
Plan 6 |
|
Number of structured grids |
889511 |
1265345 |
1684313 |
2097224 |
2488799 |
2936852 |
|
Number of unstructured grids |
818433 |
1368472 |
1634247 |
2184569 |
2588384 |
3057643 |
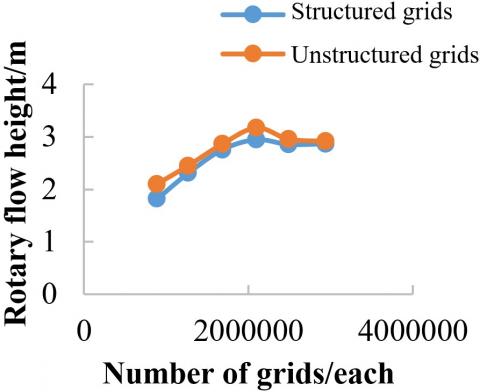
The six plans were simulated under the same working conditions. Taking the rotary flow height as the metric, a broken line graph was plotted based on the rotary flow heights and number of grids in the six plans (Figure 3). Obviously, the rotary flow height increased to a certain extent with the growing number of grids. When the number of structured grids reached 2,097,224, the rotary flow height rose to the peak of 2.95m; further growth in the grid number reduced the rotary flow height. When the number of unstructured grids increased to 2,184,569, the rotary flow height peaked at 3.18m; with further growth in the grid number, the rotary flow height changed gently and tended to decline.
The above results reflect the existence of an optimal number of grids for both structured and unstructured grids. More grids are not necessarily better. In addition, the two meshing methods had basically the same impact on the vortex flow height, indicating that the meshing method has a negligible influence on calculation accuracy. Comparatively, structured grids converged faster than unstructured grids. As a result, the structured grids and the grid number in Plan 3 were adopted for case study.
Figure 3. The broken line graph on grid independence
3.3 Numerical simulation and results analysis
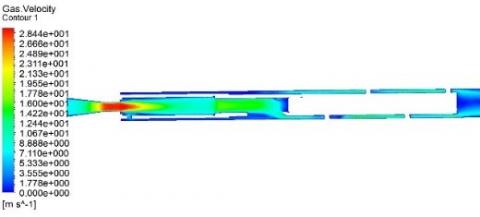
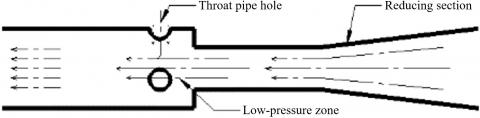
The designed rotary flow jetting tool was simulated on simulation software. The cloud map of the velocity distribution of the tool is presented in Figure 4. The velocity was relatively fast at the nozzle. The reason is that: after passing through the reducing section of jet sub, the fluid witnesses a decrease in potential energy, an increase in kinetic energy, and an exponential growth in velocity, creating a low-pressure zone at the inlet of the throat pipe.
The velocity on both sides of the throat pipe approximated zero. This is because the air cannot pass through these gaps between the walls of the tubing and throat pipe. These gaps are mainly the droplet falling zone. The low-pressure zone at the inlet of the throat pipe leads to a pressure difference, under which the liquid falling between the walls of the tubing and throat pipe enter the throat pipe via the holes on that pipe, and then mix with the subsequent gas (Figure 5). At the throat pipe, the gas phase and liquid phase are completely mixed, and achieved a consistent flow rate through moment exchange. Then, the mixed flow diffuses through the draft pipe, and flows to the cyclone.
In addition, the velocity increased in the vortex flow part. The main reason is as follows: Under a constant flow rate, the fluid velocity increases with the reduction in the cross-sectional area. Under the guidance of the spiral, the fluid obtains centrifugal acceleration, and the heavier liquid is thrown to the pipe wall to form a liquid film. The film rises spirally along the wall, forming a rotary flow. The lighter gas flows along the middle of the tubing (Figures 6(a) and 6(b)). Meanwhile, when the liquid is thrown to the pipe wall, the compressible gas expands. Whereas the flow area of the wellbore remains unchanged, the gas velocity at the center of the wellbore increases, towering over the velocity of the liquid film on the pipe wall.
The simulation results show that the rotary flow jetting tool can generate a rotary flow, and have a certain drainage effect. Therefore, it is feasible to implement the tool for drainage gas recovery of gas wells.
Figure 4. The cloud map of velocity distribution
Figure 5. The sketch map of jet sub and throat pipe inlet
(a) Fluid trajectory after passing the cyclone
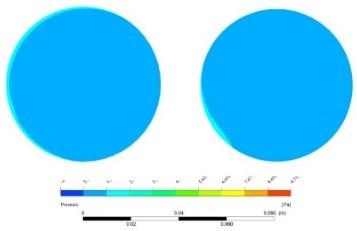
(b) Liquid phase distribution at different positions after passing the cyclone
Figure 6. The fluid flow trajectory and phase distribution
4.1 Experimental device
Compared with numerical simulation, the indoor simulation experiment can intuitively reflect the change of fluid flow pattern and discharge volume before and after the tool is loaded into the wellbore. In addition, the indoor simulation experiment is more accurate and instructive than numerical simulation. Therefore, this paper designs an indoor experiment device for the rotary flow jetting tool based on the principle of similarity, and relies on the device to observe the flow pattern changes in the wellbore and verify the effect of rotary flow jetting tool in drainage gas recovery.
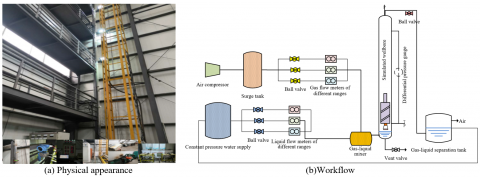
The physical appearance and flow chart of the designed indoor experiment device are given in Figure 7. The proposed device mainly encompasses of a gas supply system, a liquid supply system, a gas-liquid mixer, a plexiglass column system, a data acquisition system, and a gas-liquid separation tank.
There are three pressure measuring points and one pressure drop point in the experimental platform. Pressure measuring point 1 is located at the tool inlet, pressure measuring point 2 at the tool outlet, and pressure measuring point 3 at 5.7m from the tool inlet. The starting point and end point of the differential pressure gauge are at pressure measuring point 2 and 10.5m from the tool inlet, respectively; the precision of the gauge (0.1) meets the experimental standard.
The liquid discharged to the wellhead was measured by a real-time weighing device every 0.002s. From the weight of the discharged liquid, it is possible to derive the weight of liquid carried out by different rotary flow jetting tools. The gas-liquid mixer uses a patented equipment to mix the gas phase with the liquid phase, so that the gas-liquid phase entering the pipe is a mixed state rather than discrete state. This ensures the full operation of the rotary flow jetting tool. The air compressor can provide an air volume of 2,400m3/d. The surge tank ensures that the pressure of the gas entering the pipe does not fluctuate.
Figure 7. The experimental device
4.2 Experimental plan
This paper designs a set of optimization methods for the structural parameters of the rotary flow jetting tool based on orthogonal experiments. The orthogonal experiment is an important yet simple, efficient and intuitive mathematical method for testing multiple factors. Based on orthogonality, this method selects representative points from full-scale test, which are evenly dispersed, neat and comparable, and then analyzes the experimental results by mathematical statistics.
The rotary flow jetting tool is a novel instrument for drainage gas recovery. The mechanism of the tool remains unclear. To optimize its structural parameters, the key influencing factors were identified according to the structural features and the successful cases on jet flow and vortex flow jetting tool.
The optimal helix angle of vortex flow jetting tool is between 45° and 60° [17]. The wing width, which mainly affects the working distance of the vortex flow jetting tool, is optimized between 2 and 14mm. The pitch diameter of spiral body is directly related to the gas flow rate; Every 1mm increment in the diameter of the spiral body reduces the minimum gas volume by 15%-20%. For the jetting device, Lu Hongqi put the best throat-nozzle distance at 0.5-1 times the diameter of the throat pipe.
In order to cover more key factors, this paper selects 7 factors for structural parameter optimization: number of side hole of throat pipe, throat pipe length, nozzle diameter, throat-nozzle distance, pitch diameter of spiral body, helix angle, and wing width. Among them, 2 levels were designed for number of side hole of throat pipe, and 4 levels for every other factor. Following the principle of orthogonal experiment design, our experiments adopt the L32(21 47) hybrid orthogonal table. The value of each factor on each level is given in Table 3.
During the experiments, a 0.25m3 hydrostatic column was injected to the mixing pipe section, and then the gas was injected at the gas phase volume flow rate of 80m3/h. The maximum height of the rotary flow was recorded, so was the maximum discharge volume in 10min. Through the above steps, the 32 tool combinations with different structural parameters in the orthogonal table were tested one after another. Table 4 displays the tool combinations and their results, where the null term is the error term. Taking the discharge volume and rotary flow height as evaluation metrics, the experimental results were assessed through range analysis and variance analysis, revealing the optimal combination of structural parameters in the given ranges.
4.3 Range analysis
Taking the discharge volume and rotary flow height as evaluation metrics, the main influencing factors were identified through range analysis. The factors identified by each metric were combined to find the optimal parameter combination, which maximizes the discharge volume and rotary flow height. The results of range analysis provide an institutive picture of the primary and secondary factors and their optimal combination.
The range R reflects how much the variation of a factor affects the experimental results. The R value is positively correlated with the influence, i.e., the importance of the factor. The R value can be calculated by:
$\mathrm{R}=\max \bar{K}_{l}-\min \bar{K}_{l}$ (1)
where, $\mathrm{K}_{i}$ is the sum of experimental values on the same level; $\bar{K}_{l}$ is the mean experimental value of all factors on the same level.
Table 3. The factor-level table
|
Factor Level |
Number of side hole of throat pipe |
Throat pipe length |
Nozzle diameter |
Throat-nozzle distance |
Pitch diameter of spiral body |
Helix angle |
Wing width |
|
1 |
3 |
190 |
10 |
26 |
30 |
45 |
4 |
|
2 |
4 |
209 |
15 |
30 |
35 |
50 |
6 |
|
3 |
228 |
20 |
34 |
40 |
55 |
8 |
|
|
4 |
247 |
25 |
38 |
45 |
60 |
10 |
Table 4. The tool combinations and experimental results
|
Factor Level |
Number of side hole of throat pipe |
Throat pipe length |
Nozzle diameter |
Throat-nozzle distance |
Pitch diameter of spiral body |
Helix angle |
Wing width |
Null term |
Discharge volume/kg |
Rotary flow height/m |
|
1 |
3 |
190 |
10 |
26 |
30 |
45° |
4 |
1 |
1.88 |
1.8 |
|
2 |
3 |
190 |
15 |
30 |
35 |
50° |
6 |
2 |
1.59 |
4 |
|
3 |
3 |
190 |
20 |
34 |
40 |
55° |
8 |
3 |
1.43 |
1.3 |
|
4 |
3 |
190 |
25 |
38 |
45 |
60° |
10 |
4 |
3.1 |
4.5 |
|
5 |
3 |
209 |
10 |
26 |
35 |
50° |
8 |
4 |
2.01 |
3.6 |
|
6 |
3 |
209 |
15 |
30 |
30 |
45° |
10 |
3 |
1.68 |
2.1 |
|
7 |
3 |
209 |
20 |
34 |
45 |
60° |
4 |
2 |
2.9 |
4 |
|
8 |
3 |
209 |
25 |
38 |
40 |
55° |
6 |
1 |
1.74 |
3.2 |
|
9 |
3 |
228 |
10 |
30 |
40 |
60° |
4 |
3 |
1 |
2.8 |
|
10 |
3 |
228 |
15 |
26 |
45 |
55° |
6 |
4 |
1.84 |
3.6 |
|
11 |
3 |
228 |
20 |
38 |
30 |
50° |
8 |
1 |
1.44 |
1 |
|
12 |
3 |
228 |
25 |
34 |
35 |
45° |
10 |
2 |
1.65 |
1.2 |
|
13 |
3 |
247 |
10 |
30 |
45 |
55° |
8 |
2 |
2.08 |
3.6 |
|
14 |
3 |
247 |
15 |
26 |
40 |
60° |
10 |
1 |
1.86 |
2.2 |
|
15 |
3 |
247 |
20 |
38 |
35 |
45° |
4 |
4 |
2.91 |
3.8 |
|
16 |
3 |
247 |
25 |
34 |
30 |
50° |
6 |
3 |
1.87 |
2.9 |
|
17 |
4 |
190 |
10 |
38 |
30 |
60° |
6 |
2 |
2.03 |
0.4 |
|
18 |
4 |
190 |
15 |
34 |
35 |
55° |
4 |
1 |
1.71 |
1.6 |
|
19 |
4 |
190 |
20 |
30 |
40 |
50° |
10 |
4 |
2.21 |
3.6 |
|
20 |
4 |
190 |
25 |
26 |
45 |
45° |
8 |
3 |
2.16 |
4.7 |
|
21 |
4 |
209 |
10 |
38 |
35 |
55° |
10 |
3 |
1.94 |
3.6 |
|
22 |
4 |
209 |
15 |
34 |
30 |
60° |
8 |
4 |
1.51 |
2 |
|
23 |
4 |
209 |
20 |
30 |
45 |
45° |
6 |
1 |
2.09 |
4 |
|
24 |
4 |
209 |
25 |
26 |
40 |
50° |
4 |
2 |
1.77 |
2 |
|
25 |
4 |
228 |
10 |
34 |
40 |
45° |
6 |
4 |
1.97 |
4.8 |
|
26 |
4 |
228 |
15 |
38 |
45 |
50° |
4 |
3 |
2.03 |
3.5 |
|
27 |
4 |
228 |
20 |
26 |
30 |
55° |
10 |
2 |
1.46 |
1 |
|
28 |
4 |
228 |
25 |
30 |
35 |
60° |
8 |
1 |
1.97 |
0.75 |
|
29 |
4 |
247 |
10 |
34 |
45 |
50° |
10 |
1 |
2.16 |
5.3 |
|
30 |
4 |
247 |
15 |
38 |
40 |
45° |
8 |
2 |
2.11 |
3.5 |
|
31 |
4 |
247 |
20 |
26 |
35 |
60° |
6 |
3 |
2 |
1.4 |
|
32 |
4 |
247 |
25 |
30 |
30 |
55° |
4 |
4 |
2.49 |
2.6 |
Table 5 provides the range values evaluated by rotary flow height. These values help to identify the optimal parameter combination from the perspective of rotary flow height, and measure how much each parameter affects rotary flow height. By the impact on rotary flow height, the structural parameters can be ranked as pitch diameter of spiral body>helix angle>throat pipe length>nozzle diameter>spiral body>wing width>throat-nozzle distance> number of side holes of throat pipe. The optimal parameter combination is: pitch diameter of spiral body=45mm, helix angle=55°, throat pipe length=247mm, nozzle diameter=15mm, wing width=6mm, throat-nozzle distance=30mm, and number of side hole of throat pipe=3.
Table 6 provides the range values evaluated by discharge volume. By the impact on discharge volume, the structural parameters can be ranked as throat pipe length>pitch diameter of spiral body>throat-nozzle distance>wing width>nozzle diameter>helix angle>number of side hole of throat pipe. The optimal parameter combination is: throat pipe length=247mm, pitch diameter of spiral body=45mm, throat-nozzle distance=38mm, wing width=4mm, nozzle diameter=25mm, helix angle=60°, and number of side hole of throat pipe=4.
Both rotary flow height and discharge volume demonstrate the performance of the rotary flow jetting tool. The range results of the two metrics can fully reflect various properties of the tool. Comparing the optimization results by the two metrics, the structural parameters that optimize the various properties of the tool are: pitch diameter of spiral body=45mm, throat pipe length=247mm, helix angle=55°-60°, wing width=4-6mm, nozzle diameter=15-25mm, and throat-nozzle distance=30-38mm; the number of side hole of throat pipe has no significant impact on the tool performance.
4.4 Variance analysis
In variance analysis, the F(3.28) distribution table was looked up for the given level $\mathrm{P}\{\mathrm{F}>\lambda\}=0.10$, at the confidence of 0.9 and $\lambda=2.91$. If $F>\lambda$, then different structural parameters have significant differences; if $\mathrm{F}<\lambda$, the different structural parameters do not have significant differences.
As shown in Table 7, pitch diameter of spiral body is the only parameter that significantly affect the rotary flow height of the rotary flow jetting tool. As shown in Table 8, the discharge volume of the tool is significantly affected by the following factors: throat pipe length, nozzle diameter, throat-nozzle distance, pitch diameter of spiral body, helix angle, and wing width.
Table 5. The range analysis results evaluated by rotary flow height
|
Metric |
$\overline{\boldsymbol{K}_{\boldsymbol{l}}}$ |
A |
B |
C |
D |
E |
F |
G |
H |
|
Number of side hole of throat pipe |
Throat pipe length |
Nozzle diameter |
Throat-nozzle distance |
Pitch diameter of spiral body |
Helix angle |
Wing width |
|||
|
Rotary flow height |
$\overline{K_{1}}$ |
2.85 |
2.737 |
3.237 |
2.537 |
1.725 |
3.238 |
2.763 |
2.969 |
|
$\overline{K_{2}}$ |
2.797 |
3.063 |
2.813 |
2.931 |
2.494 |
3.238 |
3.038 |
3.35 |
|
|
$\overline{K_{3}}$ |
2.331 |
2.512 |
2.888 |
2.925 |
2.563 |
2.556 |
2.35 |
||
|
$\overline{K_{4}}$ |
3.163 |
2.731 |
2.938 |
4.15 |
2.56 |
2.938 |
2.625 |
||
|
R |
0.053 |
0.831 |
0.725 |
0.4 |
2.425 |
0.981 |
0.481 |
1 |
|
|
Ranking |
8 |
4 |
5 |
7 |
1 |
3 |
6 |
2 |
Table 6. The range analysis results evaluated by discharge volume
|
Metric |
$\overline{\boldsymbol{K}_{\boldsymbol{l}}}$ |
A |
B |
C |
D |
E |
F |
G |
H |
|
Number of side hole of throat pipe |
Throat pipe length |
Nozzle diameter |
Throat-nozzle distance |
Pitch diameter of spiral body |
Helix angle |
Wing width |
|||
|
Discharge volume |
$\overline{K_{1}}$ |
1.927 |
2.014 |
1.834 |
1.787 |
1.795 |
1.985 |
2.153 |
2.05 |
|
$\overline{K_{2}}$ |
1.94 |
1.909 |
1.751 |
1.956 |
1.927 |
1.839 |
1.781 |
1.883 |
|
|
$\overline{K_{3}}$ |
1.626 |
2.005 |
1.829 |
1.758 |
1.796 |
1.793 |
1.903 |
||
|
$\overline{K_{4}}$ |
2.185 |
2.094 |
2.162 |
2.255 |
2.113 |
2.007 |
1.898 |
||
|
R |
0.013 |
0.559 |
0.342 |
0.376 |
0.498 |
0.317 |
0.373 |
0.167 |
|
|
Ranking |
8 |
1 |
5 |
3 |
2 |
6 |
4 |
7 |
Table 7. The variance analysis results evaluated by rotary flow height
|
Source of variation |
Degrees of freedom |
Sum of squares |
Mean square |
F ratio |
Significance |
|
Number of side hole of throat pipe |
1 |
0.0226 |
0.02258 |
0.02 |
|
|
Throat pipe length |
3 |
3.3740 |
1.2466 |
0.84 |
|
|
Nozzle diameter |
3 |
2.2140 |
0.73799 |
0.55 |
|
|
Throat-nozzle distance Pitch diameter of spiral body Helix angle Wing width |
3 3 3 3 |
0.8840 24.6827 5.8615 1.0715 |
0.29466 8.22758 1.95383 0.35716 |
0.22 6.13 1.45 0.27 |
**
|
|
Error |
12 |
16.1149 |
1.34289 |
|
|
Table 8. The variance analysis results evaluated by discharge volume
|
Source of variation |
Degrees of freedom |
Sum of squares |
Mean square |
F ratio |
Significance |
|
Number of side hole of throat pipe |
1 |
0.00139 |
0.001391 |
0.03 |
|
|
Throat pipe length |
3 |
1.31685 |
0.438950 |
8.16 |
** |
|
Nozzle diameter |
3 |
0.66770 |
0.222566 |
4.14 |
** |
|
Throat-nozzle distance Pitch diameter of spiral body Helix angle Wing width |
3 3 3 3 |
0.68268 1.22917 0.50186 0.77576 |
0.227559 0.409724 0.167286 0.258587 |
4.23 7.62 3.11 4.81 |
** ** ** ** |
|
Error |
12 |
0.64553 |
0.053794 |
|
|
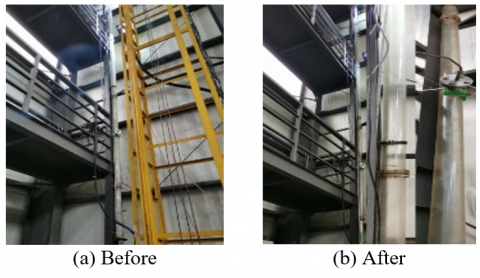
Figure 8. The flow patterns of the wellbore before and after loading the optimized tool
The nozzle diameter should be as large as possible, for an excessively small diameter inevitably causes large throttling loss. When the nozzle diameter and air volume remain constant, the throat-nozzle distance should be maximized to give the fluid sufficient kinetic energy.
Based on the multi-objective analysis results of the orthogonal experiments, the rotary jetting flow tool was manufactured under the following parameters: pitch diameter of spiral body=45mm, throat pipe length=247mm, helix angle=60°, wing width=4mm, nozzle diameter=25mm, throat-nozzle distance=38mm, and number of side hole of throat pipe=4. Then, an experiment was conducted under the same working conditions. The discharge volume and maximum rotary flow height of the optimized tool were 3.1kg and 7.8m, respectively, better than those of any parameter combination in the orthogonal table.
Figure 8 compares the flow patterns of the wellbore before and after loading the optimized rotary flow jetting tool. It can be clearly seen that the gas-liquid two-phase flow in the wellbore changed from the stirred flow to rotary flow.
(1) This paper designs a downhole rotary jetting flow tool for drainage gas recovery, verifies its feasibility through fluid simulation, and carries out grid independence test. The results show that the meshing method has little impact on calculation accuracy, and the designed tool is feasible for drainage gas recovery in gas wells.
(2) Based on the principle of orthogonal experiment, the rotary flow jetting tool was subject to multi-objective optimization. The optimization results simultaneously improve discharge volume and rotary flow height: pitch diameter of spiral body=45mm, throat pipe length=247mm, helix angle=55°-60°, wing width=4-6mm, nozzle diameter=15-25mm, throat-nozzle distance=30-38mm; the number of side hole of throat pipe does not have any significant impact on the tool performance.
(3) The optimized tool was tested indoor, which further proves that the tool can convert the stirred flow in the wellbore into rotary flow. In addition, the tool with the optimal structural parameters achieved better discharge effect than any unoptimized tool, and also realized relatively good rotary flow height. The optimization results provide a reference for field application.
This paper was supported by National Major Special Project “Research on artificial lift technology and matching technology of whole production process in CO2-drive Reservoirs” (Grant No.: 2016ZX05056004-002) and National Natural Science Foundation: “Identification and optimization of complex system based on Hybrid data and its application in low permeability oil wells” (Grant No.: 61572084).
[1] Alamu, M.B. (2012). Gas-well liquid loading probed with advanced instrumentation. SPE Journal, 17(1): 251-270. https://doi.org/10.2118/153724-PA
[2] Surendra, M., Falcone, G., Teodoriu, C. (2009). Investigation of swirl flows applied to the oil and gas industry. SPE Projects, Facilities & Construction, 4(1): 1-6. https://doi.org/10.2118/115938-PA
[3] Davailles, A., Climent, E., & Bourgeois, F. (2012). Fundamental understanding of swirling flow pattern in hydrocyclones. Separation and Purification Technology, 92: 152-160. https://doi.org/10.1016/j.seppur.2011.12.011
[4] Putra, S.A., Christiansen, R.L. (2001). Design of tubing collar inserts for producing gas wells below their critical velocity. SPE Annual Technical Conference and Exhibition, New Orleans, Louisiana. https://doi.org/10.2118/71554-MS
[5] Lane, D.L., Prince, W.D. (2004). U.S. Patent No. 6,749,374. Washington, DC: U.S. Patent and Trademark Office.
[6] Surendra, M., Falcone, G., Teodoriu, C. (2009). Investigation of swirl flows applied to the oil and gas industry. SPE Projects, Facilities & Construction, 4(1): 1-6. https://doi.org/10.2118/115938-MS
[7] Ali, A.J., Scott, S.L., Fehn, B. (2005). Investigation of new tool to unload liquids from stripper-gas wells. SPE production & facilities, 20(4): 306-316. https://doi.org/10.2118/84136-PA
[8] Yilmaz, M., Comakli, O., Yapici, S., Sara, O.N. (2003). Heat transfer and friction characteristics in decaying swirl flow generated by different radial guide vane swirl generators. Energy Conversion and Management, 44(2): 283-300.https://doi.org/10.1016/S0196-8904(02)00053-5
[9] Roux, S., Lartigue, G., Poinsot, T., Meier, U., Bérat, C. (2005). Studies of mean and unsteady flow in a swirled combustor using experiments, acoustic analysis, and large eddy simulations. Combustion and Flame, 141(1-2): 40-54. https://doi.org/10.1016/j.combustflame.2004.12.007
[10] Algifri, A.H., Bhardwaj, R.K. (1985). Prediction of the heat transfer for decaying turbulent swirl flow in a tube. International journal of heat and mass transfer, 28(9): 1637-1643. https://doi.org/10.1016/0017-9310(85)90138-3
[11] Bose, R. (2007). Unloading using auger tool and foam and experimental identification of liquid loading of low rate natural gas wells (Doctoral dissertation, Texas A&M University).
[12] Yusuf, R., Veeken, C.A., Hu, B. (2010). Investigation of gas well liquid loading with a transient multiphase flow model. SPE Oil and Gas India Conference and Exhibition, Mumbai, India. https://doi.org/10.2118/128470-MS
[13] Poppenhagen, K.L., Harms, L.K., Wilkinson, R., Glover, D.E. (2010). Deliquification of South Texas Gas Wells Using Corrosion Resistant Coiled Tubing: A 6-Year Case History. SPE/ICoTA Coiled Tubing and Well Intervention Conference and Exhibition, Texas, USA. https://doi.org/10.2118/130632-MS
[14] Jones, W.P., Lettieri, C., Marquis, A.J., Navarro-Martinez, S. (2012). Large eddy simulation of the two-phase flow in an experimental swirl-stabilized burner. International Journal of Heat and Fluid Flow, 38: 145-158. https://doi.org/10.1016/j.ijheatfluidflow.2012.09.001
[15] Launder, B.E., Reece, G.J., Rodi, W. (1975). Progress in the development of a Reynolds-stress turbulence closure. Journal of Fluid Mechanics, 68(3): 537-566. https://doi.org/10.2514/3.12149
[16] Li, J., Li, N., Li, J.Y., Wang, Y., Cao, G.Q. (2013). Numerical simulation research on eddy current drainage gas recovery technology. Oil Drilling & Production Technology, 11(6): 65-68.
[17] Liu, Y., Xie, C., Li, X., Lu, G., Tang, L., Tan, X. (2020). Optimization analysis of structure parameters of downhole vortex tool based on CFD and orthogonal studies. Journal of Petroleum Science and Engineering, 190: 107030. https://doi.org/10.1016/j.petrol.2020.107030