Muhammad Yusan Naim | Henny Pramoedyo | Nuddin Harahab | Syarifuddin Nodjeng | Sudirman Syam*
© 2020 IIETA. This article is published by IIETA and is licensed under the CC BY 4.0 license (http://creativecommons.org/licenses/by/4.0/).
OPEN ACCESS
The effect of developing hybrid resources on the management outcomes of micro-hydropower plants in remote areas has been studied and analyzed. The hybrid resource is a combination of two energy sources, such as water and solar energy, that operate together in meeting the needs of electrical power in Ambava Village, Tinondo Sub-district, East-Kolaka Regency, Southeast Sulawesi Province. This study has used a management model describing the relationship and influence of latent variables and their manifestation variables. Here, Confirmatory Factor Analysis (CFA) based Common-Pool-Resources (CPR) is the proper method of testing the structural model used. The results show that the Critics-Ratio (CR) and Standard Loading Factor (SLF) have fulfilled the expected value. The direct influence of the variable exogenous hybrid resources to the endogenous variable outcome of 0.213 has fulfilled the Gold of Fit criteria. Then, the direct impact of the most dominant latent variable is the operating dimension of the resource. At the same time, the indirect effect on the manifest variable is the increase in electricity reserve. Furthermore, the most dominant indirect impact of the hybrid resources latent variable is the benefit and cost dimensions, while the most dominant manifest variable is people's welfare savings.
administration, solar energy, water energy, hybrid system, power generation, Common- Pool-Resources
Some literature on common-pool resources and the common property has developed rapidly [1-3]. Globally there are concerns about environmental degradation and depletion of resources stimulated this growth [4]. Failures related to market-oriented management systems and policies have disappointed communities toward policymakers as actors governing forests, grasslands, water, and fisheries. The primary concern of writings on common property is to show that variations in property rights variations make a difference in resource management outcomes. Therefore, students' insights on the common property have found complete expression as a policy innovation, with multiple governments decentralizing environmental management and promoting community-based conservation [5]. These policy changes redefined communities, resource management, and local arrangements to govern the commons in many instances.
Several water resources have been developed by the regional governments, cooperatives, non-governmental organizations (NGOs), and private companies. However, there are still many technical and non-technical issues that require proper management. This is similar to several micro-hydro resource development cases in remote areas, such as in the village of Ambapa, which has experienced congestion with threats to stop operation from 2015 to date. In general, the existence of water resources in the area can generally operate during the rainy season. However, there will be disturbances in terms of technical aspects when the water potential is reduced due to the long dry season. Therefore, the supply of electricity is dependent on water resources and other potential sources. Several alternative solutions from previous studies [6-8] can be applied; however, they do not involve the hybrid resources' effect on the benefits for the user community [9].
This paper presents a critical assessment of the effect of hybrid sources on management outcomes. There are two dimensions as exogenous variables in hybrid sources and three dimensions as endogenous variables in management outcomes. After briefly discussing two measurement models, such as the partial model and the full model and their achievements, the final model discusses a combination of full fit model measurement methods.
2.1 Development of water energy as hybrid resources
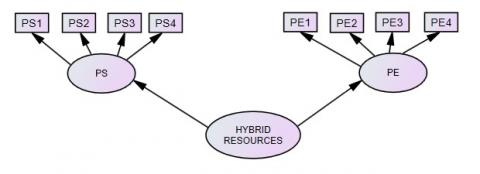
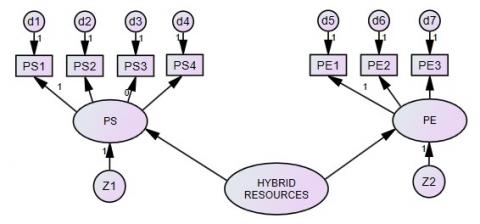
Hybrid resources are conceptually defined as combining two or more resources such as micro-hydro and solar to generate electrical energy [10, 11]. It is also defined as a latent variable not measured directly; therefore, it is necessary to determine the latent variable's manifest. This research utilized the CFA method [12] based on CPR [13], which consists of several manifest variables to estimate the hybrid resources, as shown in Figure 1.
The application tends to provide a continuous energy supply even during the prolonged dry season and cloudy weather. In the long dry season, the water discharge reduces, thereby decreasing energy supply. During cloudy weather, the intensity of sunlight decreases; therefore, the solar module uses low energy to charge the battery, which reduces the energy supply. Therefore, its development is appropriate for maintaining a sustainable energy supply. In addition, it also limits the use of excessive energy supply in a community, thereby preventing the existence of excessive load. All efforts related to hybrid resources affect the increase in electricity costs and are expected to be no more than a regular monthly electricity charge [14]. It is also developed to stabilize the voltage and peak frequency of load at night.
Figure 1. Estimated model of hybrid resources variable
2.2 Outcome for the user community
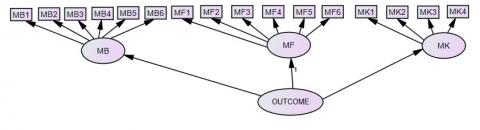
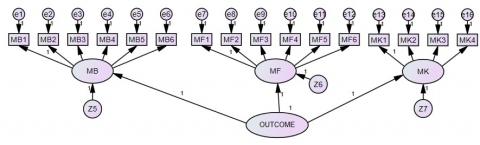
The outcome is defined as the user community's benefits in fulfilling their electrical obligations [15], associated with payment, community activities, provision of capital, and community welfare. It is also defined as a latent variable that is not directly measured; therefore, it is necessary to determine the manifest variable from the estimated model's outcome, as shown in Figure 2. The use of electricity at night increases the community activities throughout the day and improves its quality of life and income. This means that production increases because it is no longer dependent on the use of the generator-set. Also, there is an increase in public knowledge due to electronic news availability in 24 hours and modern tools. Furthermore, the management of resources based on the principle of CPR increases income because the benefits earned are returned to the community in working capital, savings, and infrastructure development.
2.3 Operational concepts of latent variables
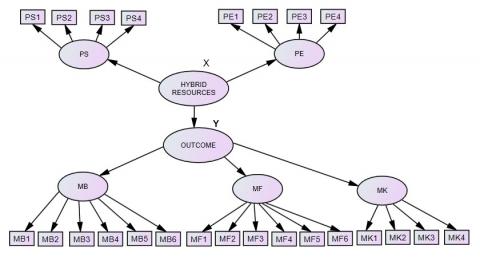
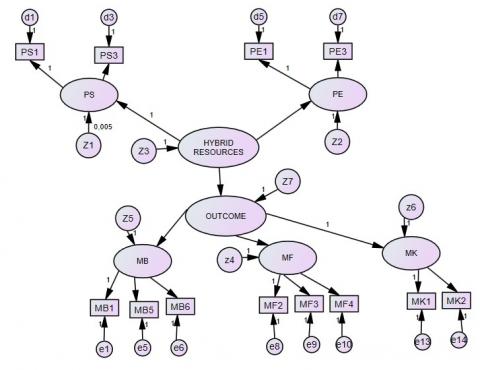
The operational concept of the two latent variables showed the presence of a causal relationship [16]. Hybrid resources are measured from its manifest, which describes that the continuous power supply operation provides measurable outcomes from its manifest variable. The causal relationship is seen in the full model estimation in Figure 3.
Figure 2. Estimated model of outcome variable
Figure 3. Full model estimation
This Figure 3 shows that when the hybrid resources influence the outcome, it is called the exogenous variable (X), and the reverse is the case; it is known as the endogenous variable (Y). Based on the operational concepts of both, the research hypotheses (H) are obtained as follows:
3.1 Design requirements
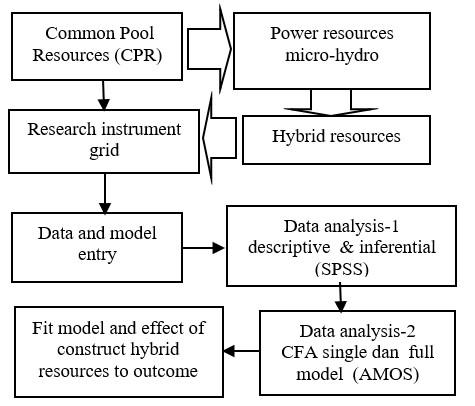
This is a quantitative research using qualitative data quantized. The research is based on the conceptual theory of the Institutional Framework and CPR development [17-19]. Research indicators are obtained by developing both variables resources micro-hydro and outcomes to produce a holistic, complex, and dynamic study. Therefore, the acquired problems are temporary and tend to evolve at the data collection stage, which is divided into six steps.
Firstly, data collection is done by calculating all indicators of the respondent's answer option in the form of a score. This stage is carried out through surveys to the location of water resources and direct interviews with managers, as shown in Figure 4. In the form of qualitative data, the results were taken into consideration and used to produce the research instrument grid. The statements or questions are arranged in a questionnaire and distributed to a total of 215 respondents. In this study, the CPR method is used as a proper theory in constructing a grid.
Secondly, based on the Likert Method, statements are collected and tabulated in numbers from 1 to 5 and processed with the excel program. This raw data is tested and validated to obtain data entry's reliability and accuracy with the Statistical Package for Social Sciences (SPSS) program. Thirdly, data entry for each variable is analyzed using the Outler Model (OM) and Analysis Moment of Structural (AMOS) [20]. It generates two sets of variable fit models, such as the exogenous and endogenous variables' direct and indirect effects.
Figure 4. Research design
Furthermore, the fit variables are combined into a full model and are linked causally. Then, these variables are tested using an Inner Model (IM) by the interconnection between the exogenous and endogenous variables simultaneously. Finally, this model was tested and examined using the CFA analysis [12]. The result is a fit structural model used to analyze the relationships and the effects between variables.
3.2 Grid of research instruments
Tables 1 and 2 show the grid of instruments used in this study. Latent variables consist of two sets, including exogenous hybrid resources variables and endogenous outcome variables. Latent variables consist of 5 dimensions and 24 statements or manifest variables and their code.
Table 1. Instrument grid of the hybrid resources exogenous variable (X)
|
No. |
Dimensions |
Manifest variable (Indicators) |
Variable code |
|
1 |
Operation of resources (PS) |
|
PS1 |
|
|
|
|
PS2 |
|
|
|
|
PS3 |
|
|
|
|
PS4 |
|
2 |
Energy consumption (PE) |
|
PE1 |
|
|
|
|
PE2 |
|
|
|
|
PE3 |
|
|
|
|
PE4 |
Table 2. Instrument grid of outcome endogenous variable (Y)
|
No. |
Dimensions |
Manifest variable (Indicators) |
Variable code |
|
1 |
Benefit to community user |
|
MB1 |
|
|
(MB) |
|
MB2 |
|
|
|
|
MB3 |
|
|
|
|
MB4 |
|
|
|
|
MB5 |
|
|
|
|
MB6 |
|
2 |
Financial |
|
MF1 |
|
|
Benefits (MF) |
|
MF2 |
|
|
|
|
MF3 |
|
|
|
|
MF4 |
|
|
|
|
MF5 |
|
|
|
|
MF6 |
|
3 |
Capital and |
|
MK1 |
|
|
profits (MK) |
|
MK2 |
|
|
|
|
MK3 |
|
|
|
|
MK4 |
4.1 Analysis results
4.1.1 Descriptive statistics
a) Hybrid resources variable
Based on the outputs of the SPSS, it is described that most of the user community agrees with the use of hybrid resources. This is proven by measuring the indicators expressed in numbers within the range of 1-5. The questionnaire results showed all items of central tendency indicators with a median value of 4 and a mean of 4.18. This illustrates that most respondents tend to agree with the development of micro-hydro resources as hybrid resources.
b) Outcome variable
The output of the SPSS application program is described as having most user communities agree with the outcome. This can be proven by measuring the indicators, which are expressed in numbers (range 1-5). The questionnaire results show that all central tendency indicators with a median value of 4 and a mean of 4.31. This illustrates that most respondents tend to agree with the outcome for the user community.
4.1.2 Inferential statistical analysis
Model measurement is done after the data is obtained through a questionnaire instrument. The data is tested first by using the simultaneous reliability and validity test. In general, validity shows the measurement results of a questionnaire, while reliability is the instruments' consistency level. However, the items are deleted, assuming some questions do not pass this test. The test results are seen in Tables 3 and 4.
Table 3. Test results of hybrid resources
|
No. |
Variable relationship |
Estimate |
CR |
P |
||
|
1 |
Hybrid resources |
$\rightarrow$ |
PS |
1.000 |
- |
- |
|
2 |
PS |
$\rightarrow$ |
PS1 |
1.000 |
- |
- |
|
3 |
PS |
$\rightarrow$ |
PS3 |
1.673 |
7.102 |
*** |
|
4 |
Hybrid resources |
$\rightarrow$ |
PE |
1.615 |
5.300 |
*** |
|
5 |
PE |
$\rightarrow$ |
PE1 |
1.000 |
- |
- |
|
6 |
PE |
$\rightarrow$ |
PE3 |
0.672 |
5.970 |
*** |
Table 4. Result LFS of hybrid resources
|
No. |
Variable relationship |
Estimate |
||
|
1 |
Hybrid resources |
$\rightarrow$ |
PS |
0.867 |
|
2 |
PS |
$\rightarrow$ |
PS1 |
0.629 |
|
3 |
PS |
$\rightarrow$ |
PS3 |
0.879 |
|
4 |
Hybrid resources |
$\rightarrow$ |
PE |
0.875 |
|
5 |
PE |
$\rightarrow$ |
PE1 |
0.847 |
|
6 |
PE |
$\rightarrow$ |
PE2 |
0.544 |
a) Validity test
A validity test is essentially used to measure the correlation coefficient between scores of a question and a variable. The methods used in this study were corrected with Item-Total Correlation. Statistically, the correlation coefficients obtained must be compared with the r table criticism number (0.13). If the correlation coefficient is > 0.13 and the probability (P) value is < 0.05, the instrument is declared valid and vice versa; if the correlation coefficient < 0.13 and P-value > 0.05, the item is declared null and void. The hybrid resources variable's test results produce an r-count greater than 0.13 for each manifest variable except PE4, which was 0.129 with an r-count of less than 0.13. Therefore, the PE4 variable is invalid. Meanwhile, the outcome variable's test results produce an r-count for each manifest more significantly than 0.13; therefore, it is valid.
b) Reliability test
The reliability test is used to determine the consistency level; therefore, this research utilized the Cronbach's Alpha method. If alpha equals 0.6-0.79, the reliability is accepted, and it is more significant than 0.8, it is in a suitable category. The test result obtained an alpha value between 0.6-0.79 for the manifest variable of the hybrid resource's latent variable and 0.70-0.79 for the latent variable outcomes. This means all the reliability of the manifest variable is acceptable.
4.1.3 Measurement partial model
a) Measurement model of hybrid sources variable
The measurement model is a part of Structural Equation Modeling (SEM) consisting of a latent variable and several indicators to describe the relationship between variables. This study's measurement models were partial and separated from a hybrid resource variable instrument grid, as shown in Table 1.
Figure 5. Initial model of hybrid resources
Figure 6. Fit model of hybrid resources variable
The initial and final models are in AMOS and measurement, as shown in Figures 5 and 6. Assuming a negative variant and covariant is found, a modification is made to the measurement model. However, in the final result, no negative variants and covariants were found. Therefore, it is followed by a significant test of the dimensions and indicators that reflect the construct and validation tests. The constructs measurement model is accepted with assuming CR ≥ 1.96 or P ≤ 0.05, and LFS ≥ 0.5. Based on these criteria, except for P-value, the validation model has been tested and accepted, assuming that all the criteria values are met mainly as follows:
Table 5. Direct and indirect effects of hybrid resources
|
No. |
Variable |
Direct |
Indirect |
Total |
|
1 |
PE |
0.875 |
0 |
0.875 |
|
2 |
PE1 |
0 |
0.741 |
0.741 |
|
3 |
PE3 |
0 |
0.476 |
0.476 |
|
4 |
PS |
0.867 |
0 |
0.867 |
|
5 |
PS1 |
0 |
0.545 |
0.545 |
|
6 |
PS3 |
0 |
0.761 |
0.761 |
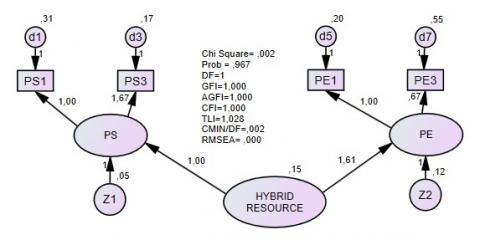
Tables 3, 4, and 5 show that all indicators of the manifest variable in the measurement meet all the criteria. Here the CR values for the variables PS3 = 7,172, PE = 5.3, and PE3 = 5.97, respectively. Likewise, for the P and LSF values, all variables have values above 0.005 and 0.5. Both PS and PE variables are dimensions that have a direct effect, while there are four manifest variables, each of which has no direct effect, namely PS1, PS3, PE1, and PE3. Thus, the measurement model of the hybrid resource construction can be accepted, and the model is fit, as shown in Figure 5. Based on this analysis, the hybrid resource-measurement model is acceptable and appropriate because most of its validity test criteria have been met, as shown in Figure 5. Therefore, both hypotheses H1 and H2 are accepted because hybrid resources have an influence significant direct effect on PS of 0.867 and PE of 0.875.
b) Measurement model of the outcome variable
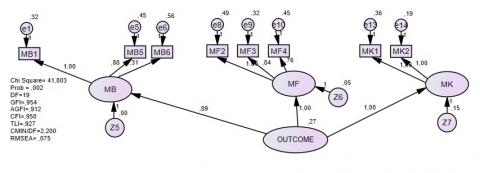
The measurement model is part of the Structural Equation Model (SEM) model, which consists of a latent variable and several manifest variables that can explain each variable's relationship and influence. The measurement model used in this study is the partial (single) measurement model. This measurement model's estimation is carried out separately or for each construct derived from the Outcome variable instrument grid (Table 2). Figures 7 and 8 show the outcome variable's initial model as the entry model of the AMOS program and the analysis results of the measurement model, respectively. Modifications were made to the measuring model, assuming negative variances and covariants were found. All variables manifested in the measurement models in Tables 6 and 7 have qualified CR, P, and LFS. Thus, the measurement model for the Outcome variable, as in Figure 8, can be accepted. That is, the model is fit because most of the model validation test criteria have been met.
Figure 7. Initial model of outcome variable
Figure 8. Fit model of outcome variable
Table 6. Test results of outcome variable
|
No. |
Variable relationship |
Estimate |
CR |
P |
||
|
1 |
Outcome |
$\rightarrow$ |
MF |
1.000 |
- |
|
|
2 |
MF |
$\rightarrow$ |
MF3 |
0.837 |
8.390 |
*** |
|
3 |
MF |
$\rightarrow$ |
MF4 |
0.764 |
6.740 |
*** |
|
4 |
Outcome |
$\rightarrow$ |
MK |
1.000 |
- |
|
|
5 |
MK |
$\rightarrow$ |
MK1 |
1.003 |
8.904 |
*** |
|
6 |
MK |
$\rightarrow$ |
MK2 |
1.000 |
- |
|
|
7 |
Outcome |
$\rightarrow$ |
MB |
0.892 |
8.227 |
*** |
|
8 |
MB |
$\rightarrow$ |
MB1 |
1.000 |
- |
|
|
9 |
MB |
$\rightarrow$ |
MB5 |
0.878 |
6.045 |
*** |
|
10 |
MB |
$\rightarrow$ |
MB6 |
1.307 |
7.188 |
*** |
Notes: ***<<< 0.05.
Table 7. Result LSF of the outcome variable
|
No. |
Variable relationship |
Estimate |
||
|
1 |
Outcome |
$\rightarrow$ |
MF |
0.922 |
|
2 |
MF |
$\rightarrow$ |
MF2 |
0.631 |
|
3 |
MF |
$\rightarrow$ |
MF3 |
0.641 |
|
4 |
MF |
$\rightarrow$ |
MF4 |
0.544 |
|
5 |
Outcome |
$\rightarrow$ |
MK |
0.803 |
|
6 |
MK |
$\rightarrow$ |
MK1 |
0.739 |
|
7 |
MK |
$\rightarrow$ |
MK2 |
0.833 |
|
8 |
Outcome |
$\rightarrow$ |
MB |
0.999 |
|
9 |
MB |
$\rightarrow$ |
MB1 |
0.639 |
|
10 |
MB |
$\rightarrow$ |
MB5 |
0.521 |
|
11 |
MB |
$\rightarrow$ |
MB6 |
0.632 |
Furthermore, Table 8 shows that the outcome variable, directly and indirectly, influences three dimensions and eight indicators. Based on all criteria, these indications show that benefit to community user (MB), financial benefits (MF), and benefits capital and property (MK) have a direct effect on outcome management. In contrast, all manifest variables (MK1, MK2, MF1, MF2, MF3, MF4, MB1, MB5, and MB6) have indirect effects on the result variable. As shown in Table 7, the H1 hypothesis is accepted since the outcome variable has a direct and significant effect on the PE dimensions with CR ≥ 1.96 or P ≤ 0.05. Meanwhile, H2 is also accepted due to associated hybrid resources and directly affects dimensions of MK with CR and P criteria as in the H1 hypothesis
Table 8. Direct and indirect effects of outcome variable
|
No. |
Variable |
Direct |
Indirect |
Total |
|
1 |
MK |
0.803 |
0 |
0.803 |
|
2 |
MK1 |
0 |
0.593 |
0.593 |
|
3 |
MK2 |
0 |
0.669 |
0.669 |
|
4 |
MF |
0.922 |
0 |
0.922 |
|
5 |
MF2 |
0 |
0.582 |
0.582 |
|
6 |
MF3 |
0 |
0.591 |
0.591 |
|
7 |
MF4 |
0 |
0.501 |
0.501 |
|
8 |
MB |
0.999 |
0 |
0.999 |
|
9 |
MB1 |
0 |
0.638 |
0.638 |
|
10 |
MB5 |
0 |
0.502 |
0.502 |
|
11 |
MB6 |
0 |
0.631 |
0.631 |
4.1.4 Measurement full model
According to Kanata [21], the two fit variables are combined into a structural model, consisting of the hybrid resource latent variable as an exogenous construct and the outcome as endogenous in the Full Test Model. In this study, the hybrid resource exogenous construct was formed from 4 manifest variables (PS1, PS3, PE1, and PE3), which affected the endogenous construct with seven manifest variables (MB1, MB6, MF2, MF3, MF4, MK1, and MK2).
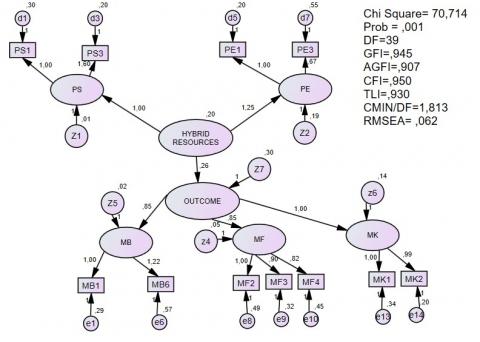
The effect of the hybrid resources latent variable on the outcome latent variable is analysed using the CFA Full Model. The effect of an exogenous variable on endogenous produces an initial structural model, as shown in Figure 9, which is tested for significance, validation, and feasibility. The Fit models in Figures 6 and 8 are incorporated into the data entry, and the model in the AMOS program becomes the Full Fit Model, as shown in Figure 10.
Figure 9. Initial full model
Figure 10. Fit full model
Table 9. Test results of fit full model
|
No. |
Variable relationship |
Estimate |
CR |
P |
||
|
1 |
Hybrid resources |
$\rightarrow$ |
Outcome |
0.264 |
2.301 |
0.021 |
|
2 |
Hybrid resources |
$\rightarrow$ |
PS |
1 |
- |
|
|
3 |
PS |
$\rightarrow$ |
PS1 |
1 |
- |
|
|
4 |
PS |
$\rightarrow$ |
PS3 |
1.596 |
7.553 |
*** |
|
5 |
Hybrid resources |
$\rightarrow$ |
PE |
1.25 |
7.299 |
*** |
|
6 |
PE |
$\rightarrow$ |
PE1 |
1 |
- |
|
|
7 |
PE |
$\rightarrow$ |
PE3 |
0.673 |
6.019 |
*** |
|
8 |
Outcome |
$\rightarrow$ |
MK |
1 |
- |
|
|
9 |
MK |
$\rightarrow$ |
MK1 |
1 |
- |
|
|
10 |
MK |
$\rightarrow$ |
MK2 |
0.987 |
8.805 |
*** |
|
11 |
Outcome |
$\rightarrow$ |
MF |
0.853 |
5.665 |
*** |
|
12 |
MF |
$\rightarrow$ |
MF2 |
1 |
- |
|
|
13 |
MF |
$\rightarrow$ |
MF3 |
0.897 |
6.588 |
*** |
|
14 |
MF |
$\rightarrow$ |
MF4 |
0.822 |
5.728 |
*** |
|
15 |
Outcome |
$\rightarrow$ |
MB |
0.852 |
6.397 |
*** |
|
16 |
MB |
$\rightarrow$ |
MB1 |
1 |
- |
|
|
17 |
MB |
$\rightarrow$ |
MB6 |
1.221 |
6.909 |
*** |
Notes: ***<<< 0.005.
In this test, the total manifest variable MB5 is not feasible; therefore, it is removed, and when a negative and covariant variant is found, the structural model is modified. In the final result, no negative and covariant variants were found; therefore, the process was continued by checking the significance of the dimensions and manifest variables. As a result, all CR, P, and LSF value requirements have been met, as shown in Tables 9 and 10.
Next, Table 11 indicates that the dimension of operation of resources (PS) and energy consumption (PE) directly affect the hybrid source variable, and there are only 3 out of 17 of the manifest variables (PE1, PS1, and PS3) have an indirect effect. Likewise, the other three dimensions, such as MB, MF, and MK, also directly affect the outcome variable, while there are only 6 out of 17 of the variables that indirectly influence (MB1, MB6, MF2, MF3, MK1, and MK2). This value also indicates that the H3 hypothesis was received because the hybrid resource variable significantly affected the outcome with CR (2.673) ≥ 1.96 and P (0.008) ≤ 0.05. Also, the structural model in Figure 10 is acceptable and suitable because most of the validation test criteria have been met, as follows:
Table 10. Result LFS of Fit Full model
|
No. |
Variable relationship |
Estimate |
||
|
1 |
Hybrid resources |
$\rightarrow$ |
Outcome |
0.213 |
|
2 |
Hybrid resources |
$\rightarrow$ |
PS |
0.988 |
|
3 |
PS |
$\rightarrow$ |
PS1 |
0.641 |
|
4 |
PS |
$\rightarrow$ |
PS3 |
0.854 |
|
5 |
Hybrid resources |
$\rightarrow$ |
PE |
0.787 |
|
6 |
PE |
$\rightarrow$ |
PE1 |
0.846 |
|
7 |
PE |
$\rightarrow$ |
PE3 |
0.545 |
|
8 |
Outcome |
$\rightarrow$ |
MK |
0.833 |
|
9 |
MK |
$\rightarrow$ |
MK1 |
0.753 |
|
10 |
MK |
$\rightarrow$ |
MK2 |
0.829 |
|
11 |
Outcome |
$\rightarrow$ |
MF |
0.906 |
|
12 |
MF |
$\rightarrow$ |
MF2 |
0.601 |
|
13 |
MF |
$\rightarrow$ |
MF3 |
0.640 |
|
14 |
MF |
$\rightarrow$ |
MF4 |
0.544 |
|
15 |
Outcome |
$\rightarrow$ |
MB |
0.963 |
|
16 |
MB |
$\rightarrow$ |
MB1 |
0.677 |
|
17 |
MB |
$\rightarrow$ |
MB6 |
0.625 |
Table 11. Direct and indirect effects of fit full model
|
No. |
Variable |
Hybrid Resources |
Outcome |
||||
|
Direct |
Indirect |
Total |
Direct |
Indirect |
Total |
||
|
1 |
Outcome |
0.213 |
0 |
0.213 |
0.213 |
0 |
0.213 |
|
2 |
MB |
0 |
0.205 |
0.205 |
0.963 |
0 |
0.963 |
|
3 |
MB1 |
0 |
0.139 |
0.139 |
0 |
0.652 |
0.652 |
|
4 |
MB6 |
0 |
0.128 |
0.128 |
0 |
0.602 |
0.602 |
|
5 |
MF |
0 |
0.193 |
0.193 |
0.906 |
0 |
0.906 |
|
6 |
MF2 |
0 |
0.116 |
0.116 |
0 |
0.545 |
0.545 |
|
7 |
MF3 |
0 |
0.123 |
0.123 |
0 |
0.58 |
0.58 |
|
8 |
MF4 |
0 |
0.105 |
0.105 |
0 |
0.493 |
0.493 |
|
9 |
MK |
0 |
0.177 |
0.177 |
0.833 |
0 |
0.833 |
|
10 |
MK1 |
0 |
0.133 |
0.133 |
0 |
0.628 |
0.628 |
|
11 |
MK2 |
0 |
0.147 |
0.147 |
0 |
0.691 |
0.691 |
|
12 |
PE |
0.787 |
0 |
0.787 |
0 |
0 |
0 |
|
13 |
PE1 |
0 |
0.666 |
0.666 |
0 |
0 |
0 |
|
14 |
PE3 |
0 |
0.429 |
0.429 |
0 |
0 |
0 |
|
15 |
PS |
0.988 |
0 |
0.988 |
0 |
0 |
0 |
|
16 |
PS1 |
0 |
0.633 |
0.633 |
0 |
0 |
0 |
|
17 |
PS3 |
0 |
0.844 |
0.844 |
0 |
0 |
0 |
4.2 Discussion
Based on the results of the CFA second-order test, the effect of the hybrid resources on the outcome latent variable is described as follows.
4.2.1 The effect of hybrid resources on the dimensions of the operation and electric energy consumption
Hybrid resources are proven to have a significant relationship and influence on the dimensions of operational resources (PS) that meet the criteria, as shown in Tables 9, 10, and 11. As shown in Table 11, hybrid resources have a direct effect on resource operations (PS) 0.988. This is reflected in the indirect effect of resources' operation on the manifest variable of fixed electricity supply even though the river water flow decreases (PS1 = 0.633) and experiences an increase in power reserve (PS3) by 0.833. This means that the hybrid resource variable has a relatively large and dominant influence in overcoming the shortage of electricity supply needed by the user community even though the river water discharge is reduced.
Hybrid resources are a combination of water and solar power resources that operate together to cover each resource's shortcomings and weaknesses. Thus, the supply of power does not stop and remains continuous in supplying energy needs for community users in Ambapa village [11]. Besides, hybrid resources affect the increase in power reserves and maintain the continuity of electricity supply for the user community during the dry season. Therefore, the management of micro hydropower plants as a hybrid resource is the most dominant influence in efforts to help reduce water resource shortages during the dry season and, at the same time, increase the reserves of electricity.
Likewise, the effect of Hybrid Resources on the dimensions of electrical energy use is very significant. In Table 11, it can be seen that Hybrid Resources has a direct effect on electricity consumption (PE) of 0.787. This is reflected in the indirect effect of Hybrid Resources on the manifest variable of limiting energy use (PE1 = 0.666) and the increase in the contribution of electrical energy (PE2 = 0.429). This means that hybrid resources have a significant influence on anticipating excessive energy use. Here, the use of useless electrical energy is limited for each user community so that hybrid resources can work optimally [22]. Besides, hybrid resources also affect increasing electricity contributions. This is influenced by the cost of building and developing solar energy resources in the form of procuring the main photovoltaic components. The additional cost is charged to the user community as low as possible every month to enjoy electricity sustainably with cheap electrical energy contributions.
4.2.2 The effect of the outcome on financial benefits, costs and working capital
The outcome is proven to have a relationship and directly affects the user community benefit dimension (MB) and meets the criteria, as shown in Tables 9, 10, and 11. The outcome has a direct effect on the benefits of the user community (MB) of 0.963. In addition, the outcome also reflects two latent variables that have an indirect effect. The two latent variables are the time of community activity at night (MB1) of 0.652 and an increase in employment (MB5) of 0.602. With the outcome that is entirely accepted by the user community, the community's costs in the form of monthly contributions are in proportion to the benefits they receive, increasing time for community activities, working, and learning they can increase knowledge. Likewise, the addition of employment opportunities in the village causes community employment opportunities to increase and reduce the village's unemployment rate. It can also increase the community's creativity, significantly increasing the home industry by utilizing local resources in a remote area [22].
The outcome variable has a direct and indirect effect of 0.906 on financial benefits (MF) and 0.545 towards the partnership profit manifest (MF2). It also has a 0.58 and 0.493 effect towards increasing the user income (MF3) and savings in using generator fuel (MF4), respectively. With the outcome received by the user community, the manager's income rises along with the management benefits in the form of finance. The user community's outcomes continuously attract local investors, thereby obtaining the benefits of partnership, which increases users' income and supports community agricultural activities. In addition, it reduces the use of generator fuel, thereby saving costs. Agricultural production that continues to increase, along with the community's outcome, affects increasing the value of land and rice fields [23].
The outcome variable has a direct and indirect effect of 0.833 and 0.628 on rural communities' working capital (MK1) and 0.691 towards welfare (MK3). The outcome received by the user community in the form of working capital based on profit-sharing is the benefits result from resource management [24], which helps to improve the welfare of the rural community.
4.2.3 The effect of hybrid resources to outcome
Based on Table 11, it can be seen that the exogenous hybrid source variable has a direct effect of 0.213 on the endogenous outcome variable. This means that other variables dominate the endogenous variables for the user community of 0.787. Therefore, another exogenous variable is needed, which can be indirectly correlated with the hybrid resource variable affecting the endogenous outcome variable.
According to Naim et al. [11], the CFA method used to test the CPR-based model is the best model applied can to the concept of developing micro-hydro resources as a hybrid resource. Unlike the previous method [23], especially in remote areas with limited river flow, the ability to test the model is not directly measured. This method also involves all theoretical variables, but not all manifest variables are used. In making the estimation model, some insignificant manifest variables are eliminated in the planning concept of developing micro-hydro resources as a mixture of water and solar resources in remote areas with limited river discharge.
In this study, the CFA Full Model was developed into a Full Fit Model using the AMOS program with the essential conclusions obtained as follows:
The head of the Department of Energy and Mineral Resources of Southeast Sulawesi province has established and provided accurate data. Likewise, Micro-hydro resource manager and Ambapa Village Chief provide full participation and support for the implementation of research data collection in the form of questionnaires and Focus Group Discussions.
|
CFA |
confirmatory factor analysis |
|
CPR |
common pool resources |
|
CR |
critics ratio |
|
SLF |
standard loading factor |
|
NGOs |
non-governmental organizations |
|
SPSS |
statistical package for social sciences |
|
OM |
outler model |
|
IM |
inner model |
|
AMOS |
analysis moment of structural |
|
SEM |
structural equation modeling |
|
DF |
degree freedom |
|
GFI |
goodness of fit index |
|
AGFI |
adjusted goodness of index |
|
CFI |
comparative fit index |
|
TLI |
tucker-Lewis index |
|
RMSEA |
root mean square error of approximation |
|
P |
Probability |
|
H |
Hypotheses |
[1] Ostrom, E., Dietz, T., Dolšak, N., Stern, P.C., Stonich, S., Weber, E. (2002). The Drama of the Commons. Washington, DC: Natl. Acad. https://doi.org/10.17226/10287
[2] Arun Agrawa, A. (2003). Sustainable governance of common-pool resources: Context, methods, and politics. Annual Review of Anthropology, 20(32): 243-262. https://doi.org/10.1146/annurev.anthro.32.061002.093112
[3] Baerlein, T., Kasymov, U., Zikos, D. (2015). Self-governance and sustainable common pool resource management in Kyrgyzstan. Sustainability, MDPI, 7: 496-521. https://doi.org/10.3390/su7010496
[4] Choudhary, M.P., Chauhan, G.S. (2015). Environmental degradation: Causes, impacts and mitigation. National Seminar on Recent Advancements in Protection of Environment and its Management Issues (NSRAPEM-2015). Maharishi Arvind College of Engineering and Technology, Kota, Rajasthan, India.
[5] Li, T.M. (1996). Images of community: Discourse and strategy in property relations. Dev. Change, 27(3): 501-527.
[6] Fulzele, J.B., Dutt, S. (2012). Optimum planning of hybrid renewable energy system using HOMER. International Journal Computer of Electrical and Computer Engineering, 2(1): 68-74. https://doi.org/10.11591/ijece,v2i1.157
[7] Lal, D.K., Dash, B.B., Akella, A.K. (2011). Optimization of PV/wind/micro-hydro/diesel hybrid power system in HOMER for the study area. International Journal on Electrical Engineering and Informatics, 3(3): 307-325. https://doi.org/10.15676/ijeei.2011.3.3.4
[8] Saraswat, R., Suhag, S. (2017). Optimum scheduling of isolated hybrid renewable energy system - A case study using HOMER. Journal of Environmental & Analytical Toxicology, 7(6): 1-10. https://doi.org/10.4172/2161-0525.1000520
[9] Chadijah. (2011). Governing the spectrum commons: A Framework for rules based on principles of common pool resources management. Cyberlaw. Stanford.edu.
[10] Nasir, B.A. (2014). Design consideration of micro-hydro-electric power plant. The International Conference on Technologies and Materials for Renewable Energy, Environment, and Sustainability, TMREES14. Energy Procedia, 50: 19-29. https://doi.org/10.1016/j.egypro.2014.06.003
[11] Naim, M.Y., Pramoedyo, H., Harahab, N., Nodjeng, S. (2020). Micro-hydro resources development as hybrid renewable energy system in the Ambapa Village. Proceedings of the 13th IISS, Malang, Indonesia. http://dx.doi.org/10.4108/eai.23-10-2019.2293029
[12] Haryono, S. (2017). SEM method for management research in AMOS LISREL (In Indonesia), PLS. Luxima Metro Media Jakarta Publisher.
[13] Ostrom, E. (2002). Common-pool resources and institutions: Toward a revised theory. Handbook of Agricultural Economics, 2(2): 1315-1339. https://doi.org/10.1016/S1574-0072(02)10006-5
[14] Anonym. (2016). Regulation of the Minister of Energy and Mineral Resources of the Republic of Indonesia (PERMEN) No. 28. Concerning Electricity Tariffs Provided by PT. State Electricity Company (PLN), ESDM RI.
[15] Kunneke, R., Finger, M. (2009). The Governance of Infrastructures as Common Pool Resources. Delf University of Technology, Netherlands.
[16] Sayuti, N. (2012). Implementation of Common Pool Resources Framework in the Management of Micro Hydro Power Plant (in Indonesia). Thesis. Faculty of Economics, Magister Program of Planning and Public Policy.
[17] Polsky, M.M., Ostrom, E. (1999). An institutional framework for policy analysis and design. Political Science. Indiana University, 13-47.
[18] Koontz, T.M. (2013). An introduction to the institutional analysis and development (IAD) framework for forest management research. The Ohio State University School of Natural Resources.
[19] Andersson, K.P. (2006). Understanding decentralized forest governance: An application of the institutional analysis and development framework. Sustainability: Sicience, Practice, and Police, 2(1): 25-35. https://doi.org/10.1080/15487733.2006.11907975
[20] Ghozali, I. (2008). Structural Equation Models, Concepts and Applications with the AMOS Program (in Indonesia). Textbook. Diponegoro University Publisher.
[21] Kanata, S. (2015). Economic study of hybrid renewable energy generation towards energy independent village in Bone-Bolango Regency (in Indonesia). Jurnal Rekayasa Elektrikal, 11(3): 114-122. https://doi.org/10.17529/jre.v11i2.2288
[22] Cox, M., Arnold, G., Tomás, S.V. (2010). A review of design principles for community-based natural resources management. Journal of Ecology and Society, 15(4): 1-18. https://doi.org/10.5751/ES-03704-150438
[23] Christopher, G.E. (2004). The marginalization of “small is beautiful”: Micro-hydroelectricity, common property, and politics of rural electricity provision in Thailand. Dissertation and Theses. University of California. Barkeley. Publication Number: AAI3183808; ISBN: 9780542252389.
[24] Hess, C., Ostrom, E. (2005). A Framework for Analyzing the Knowledge Commons: A Chapter from Understanding Knowledge as a Commons: From Theory to Practice. Dissertations and Theses. Syracure University.