Yongzhi Chang | Quan Zhang*
© 2020 IIETA. This article is published by IIETA and is licensed under the CC BY 4.0 license (http://creativecommons.org/licenses/by/4.0/).
OPEN ACCESS
In order to fully promote the industrial coordination development in Beijing, Tianjin and Hebei Province and form a development structure with rational spatial patterns and optimized allocation of various industries, this study uses the market potential model based on the new economic geography to, quantitatively analyse the market potential and spatial pattern of Beijing, Tianjin and various cities in Hebei Province from 2012 to 2019, obtains the dominant industries of Beijing, Tianjin and Hebei Province. Then, the study adopts the industrial location quotient model to perform empirical study on the industrial conditions of Beijing, Tianjin and Hebei Province and explore the location and routing problem of industrial transfer for Beijing from the perspectives of possibility and feasibility by taking into account the development objectives and positioning of the urban agglomeration in Beijing, Tianjin and Hebei Province. The following conclusions are obtained: 1) The spatial pattern of the regional market potential of Beijing, Tianjin and Hebei Province centres on Beijing and Tianjin, and the market potential gradually decreases from inside to outside. There are three tiers: Beijing and Tianjin have the greatest market potentials; followed by Langfang, Tangshan, Baoding, Cangzhou and Shijiazhuang, and Qinhuangdao, Handan, Xingtai, Hengshui, Chengde and Zhangjiakou have the lowest market potentials. 2) The market shares of Langfang, Tangshan, Baoding, Cangzhou, Chengde and Zhangjiakou are mainly from Beijing and Tianjin and have the closest connections with these two cities. 3) The market potential gaps between Hebei and Beijing and Tianjin are on an increasing trend. Therefore, to achieve coordinated development in Beijing, Tianjin and Hebei Province, Beijing and Tianjin must give full play to their radiating and driving roles and selectively shift some of the industries to Hebei Province.
coordinated development, spatial pattern, market potential model, location quotient, industrial transfer
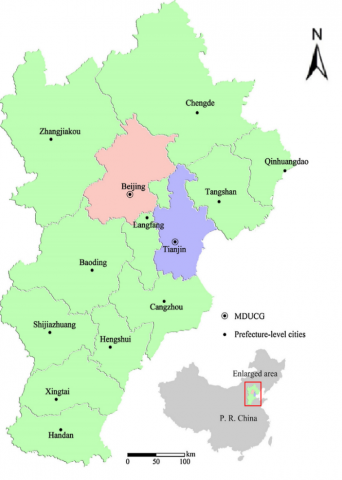
Promoting the coordinated development of Beijing, Tianjin and Hebei Province is a major strategic decision made by the Party Central Committee and the State Council under the new historical conditions [1-3]. In December 2014, the coordinated development of Beijing, Tianjin and Hebei Province was clearly determined as one of the three national key spatial strategies. On April 30, 2015, the CPC Central Committee adopted the Planning Outline for Coordinated Development of Beijing, Tianjin and Hebei Province, which proposed dispelling Beijing’s non-capital functions and optimizing its core functions as the Capital, and at the same time strengthening the integration of Beijing and Tianjin and enhancing the urban functions of regional centres such as Shijiazhuang, Baoding, Tangshan, Qinhuangdao and Cangzhou, so as to build a world-class urban agglomeration with the Capital as the core and with good ecological environment, developed economy and culture, and stable and harmonious society [3]. The region of Beijing, Tianjin and Hebei Province (see Figure 1 [1]) is the political, economic, and cultural centre of China and also the third economic growth pole in China following the Yangtze River Delta and the Pearl River Delta. However, compared with the former two powerhouses, this region still has the following prominent problems: firstly, the overall regional economy is not strong enough-the per capita GDP and per capita disposable income of this region are far less than those of the Yangtze River Delta and Pearl River Delta; secondly, the internal development of the region is unbalanced - Hebei is far left behind Beijing and Tianjin in per capita GDP, per capita disposable income as well as industrial distribution and Beijing and Tianjin have not given full play to their radiation roles as the central cities [4]. One of the important reasons for the backwardness of the Beijing, Tianjin and Hebei region is its irrational spatial structure-the core cities are excessively concentrated [5-9]. So in the face of such prominent issues and new requirements, the key is to figure out how to better promote the optimization of the spatial structure of Beijing, Tianjin and Hebei Province through industrial transfer [10-12].
Regional spatial structure is the spatial mapping of the economic development relations between areas, and also directly affects the level and efficiency of regional economic development [13]. The studies on the optimization of regional spatial structure began in the 1920s and 1930s, which mainly focused on exploring the process and pattern of spatial agglomeration and diffusion during urban development, the conditions and patterns of interactions between urban areas, and the general laws about the expansion and formation of city scales and their spatial distribution, from the perspective of regional development [14]. In other countries, the basic theories on spatial structure are quite mature, mainly including the Central Place Theory [15, 16], Growth Pole Theory [17], Spatial Interaction Theory [18], Spatial Diffusion Theory [19, 20], Point Axis Development Theory [21], etc., especially the latest new economic geography, which gives a new perspective on the study of regional spatial patterns [22-25].
Figure 1. The location and regions of Beijing, Tianjin and Hebei urban agglomeration
Industrial transfer refers to the phenomenon or process where some industries in a country or region are transferred to another country or region. Research on industrial transfer has accumulated fruitful results and basically formed three paths - comparative advantage, new economic geography and foreign investment, which have laid the theoretical foundation for industrial transfer. In China, with the acceleration of regional economic integration, industrial transfer has become the normal in regional economic activities, which, objectively, is helpful to the transformation and upgrading of industrial structure and the optimal allocation of elements in space, thereby promoting regional coordinated development. From the perspective of geographical space, domestic research mainly focused on the industrial transfer between the three major regions or the four major blocks, provinces and cities within one province, and actively explored the nature of inter-regional industrial transfer.
Industrial transfer mainly refers to the movements of economic activities in space, which have various influences on the regional spatial structure. Domestic research has not worked much on the relations between industrial transfer and spatial structure optimization. Based on the current requirements for regional development in China, some scholars investigated the relations between industrial transfer and spatial layout of regional economy, and put forward various proposals on how to optimize the spatial layout through industrial transfer. Feng et al. [26] applied the gradient transfer theory and proposed that industrial transfer should be used as an important form of promoting regional coordinated development. Yu and Shang [27] believed that regional industrial transfer is of great significance to the coordinated development of the regional economy and the optimization of the regional economic structure. Xiong et al. [28], under the context of resources and environment integration, analyzed the regional development characteristics of Beijing, Tianjin and Hebei Province and then based on these, proposed promoting regional coordinated development through industrial linkages so as to lay a solid foundation for the sustainable development of the Beijing, Tianjin and Hebei Province region. Li and Lin [29] constructed a theoretical model for the interactions between industrial structure optimization and industrial transfer with the flow of factors. Gaspar [30], based on the framework of the new economic geography model, systematically analyzed the influence mechanisms of labour mobility and industrial transfer on urban output and urban system evolution.
Based on the new economic geography theory, there are a lot of researches on the regional economic gap in China. Most of these researches empirically test the derivative form of the market potential model and believe that the market potential gap is an important reason for the regional economic gap. According to the theory of new economic geography, the connection between economic activity and economy decreases with the increase of distance. First of all, close economies form a close space demand relationship, resulting in scale effect; Secondly, transportation cost is the form of distance's influence on economic activities. It is difficult to understand the reasons for regional economic gap if the study ignores economic geographical factors. This research on the basis of learning and reference to related literature by the model of market potential and new economic geography, Krugman wage equation to calculate comprehensive market potential of the Beijing-Tianjin-Hebei region and each industry market potential index, analysis of Beijing-Tianjin-Hebei spatial distribution pattern, using the location quotient model, draw around the leading advantage industry, analyses the feasibility of the industry transfer and industry shift focus in theory, so as to realize industrial spatial structure optimization. In order to provide theoretical reference for the optimization of industrial layout and spatial structure of Beijing, Tianjin and Hebei Province.
2.1 Market potential model
For a long time, the influence of geographical location and distance between regions on regional economy has been concerned by the government and scholars. The neoclassical economic theory model takes geographical factors as exogenous variables, and takes resource endowment and technology as endogenous variables to study economic differences and agglomeration. The new economic geography theory regards geographical factors as endogenous variables and assumes that there is transportation cost. Based on this assumption, the model established explains the wage gap between the central and marginal areas, and proves that the higher the market potential, the higher the regional wage.
Based on the idea that transportation cost is a kind of trade barrier, Harris [31] proposed the market potential model for the first time. The market potential model defines a region's market potential as the purchasing power of its neighboring regions weighted by transportation cost, and explains the impact of transportation cost on regional wages. Krugman's wage equation, based on a more solid micro basis, fully describes the mechanism of transport cost on the spatial economic structure and deepens the concept of market potential [32].
Harris used the market potential index to measure market accessibility. The formula is expressed as:
${{M}_{j}}=\sum\limits_{k}{{{Y}_{k}}g({{D}_{jk}}})$ (1)
where: Mj is the market potential of area j; Yk is the purchasing power of area k; Djk is the distance from area j to area k; and g(Djk) is the attenuation function of the distance. In Harris’ market potential model, the market potential is directly proportional to the purchasing power of each market, namely the market scale, and inversely proportional to the distance from the place to the market.
In 1991, Krugman proposed the “core-periphery” model [32], and gave a similar market potential model at wage level:
${{W}_{j}}={{\sum\limits_{k}{\left[ {{Y}_{k}}{{\left( {{T}_{k}}{{e}^{-\tau {{D}_{jk}}}} \right)}^{\sigma -1}} \right]}}^{{1}/{\sigma }\;}}$ (2)
where: Wj is the wage of area j; Yk is the purchasing power for area k; Tk is the transportation cost coefficient from FOB price (ex-factory price) to the CIF price (delivery price); Djk is the distance between the two areas j and k, t is the transportation cost, s is the constant substitution elasticity of the product.
In 2000, based on the new economic geography, Fujita derived a new market potential index expression [24], which is also a commonly used market potential model now:
$\Omega \left( j \right)=\sum\limits_{h=1}^{l}{\left[ \frac{\alpha {{E}_{h}}{{T}_{X}}{{\left( j,h \right)}^{-\left( \mu +1 \right)}}}{\sum\limits_{k=1}^{l}{{{n}_{k}}{{\left\{ {{W}_{k}}^{1-\beta }\Gamma {{\left( k \right)}^{\beta }}{{T}_{x}}\left( k,h \right) \right\}}^{-\mu }}}} \right]}$ (3)
where: W(j) is the market potential of area j; a is the market share; Eh is the purchasing power of the area h; TX(j,h) is the transportation cost coefficient from the FOB price (ex-factory price) to the CIF price (delivery price); nk is the number of product categories in area k; Wk is the wage of area k; G(k) is the intermediate product price index of area k; and $\beta$ and $\mu$ are substitution elasticity of the product. The numerator of the model is Harris’ market potential model and the denominator involves the spatial competition factor. Area h provides market for enterprises not only in area j, but also in other areas, so the denominator represents the spatial competition among all those enterprises for the market of area h.
2.2 Location quotient model
Location quotient (LQ) was, proposed by Gould and Haggett, was used to analyze the dominant industries in the region [33]. It is also known as the specialization rate. LQ is an important indicator of the regional dominant industries and industrial competitiveness. It is the ratio between the proportion of output value of an industry in the region and that of the industry in the country, used to analyse the degree of concentration and specialization of an industry within a region. The LQ formula is shown in (4):
$L{{Q}_{ij}}=\frac{{{L}_{ij}}/\sum\limits_{j=1}^{m}{{{L}_{ij}}}}{\sum\limits_{i=1}^{n}{{{L}_{ij}}/\sum\limits_{i=1}^{n}{\sum\limits_{j=1}^{m}{{{L}_{ij}}}}}}$ (4)
where, i is the i-th area; j is the j-th industry; Lij is the output index of the j-th industry in the i-th area; LQij is the LQ of the j-th industry in the i-th area.
When LQij>1, it indicates that the industry has a higher degree of specialization in this area than the national level, implying that the industry is relatively concentrated in this area, with comparative advantages like scale effect and rapid development. The greater the LQij value is, the more highly the industry is specialized in this area and the greater comparative advantage it has.
When LQij<1, it indicates that the industry has a lower degree of specialization in this area than the national level, with weak scale effect. This means that the local needs cannot be satisfied with the output of the industry in this area and also require the supply of products or services from outside the area.
When LQij=1, it indicates that the specialization degree in this area is comparable to the national level, and that the supply capacity can exactly meet local needs.
3.1 Data sources
The data used in this study are from Beijing Economic Statistics Yearbook, Tianjin Economic Statistics Yearbook and Hebei Economic Statistics Yearbook during 2012-2018. By reference to literature [24], this study selects the appropriate substitute variables: the substitute variable for market purchasing power is the retail sales of consumer goods; that for land price is the average selling price of commercial housing; that for the number of product categories is the number of industrial enterprises above the designated size; and that for labour cost and wage is the average employee wage. The transportation factor is represented in the exponential form: $T=e^{\tau D_{j k}}$ , where t is the unit freight; calculated at an average price of 0.095 RMB·t-1·km; Djk is the distance from area j to area k, which is the time distance between the two cities, calculated as the arithmetic mean of the time distances respectively through highway, ordinary railway and high-speed train (results are shown in Table 1 [34]); the substitution elasticity is m=3.5, b=0.3; the share of consumer spending $\alpha$ is determined by the attenuation function of transport flow with the spatial distance: $\alpha=5 * e^{-0.002 * D_{j k}}$.
Table 1. Time distance between every city in Beijing, Tianjin and Hebei Province (unit: hour)
|
City |
BJ |
TJ |
TS |
SJZ |
LF |
BD |
HD |
CZ |
XT |
QHD |
ZJK |
HS |
CD |
|
BJ |
0.00 |
1.21 |
1.55 |
2.41 |
0.69 |
1.34 |
3.49 |
1.81 |
3.24 |
2.68 |
2.89 |
3.00 |
3.55 |
|
TJ |
1.21 |
0.00 |
1.05 |
3.91 |
0.66 |
2.44 |
5.56 |
0.87 |
5.11 |
2.28 |
4.61 |
3.08 |
4.51 |
|
TS |
1.55 |
1.05 |
0.00 |
5.08 |
2.26 |
3.69 |
5.19 |
2.17 |
6.39 |
1.37 |
4.88 |
4.40 |
2.65 |
|
SJZ |
2.41 |
3.91 |
5.08 |
0.00 |
3.91 |
1.18 |
1.26 |
3.26 |
0.91 |
6.30 |
5.74 |
1.63 |
7.56 |
|
LF |
0.69 |
0.66 |
2.26 |
3.91 |
0.00 |
1.35 |
5.51 |
1.37 |
4.97 |
4.01 |
3.98 |
3.61 |
5.34 |
|
BD |
1.34 |
2.44 |
3.69 |
1.18 |
1,35 |
0.00 |
2.32 |
3.28 |
2.01 |
4.86 |
4.23 |
2.42 |
6.33 |
|
HD |
3.49 |
5.56 |
5.19 |
1.26 |
5.51 |
2.32 |
0.00 |
5.38 |
0.52 |
8.56 |
7.53 |
3.38 |
9.27 |
|
CZ |
1.81 |
0.87 |
2.17 |
3.26 |
1.37 |
3.28 |
5.38 |
0.00 |
3.97 |
4.78 |
6.27 |
2.14 |
5.82 |
|
XT |
3.24 |
5.11 |
6.39 |
0.91 |
4.97 |
2.01 |
0.52 |
3.97 |
0.00 |
8.49 |
7.12 |
2.74 |
8.82 |
|
QHD |
2.68 |
2.28 |
1.37 |
6.30 |
4.01 |
4.86 |
8.56 |
4.78 |
8.49 |
0.00 |
6.13 |
6.31 |
4.12 |
|
ZJK |
2.89 |
4.61 |
4.88 |
5.74 |
3.98 |
4.23 |
7.53 |
6.27 |
7.12 |
6.13 |
0.00 |
5.87 |
6.16 |
|
HS |
3.00 |
3.08 |
4.40 |
1.63 |
3.61 |
2.42 |
3.38 |
2.14 |
2.74 |
6.31 |
5.87 |
0.00 |
7.62 |
|
CD |
3.55 |
4.51 |
2.65 |
7.56 |
5.34 |
6.33 |
9.27 |
5.82 |
8.82 |
4.12 |
6.16 |
7.62 |
0.00 |
Note: The cities of Beijing, Tianjin and Hebei Province are abbreviated as follows: Beijing (BJ), Tianjin (TJ), Shijiazhuang (SJZ), Langfang (LF), Tangshan (TS), Baoding (BD), Cangzhou (CZ), Qinhuangdao (QHD), Handan (HD), Xingtai (XT), Hengshui (HS), Chengde (CD) and Zhangjiakou (ZJK).
3.2 Analysis of the spatial pattern of comprehensive market potential
Substitute the data during 2012-2019 into the above market potential model (3), and we obtain the market potential indices of the cities in Beijing, Tianjin and Hebei (Table 2). In order to analyse the factors affecting the market potential of each city, based on the data in 2019, the market potential contribution rate of each city is calculated (Table 3).
From the data in Table 2, it can be seen that the spatial pattern of the regional market potential of Beijing, Tianjin and Hebei Province centres on Beijing and Tianjin, and the market potential gradually decreases from inside to outside. The cities can be grouped into 3 tiers.
First tier: Beijing and Tianjin have the highest market potentials - the market potential index ranges between 60 and 70. Beijing and Tianjin are the economically advanced regions not only in the region, but also in the whole China. The advanced technologies, excellent talents, abundant capital, strong industrial competition and convenient transportation in Beijing and Tianjin determine their absolute dominant positions in market potential in this region. In the future, it is necessary to further strengthen their advantageous industries and play their leading roles to drive regional economic development.
Table 2. Market potential index of Beijing, Tianjin and Hebei Province during 2012-2019
|
Year |
2012 |
2013 |
2014 |
2015 |
2016 |
2017 |
2018 |
2019 |
|
BJ |
20.75 |
27.01 |
46.60 |
53.55 |
58.37 |
61.19 |
69.02 |
71.03 |
|
TJ |
12.85 |
17.96 |
31.27 |
38.35 |
42.46 |
49.57 |
57.68 |
62.15 |
|
TS |
8.33 |
11.75 |
20.98 |
29.58 |
36.80 |
40.03 |
49.25 |
57.66 |
|
SJZ |
5.88 |
7.79 |
13.16 |
16.46 |
20.08 |
25.54 |
30.08 |
34.25 |
|
LF |
11.93 |
16.75 |
30.02 |
35.92 |
40.84 |
45.79 |
49.83 |
53.38 |
|
BD |
6.79 |
9.23 |
15.91 |
20.18 |
25.46 |
29.92 |
37.38 |
43.25 |
|
HD |
4.56 |
5.98 |
9.90 |
11.39 |
13.96 |
16.54 |
19.11 |
21.54 |
|
CZ |
6.17 |
8.49 |
14.78 |
19.62 |
23.80 |
28.97 |
34.15 |
40.02 |
|
XT |
4.41 |
5.76 |
9.61 |
9.84 |
11.88 |
13.94 |
15.98 |
16.87 |
|
QHD |
4.13 |
5.73 |
10.25 |
12.08 |
15.05 |
18.01 |
20.97 |
22.04 |
|
ZJK |
3.80 |
5.19 |
8.87 |
15.47 |
19.01 |
22.55 |
26.09 |
30.41 |
|
HS |
3.92 |
5.51 |
9.23 |
10.77 |
13.33 |
15.88 |
18.44 |
20.16 |
|
CD |
3.47 |
4.81 |
8.35 |
9.67 |
12.01 |
14.35 |
16.69 |
18.24 |
Table 3. Market potential contribution rate of Beijing, Tianjin and Hebei Province in 2019 %
|
City |
BJ |
TJ |
TS |
SJZ |
LF |
BD |
HD |
CZ |
XT |
QHD |
ZJK |
HS |
CD |
|
BJ |
78.25 |
8.15 |
2.64 |
1.76 |
3.12 |
1.84 |
0.22 |
0.83 |
0.19 |
0.62 |
1.24 |
0.35 |
0.79 |
|
TJ |
32.34 |
43.38 |
10.12 |
0.69 |
3.18 |
2.34 |
0.43 |
3.52 |
0.61 |
1.54 |
0.48 |
0.72 |
0.65 |
|
TS |
30.21 |
22.12 |
33.54 |
1.34 |
1.79 |
1.63 |
0.19 |
0.67 |
0.13 |
4.78 |
0.82 |
0.36 |
2.42 |
|
SJZ |
16.13 |
5.18 |
0.65 |
53.38 |
2.01 |
6.58 |
7.1 |
2.04 |
4.01 |
0.16 |
0.43 |
0.13 |
2.20 |
|
LF |
64.12 |
19.11 |
2.43 |
0.91 |
8.15 |
3.26 |
0.04 |
1.91 |
0.03 |
0.06 |
0.04 |
0.02 |
0.16 |
|
BD |
40.35 |
15.33 |
1.94 |
9.82 |
1.83 |
21.59 |
2.08 |
3.96 |
1.86 |
0.36 |
0.39 |
0.14 |
0.35 |
|
HD |
5.31 |
2.49 |
0.40 |
21.44 |
0.39 |
2.49 |
43.84 |
1.04 |
19.21 |
0.12 |
0.24 |
2.95 |
0.08 |
|
CZ |
27.58 |
31.94 |
4.11 |
5.21 |
4.36 |
5.66 |
1.46 |
13.97 |
0.91 |
0.84 |
0.36 |
3.25 |
0.35 |
|
XT |
7.21 |
3.16 |
0.48 |
22.82 |
0.41 |
3.01 |
24.02 |
0.14 |
35.04 |
0.16 |
0.34 |
3.1 |
0.11 |
|
QHD |
21.03 |
12.49 |
14.66 |
0.36 |
1.46 |
0.76 |
0.07 |
0.91 |
0.06 |
46.38 |
0.31 |
0.12 |
1.39 |
|
ZJK |
44.18 |
5.82 |
2.04 |
0.85 |
1.57 |
1.36 |
0.21 |
0.55 |
0.19 |
0.29 |
42.01 |
0.71 |
0.22 |
|
HS |
29.10 |
13.01 |
0.19 |
16.82 |
2.99 |
8.22 |
6.45 |
7.11 |
4.29 |
0.32 |
0.36 |
10.93 |
0.31 |
|
CD |
38.12 |
8.68 |
12.05 |
0.61 |
1.62 |
2.01 |
0.09 |
2.66 |
0.08 |
2.34 |
0.97 |
0.21 |
30.56 |
Third tier: For Qinhuangdao, Handan, Xingtai, Hengshui, which are far away from Beijing and Tianjin, and Chengde and Zhangjiakou, which have inconvenient transportation, the relative values of their market potential indices are below 30. The local market shares of Handan and Xingtai are 43.84% and 35.04%, respectively, which indicates that Handan and Xingtai have certain economic foundations and market scales, but being far away from Beijing and Tianjin, they receive less radiation from Beijing and Tianjin – the market shares of Beijing and Tianjin are only 7.61% and 10.37%. On the other hand, Handan, Xingtai, and Hengshui are closer to Shijiazhuang, the capital city of Hebei, so they have stronger economic ties with this city, with Shijiazhuang taking up 21.44%, 22.82%, and 16.82% of the market, respectively. Therefore, the industrial development of Handan, Xingtai and Hengshui should rely on the radiation and driving effects from the market of Shijiazhuang. Chengde and Zhangjiakou are the ecological barriers of Beijing, which restricts the development of the industries there. As a result, the economic foundations in these two cities are weak and their market sizes are small. However, the two cities have obvious geographical advantages - Beijing’s market contributions are 38.12% and 44.18%, respectively. The next step should be to increase the construction of transportation infrastructures, improve the current traffic congestion, and focus on undertaking the environmental protection industry transferred from Beijing.
3.3 Analysis of the development trend of comprehensive market potential
According to the data analysis in Table 4 and Table 5, during 2012-2019, the overall market potential index of the Beijing, Tianjin and Hebei region was increasing, but the differences between the potential indices of the cities in Hebei and the market potential indices of Beijing and Tianjin were continuously enlarging. The differences ranged between 15-23 in 2013; between 17-44 in 2015, between 15-44 in 2017 and between 18~54 in 2019. This is because the market potential was self-reinforcing. Therefore, the economic differences between Beijing, Tianjin and cities in Hebei may be further widening.
Table 4. Market potential difference between the cities of Hebei province and Beijing during 2012-2018
|
Year |
2012 |
2013 |
2014 |
2015 |
2016 |
2017 |
2018 |
2019 |
|
TS |
12.42 |
15.26 |
25.62 |
23.97 |
21.57 |
21.16 |
19.77 |
18.68 |
|
SJZ |
14.87 |
19.22 |
33.44 |
37.09 |
38.29 |
35.65 |
38.94 |
39.41 |
|
LF |
8.82 |
10.26 |
16.58 |
17.63 |
17.53 |
15.40 |
17.29 |
18.15 |
|
BD |
13.96 |
17.78 |
30.69 |
33.37 |
32.91 |
31.27 |
31.64 |
34.52 |
|
HD |
16.19 |
21.03 |
36.70 |
42.16 |
44.41 |
44.65 |
49.91 |
52.13 |
|
CZ |
14.58 |
18.52 |
31.82 |
33.93 |
34.57 |
32.22 |
34.87 |
35.01 |
|
XT |
16.34 |
21.25 |
36.99 |
43.71 |
46.49 |
47.25 |
53.04 |
51.23 |
|
QHD |
16.62 |
21.28 |
36.35 |
41.47 |
43.32 |
43.18 |
48.05 |
49.26 |
|
ZJK |
16.95 |
21.82 |
37.73 |
38.08 |
39.36 |
38.64 |
42.93 |
44.16 |
|
HS |
16.83 |
21.50 |
37.37 |
42.78 |
45.04 |
45.31 |
50.58 |
49.12 |
|
CD |
17.28 |
22.20 |
38.25 |
43.88 |
46.36 |
46.84 |
52.33 |
53.14 |
Table 5. Market potential difference between the cities of Hebei province and Tianjin during 2012-2018
|
Year |
2012 |
2013 |
2014 |
2015 |
2016 |
2017 |
2018 |
2019 |
|
TS |
4.52 |
6.21 |
10.29 |
8.77 |
5.66 |
9.54 |
37.91 |
39.21 |
|
SJZ |
6.97 |
10.17 |
18.11 |
21.89 |
22.38 |
24.03 |
18.74 |
17.52 |
|
LF |
0.92 |
1.21 |
1.25 |
2.43 |
1.62 |
3.78 |
40.39 |
43.25 |
|
BD |
6.06 |
8.73 |
15.36 |
18.17 |
17.00 |
19.65 |
26.04 |
28.41 |
|
HD |
8.29 |
11.98 |
21.37 |
26.96 |
28.50 |
33.03 |
7.77 |
14.12 |
|
CZ |
6.68 |
9.47 |
16.49 |
18.73 |
18.66 |
20.60 |
22.81 |
24.25 |
|
XT |
8.44 |
12.20 |
21.66 |
28.51 |
30.58 |
35.63 |
4.64 |
8.25 |
|
QHD |
8.72 |
12.23 |
21.02 |
26.27 |
27.41 |
31.56 |
9.63 |
10.24 |
|
ZJK |
9.05 |
12.77 |
22.40 |
22.88 |
23.45 |
27.02 |
14.75 |
10.35 |
|
HS |
8.93 |
12.45 |
22.04 |
27.58 |
29.13 |
33.69 |
7.10 |
9.25 |
|
CD |
9.38 |
13.15 |
22.92 |
28.68 |
30.45 |
35.22 |
5.35 |
6.85 |
Through the above analysis on the comprehensive market potentials of Beijing, Tianjin and various cities in Hebei Province, it is found that, there are great gaps in market potential between Hebei and Beijing and Tianjin, and that these gaps will keep enlarging in future development. Therefore, to achieve coordinated development in the Beijing, Tianjin and Hebei region, Beijing and Tianjin must fully exert their radiation and driving effects on cities in Hebei such as Langfang, Tangshan, Baoding, Cangzhou, Chengde and Zhangjiakou, and selectively transfer some industries from Beijing and Tianjin to Hebei. However, which industries to be transferred from Beijing and to which cities in Hebei should be determined through further studies of the industrial division among these cities (finding out the dominant and advantageous industries of these cities). The following sections will work on this, with a view to providing data support for the rational industrial division in the Beijing, Tianjin and Hebei region and giving feasible suggestions for optimizing the regional spatial pattern.
4.1 LQ calculation of the Beijing, Tianjin and Hebei region
The regional economy cannot achieve coordinated development without the selection and determination of the dominant industries. A dominant industry refers to an industry that plays a crucial and guiding role in the future industrial development and has more advanced technologies and broader prospects compared with other industrial sectors. With its advanced technologies and its strong associations with other industries, a dominant industry can drive the development of other industries while promoting its own development. It has a strong leading effect [35-37]. With the changes in economic development and policy environment, dominant industries will also be adjusted accordingly. In order to find out the dominant and advantageous industries in Beijing, Tianjin and Hebei Province, the LQ index is used in calculations.
Based on the output data of the three industries in various cities and the whole China during the previous years provided in the statistical yearbooks of Beijing, Tianjin and Hebei Province and the China Statistical Yearbook during 2012-2019, this research calculates the LQs of the three industries, as shown in Table 6. The dominant and advantageous industries are very different in Beijing, Tianjin and Hebei Province. In Beijing, the LQ of the tertiary industry is up to 1.7, demonstrating that it is the most specialized in the tertiary industry. So the tertiary industry is a dominant industry in Beijing, with a high degree of specialization, and it is far better than those in Tianjin and Hebei. Tianjin has advantages in both the secondary and the tertiary industries. In terms of LQ, LQ value of the secondary industry and is more than 1 in Tianjin, it shows the secondary industry in Tianjin has a higher LQ than those in Beijing and Hebei, and is the most specialized and competitive in the three regions. Hebei Province has advantages in the primary and the secondary industries, but it is left behind in the tertiary industry. In this industry, it does not have regional competitiveness.
4.2 Analysis of the industries in Beijing, Tianjin and Hebei Province
In order to clearly find out the dominant industries in Beijing, Tianjin and Hebei Province, this research calculates the LQs of 40 industry segments based on the data provided in the 2019 statistical yearbooks of Beijing, Tianjin and Hebei Province as well as China Statistical Yearbook. The calculation results are shown in the Table 7.
According to the calculation results, there are 12, 16 and 12 dominant industries respectively in Beijing, Tianjin and Hebei Province. Details are shown in Table 8. The dominant industries in Beijing are technology-intensive industries like transportation, electronics, medicines, automobiles as well as heat power, electric power, gas, and water supplies that the municipal services and other public services are comprehensive industries. The dominant industries in Tianjin involve both technology-intensive industries and traditional manufacturing industries. Hebei concentrates on resource-intensive and labour-intensive traditional manufacturing industries like metal smelting, manufacture of foods and manufacture of textile. There are certain overlaps between the dominant industries in these three places (see Table 9). There is 1 industry overlapping among all three regions, 6 industries overlapping between Beijing and Tianjin, 1 industry between Beijing and Hebei Province and 5 industries between Tianjin and Hebei. Overall, Beijing and Tianjin have more overlapping dominant industries and most of them are technology-intensive industries such as the modern manufacturing industry. There is little overlap in dominant industries between Beijing and Hebei Province. Under the strategy of promoting the coordinated development of Beijing, Tianjin and Hebei Province, the three regions should further adjust and optimize their industrial structures and improve their industrial division and specialization and reduce their overlaps in dominant industries and regional cut-throat competition through industrial transfer. Hebei needs to take this opportunity to actively undertake the industrial transfer from Beijing and Tianjin, especially the former, so as to promote the industrial coordinated development in the Beijing, Tianjin and Hebei Province.
Table 6. Three industrial LQ in Beijing, Tianjin, Hebei Province during 2012-2019
|
Year |
Hebei |
Beijing |
Tianjin |
||||||
|
The primary industry |
The secondary industry |
The tertiary industry |
The primary industry |
The secondary industry |
The tertiary industry |
The primary industry |
The secondary industry |
The tertiary industry |
|
|
2012 |
1.309 |
1.130 |
0.793 |
0.097 |
0.500 |
0.178 |
0.178 |
0.178 |
1.024 |
|
2013 |
1.326 |
1.128 |
0.790 |
0.093 |
0.509 |
0.169 |
0.169 |
0.169 |
1.041 |
|
2014 |
1.263 |
1.149 |
0.785 |
0.090 |
0.486 |
0.151 |
0.151 |
0.151 |
1.046 |
|
2015 |
1.279 |
1.150 |
0.780 |
0.090 |
0.490 |
0.139 |
0.139 |
0.139 |
1.039 |
|
2016 |
1.281 |
1.151 |
0.776 |
0.089 |
0.494 |
0.139 |
0.139 |
0.139 |
1.029 |
|
2017 |
1.292 |
1.154 |
0.777 |
0.078 |
0.495 |
0.137 |
0.137 |
0.137 |
1.038 |
|
2018 |
1.301 |
1.160 |
0.803 |
0.067 |
0.481 |
0.140 |
0.140 |
0.140 |
1.040 |
|
2019 |
1.298 |
1.174 |
0.854 |
0.061 |
0.475 |
0.162 |
0.136 |
0.138 |
1.082 |
Table 7. Calculation of LQ of industrial sub industry in Beijing, Tianjin, Hebei Province in 2019
|
Number |
Industry |
Hebei |
Beijing |
Tianjin |
|
1 |
Mining and washing of coal |
1.087 |
— |
— |
|
2 |
Petroleum and natural gas extraction |
0.502 |
— |
3.587 |
|
3 |
Mining of ferrous metal ores |
5.892 |
— |
1.924 |
|
4 |
Mining of non-ferrous metal ores |
0.159 |
— |
— |
|
5 |
Mining and processing of non-ferrous metal ores |
0.511 |
— |
0.079 |
|
6 |
Ancillary activities for exploitation |
— |
7.099 |
1.981 |
|
7 |
Processing of food from agricultural products |
0.792 |
0.351 |
0.559 |
|
8 |
Manufacture of foods |
1.133 |
0.819 |
2.341 |
|
9 |
Manufacture of wine, drinks and refined tea |
0.682 |
0.659 |
0.381 |
|
10 |
Manufacture of tobacco |
0.452 |
— |
— |
|
11 |
Manufacture of textile |
1.018 |
0.024 |
0.160 |
|
12 |
Manufacture of textile wearing and apparel |
0.462 |
0.329 |
0.636 |
|
13 |
Manufacture of leather, fur, feather and related products and footwear |
2.194 |
0.039 |
0.209 |
|
14 |
Processing of timber, manufacture of wood, bamboo, rattan, palm, and straw products |
0.468 |
0.069 |
0.060 |
|
15 |
Manufacture of furniture |
0.869 |
0.681 |
0.561 |
|
16 |
Manufacture of paper and paper products |
0.862 |
0.282 |
0.631 |
|
17 |
Printing, reproduction of recording |
1.043 |
0.959 |
0.563 |
|
18 |
Manufacture of articles for culture, education and sport activity |
0.764 |
0.488 |
1.291 |
|
19 |
Processing of petroleum, coking, processing of nuclear fuel |
1.229 |
1.094 |
1.459 |
|
20 |
Manufacture of raw chemical materials and chemical products |
0.791 |
0.241 |
0.632 |
|
21 |
Manufacture of medicines |
0.727 |
1.708 |
0.881 |
|
22 |
Manufacture of chemical fibers |
0.297 |
— |
0.098 |
|
23 |
Manufacture rubber and plastic |
1.049 |
0.191 |
0.740 |
|
24 |
Manufacture of non-metallic mineral products |
0.801 |
0.423 |
0.249 |
|
25 |
Smelting and pressing of ferrous metals |
4.014 |
0.091 |
2.889 |
|
26 |
Smelting and pressing of non-ferrous metals |
0.259 |
0.091 |
0.826 |
|
27 |
Manufacture of metal products |
1.763 |
0.498 |
1.482 |
|
28 |
Manufacture of general purpose machinery |
0.698 |
0.646 |
1.002 |
|
29 |
Manufacture of special purpose machinery |
1.002 |
0.961 |
1.169 |
|
30 |
Manufacture of automobile |
0.752 |
3.519 |
1.261 |
|
31 |
Manufacture of railway, shipbuilding, aerospace and other transportation equipment |
0.649 |
1.187 |
2.246 |
|
32 |
Manufacture of electrical machinery and equipment |
0.704 |
0.698 |
0.629 |
|
33 |
Manufacture of computers, communications and other electronic equipment |
0.136 |
1.419 |
1.123 |
|
34 |
Manufacture of measuring instrument |
0.284 |
1.862 |
0.392 |
|
35 |
Other manufactures |
0.538 |
1.709 |
1.679 |
|
36 |
Utilization of waste resources |
0.543 |
0.101 |
2.006 |
|
37 |
Metal products, machinery and equipment repair |
0.582 |
4.271 |
0.902 |
|
38 |
Production and supply of electric power and heat power |
1.169 |
4.539 |
0.572 |
|
39 |
Production and supply of gas |
0.759 |
4.440 |
0.781 |
|
40 |
Production and supply of water |
0.595 |
2.301 |
1.052 |
Table 8. Distribution of industrial dominant industries in Beijing, Tianjin and Hebei Province
|
Region |
Dominant industries |
|
Beijing |
Ancillary activities for exploitation; processing of petroleum, coking, processing of nuclear fuel; manufacture of medicines; manufacture of automobile; manufacture of railway, shipbuilding, aerospace and other transportation equipment; manufacture of computers, communications and other electronic equipment; manufacture of measuring instrument; other manufactures; metal products, machinery and equipment repair; production and supply of electric power and heat power; production and supply of gas; production and supply of water |
|
Tianjin |
Mining and washing of coal; petroleum and natural gas extraction; mining and processing of ferrous metal ores; ancillary activities for exploitation; manufacture of foods; manufacture of articles for culture, education and sport activity; processing of petroleum, coking, processing of nuclear fuel; smelting and pressing of ferrous metals; manufacture of metal products; manufacture of special purpose machinery; manufacture of automobile; manufacture of railway, shipbuilding, aerospace and other transportation equipment; manufacture of computers, communications and other electronic equipment; other manufactures; utilization of waste resources; production and supply of water |
|
Hebei |
Mining and washing of coal; mining and processing of ferrous metal ores; manufacture of foods; manufacture of textile; manufacture of leather, fur, feather and related products and footwear; printing, reproduction of recording; manufacture of articles for culture, education and sport activity; processing of petroleum, coking, processing of nuclear fuel; manufacture rubber and plastic; smelting and pressing of ferrous metals; manufacture of metal products; production and supply of electric power and heat power |
Table 9. Distribution of overlap the dominant industries among Beijing, Tianjin and Hebei Province
|
Region |
Overlap the dominant industries |
|
Beijing and Tianjin |
Ancillary activities for exploitation; manufacture of railway, shipbuilding, aerospace and other transportation equipment; manufacture of computers, communications and other electronic equipment; other manufactures; production and supply of water |
|
Beijing and Hebei |
Production and supply of electric power and heat power |
|
Tianjin and Hebei |
Mining and washing of coal; mining and processing of ferrous metal ores; manufacture of foods; smelting and pressing of ferrous metals; manufacture of metal products |
|
Beijing, Tianjin and Hebei |
Processing of petroleum, coking, processing of nuclear fuel |
4.3 Selection of industries for industrial transfer between Beijing, Tianjin and Hebei Province
Beijing, Tianjin and Hebei Provinces are positioned to be coordinated with and complement each other and promote staggered development. The positions of the three places align with the overall position of the region and meet the strategic needs for the coordinated development of Beijing, Tianjin and Hebei Province. According to the Planning Outline for the Coordinated Development of Beijing, Tianjin and Hebei Province (hereinafter referred to as the Planning), Beijing is positioned as the “National Political, Cultural, International Exchange and Science and Technology Innovation Centre”; Tianjin is positioned as the “National Advanced Manufacturing Research and Development (R & D) Base, Northern International Shipping Core Area, Financial Innovation Operation Demonstration Zone, and Reform and Opening-up Pilot Area”; Hebei Province is positioned as the “National Key Base for Modern Trade Logistics, Industrial Transformation and Upgrade Pilot Area, Demonstration Zone for New Urbanization and Overall Urban-rural Development, and Ecological Environment Support Area for the Beijing, Tianjin and Hebei region” [38].
One of the important economic features of Beijing is the headquarters economy. The advantage lies in the development of the service economy. Since the dominant industries are finance, culture, and information technology, it is imperative to gradually reduce the scale of manufacturing there [38]. Tianjin has an advanced manufacturing industry and it is dominated by capital-driven industries. The manufacturing scale and technology intensity are both leading in China. It is at the mid-end of the industrial chain and serves as its backbone in the Beijing, Tianjin and Hebei region. In view of the fact that China has the world’s largest manufacturing scale but is not yet a manufacturing powerhouse, Tianjin should target the international trends and give full play to its advantages in scientific and technological resources and R & D to become a national new industrialization demonstration base and industry cluster district in the equipment manufacturing and electronic information system fields and gradually form a strong competitive industrial system and key industrial chain.
Shijiazhuang, the capital city of Hebei, is located along the secondary traffic axis. It has obvious advantages in manufacture of textile, manufacture of textile wearing and apparel, and manufacture of leather, fur, feather and related products and footwear. Qinhuangdao, Tangshan, and Cangzhou are located in the middle section of the coastline of the Bohai Bay, which are very advantageous locations. Qinhuangdao has advantages in manufacture of metal products and manufacture of foods; Tangshan has advantages in smelting and pressing of ferrous metals. Cangzhou, as the third chemical city in China, has outstanding in the manufacture of raw chemical materials and chemical products. Located between Beijing and Tianjin, Langfang is an important place for industrial and population transfer from the Capital. The advantageous industries of this city include manufacture of articles for culture, education and sport activity and manufacture of foods. Baoding has great advantages in manufacture of paper and paper products, manufacture of rubber and plastic, as well as processing of food from agricultural products. Xingtai and Handan are heavy-industrial-resource-based cities. Smelting and pressing of ferrous metals are dominant and the textile industry is also good. Chengde is rich in mineral resources. So it has great advantage in the mining of ferrous metal ores and smelting and pressing of ferrous metals. In addition, the manufacture of foods and manufacture of wine, drinks and refined tea is also developed in Chengde. Hengshui, as a light industrial city in North China, has obvious advantages in processing of food from agricultural products and manufacture of leather, fur, feather and related products and footwear. Zhangjiakou has a comparative advantage in manufacture of general purpose machinery and processing of food from agricultural products.
Therefore, from Table 9, it can be seen that Beijing has industries that are on the trend of industrial transfer. The industries that should be taken over by the peripheral areas are listed in Table 10.
Table 10. Choice of industrial transfer path from Beijing
|
No. |
Industry |
Region |
|
1 |
utilization of waste resources |
Tianjin |
|
2 |
smelting and pressing of non-ferrous metals |
Tianjin |
|
3 |
manufacture of foods |
Tianjin, Qinhuangdao, Chengde, Langfang |
|
4 |
smelting and pressing of ferrous metals |
Tangshan, Handan, Xingtai, Chengde |
|
5 |
manufacture of leather, fur, feather and related products and footwear |
Shijiazhuang, Hengshui |
|
6 |
manufacture rubber and plastic |
Baoding |
|
7 |
manufacture of articles for culture, education and sport activity |
Langfang |
|
8 |
mining and processing of ferrous metal ores |
Chengde |
|
9 |
manufacture of raw chemical materials and chemical products |
Cangzhou |
|
10 |
manufacture of textile wearing and apparel |
Shijiazhuang, Handan, Xingtai |
|
11 |
processing of food from agricultural products |
Baoding, Hengshui, Zhangjiakou, Chengde |
|
12 |
manufacture of metal products |
Qinhuangdao |
|
13 |
manufacture of wine, drinks and refined tea |
Chengde |
|
14 |
Manufacture of paper and paper products |
Baoding |
5.1 Conclusions
This research uses the market potential model based on the new economic geography to calculate the market potentials, market potential contributions and market potential gaps of Beijing, Tianjin and various cities in Hebei Province. The following conclusions are obtained:
(1) During 2012-2019, the spatial pattern of the regional market potential of Beijing, Tianjin and Hebei Province centred on Beijing and Tianjin, and the market potential gradually decreased from inside to outside. There are three tiers: Beijing and Tianjin are the first-tier cities; Langfang, Tangshan, Baoding, Cangzhou and Shijiazhuang are the second-tier cities; and Qinhuangdao, Handan, Xingtai, Hengshui, Chengde and Zhangjiakou are the third-tier cities. Both Beijing and Tianjin have strong radiations to the prefecture-level cities in Hebei, but the polarization effects are also increasing day by day. The market potentials of Beijing, Tianjin and Hebei Province are all growing, but the gaps between them keep enlarging and will probably further enlarge in the future development. (2) The LQ of Beijing, Tianjin and Hebei Province are very different. In Beijing, the tertiary industry is the most specialized and thus is a dominant industry. Tianjin has advantages in both the secondary and the tertiary industries. Hebei Province has advantages in both the primary and the secondary industries, but it is left behind in the tertiary industry. Hebei needs to take this opportunity to actively undertake the industrial transfer from Beijing and Tianjin, especially the former, so as to promote the industrial coordinated development in the Beijing, Tianjin and Hebei region.
(3) The important economic features in Beijing is the headquarters economy, its advantage lies in the development of the service economy. The dominant industries are finance, culture, and information technology, so it is imperative to gradually reduce the scale of manufacture there. Tianjin should aim at the international trend in the development of manufacturing industry, become a national new industrial gathering area and a demonstration base for industrial industrialization. Hebei Province should undertake industrial transfer from Beijing combined their own advantages and characteristics. Langfang, Chengde and Qinhuangdao undertake the manufacture of foods. The undertaking cities of smelting and pressing of ferrous metals are Xingtai, Handan, Tangshan and Chengde, Hengshui and Shijiazhuang should undertake manufacture of leather the manufacture of raw chemical materials and chemical products is undertaken by Cangzhou.
The authors gratefully acknowledge financial support from Statistical Science Research Project of Hebei Province (Grant No.: 2019HY15); The Doctoral Foundation of North China Institute of Aerospace Engineering (Grant No.: BKY-2020-04); The Soft Science Research Project of Science and Technology Department of Hebei Province (Grant NO.: 20557643D); The Social Science Development Research Project of Hebei Province (Grant NO.: 20200203111).
[1] Zhang, Y., Zheng, H.M., Yang, Z.F., Li, Y.X., Liu, G.Y., Su, M.R., Yin, X.N. (2016). Urban energy flow processes in the Beijing–Tianjin–Hebei (Jing-Jin-Ji) urban agglomeration: combining multi-regional input–output tables with ecological network analysis. Journal of Cleaner Production, 114: 243-256. https://doi.org/10.1016/j.jclepro.2015.06.093
[2] Li, Z. (2017). The Affection of implementing environmental policy towards Beijing-Tianjin-Hebei region. International Journal of Environmental Protection and Policy, 5(3): 43-47. https://doi.org/10.11648/j.ijepp.20170503.13
[3] Zhang, M.H., Li, Y.G., Zhang, Y., Tian, X. (2018). Analysis of energy metabolism process in Beijing-Tianjin-Hebei urban agglomeration. Energy Procedia, 152: 1109-1113. https://doi.org/10.1016/j.egypro.2018.09.134
[4] Hao, Y., Zhang, M.H., Zhang, Y., Fu, C.L., Lu, Z.M. (2018). Multi-scale analysis of the energy metabolic processes in the Beijing–Tianjin–Hebei (Jing-Jin-Ji) urban agglomeration. Ecological Modelling, 369: 66-76. https://doi.org/10.1016/j.ecolmodel.2017.12.012
[5] Zhang, Y., Li, Y.X., Zheng, H.M. (2017). Ecological network analysis of energy metabolism in the Beijing-Tianjin-Hebei (Jing-Jin-Ji) urban agglomeration. Ecological Modelling, 9(8): 1-21. https://doi.org/10.1016/j.ecolmodel.2017.02.015
[6] Wang, X.Y., Wu, S.Y., Li, A.C. (2017). Urban metabolism of three cities in Jing-Jin-Ji urban agglomeration, China: Using the MuSIASEM approach. Sustainability, 178: 773-783. https://doi.org/10.3390/su9081481
[7] Xie, H.L., He, Y.F., Xie, X. (2017). Exploring the factors influencing ecological land change for China's Beijing–Tianjin–Hebei Region using big data. Journal of Cleaner Production, 142: 677-687. https://doi.org/10.1016/j.jclepro.2016.03.064
[8] Zhang, D., Huang, Q.X., He, C.Y., Wu, J.G. (2017). Impacts of urban expansion on ecosystem services in the Beijing-Tianjin-Hebei urban agglomeration, China: A scenario analysis based on the Shared Socioeconomic Pathways. Resources, Conservation and Recycling, 125: 115-130. https://doi.org/10.1016/j.resconrec.2017.06.003
[9] Wang, Z.F., Zheng, F.J., Zhang, W.H., Wang, S.T. (2018). Analysis of SO2 pollution changes of Beijing-Tianjin-Hebei region over China based on OMI observations from 2006 to 2017. Advances in Meteorology, 8: 1-15. https://doi.org/10.1155/2018/8746068
[10] Miao, Y.C., Guo, J.P., Liu, S.H., Liu, H., Zhang, G., Yan, Y., He, J. (2017). Relay transport of aerosols to Beijing-Tianjin-Hebei region by multi-scale atmospheric circulations. Atmospheric Environment, 165: 35-45. https://doi.org/10.1016/j.atmosenv.2017.06.032
[11] Han, R., Tang, B.J., Fan, J.L., Liu, L.C., Wei, Y.M. (2016). Integrated weighting approach to carbon emission quotas: an application case of Beijing-Tianjin-Hebei region. Journal of Cleaner Production, 131: 448-459. https://doi.org/10.1016/j.jclepro.2016.05.001
[12] Sun, Y.K., Li, G.P. (2017). Evaluation and upgrading of the Beijing-Tianjin-Hebei regional collaborative innovation capacity. Progress in Geography, 36: 78-86. https://doi.org/10.18306/dlkxjz.2017.01.008
[13] Guo, X.R., Fu, L.W., Ji, M.S., Lang, J.L., Chen, D.S., Cheng, S.Y. (2016). Scenario analysis to vehicular emission reduction in Beijing-Tianjin-Hebei (BTH) region, China. Environmental Pollution, 216: 470-479. https://doi.org/10.1016/j.envpol.2016.05.082
[14] Zhao, Z., Bai, Y.P., Wang, G.F., Chen, J.C., Yu, J.L., Liu, W. (2018). Land eco-efficiency for new-type urbanization in the Beijing-Tianjin-Hebei Region. Technological Forecasting and Social Change, 137: 19-26. https://doi.org/10.1016/j.techfore.2018.09.031
[15] Ikeda, K., Murota, K., Takayama, Y. (2016). Stable economic agglomeration patterns in two dimensions: beyond the scope of central place theory. Journal of Regional Science, 57(1): 132-172. https://doi.org/10.1111/jors.12290
[16] Doran, D., Fox, A. (2016). Operationalizing central place and central flow theory with mobile phone data. Annals of Data Science, 3(1): 1-24. https://doi.org/10.1007/s40745-015-0066-4
[17] Li, J., Wen, J.X., Jiang, B. (2017). Spatial spillover effects of transport infrastructure in Chinese New Silk Road Economic Belt. International Journal of e-Navigation and Maritime Economy, 6: 1-8. https://doi.org/10.1016/j.enavi.2017.05.001
[18] Yan, X.Y., Zhou, T. (2019). Destination choice game: A spatial interaction theory on human mobility. Scientific Reports, 9(1): 9466-9471. https://doi.org/10.1038/s41598-019-46026-w
[19] Migliaccio, E., Verdier, T. (2018). On the spatial diffusion of cooperation with endogenous matching institutions. Games, 9(3): 58. https://doi.org/10.3390/g9030058
[20] Bai, Z.Z. (2018). Respectively scaled HSS iteration methods for solving discretized spatial fractional diffusion equations. Numerical Linear Algebra with Applications, 25(5): 2157-2169. https://doi.org/10.1002/nla.2157
[21] Yu, J.G. (2019). Real economic development model of coastal cities based on point and axis development theory. Journal of Coastal Research, 93(sp1): 791-797. https://doi.org/10.2112/si93-111.1
[22] Vickerman, R. (2018). Can high-speed rail have a transformative effect on the economy. Transport Policy, 62: 31-37. https://doi.org/10.1016/j.tranpol.2017.03.008
[23] Desmet, K., Nagy, D.K., Rossi-Hansberg, E. (2018). The geography of development. Journal of Political Economy, 126(3): 903-983. https://doi.org/10.1086/697084
[24] Meyer, D., Shera, A. (2017). The impact of remittances on economic growth: An econometric model. EconomiA, 18(2): 147-155. https://doi.org/10.1016/j.econ.2016.06.001
[25] Strauss, K. (2017). Labour geography 1: Towards a geography of precarity. Progress in Human Geography, 42(4): 622-630. https://doi.org/10.1177/0309132517717786
[26] Feng, M., Yu, K.H., Hao, R. (2017). Evaluation of regional industry transfer undertaking ability based on sustainable development. Journal of Scientific and Industrial Research, 76(5): 269-272.
[27] Yu, L.D., Shang, S.Y. (2018). The impact of policy intervention on regional economic growth in China. Modern Economy, 9(12): 2224-2232. https://doi.org/10.4236/me.2018.912137
[28] Xiong, L.C., Yu, C., Martin, D.J., Wang, F.T., Cheng, B.D. (2017). Economic transformation in the Beijing-Tianjin-Hebei Region: Is it undergoing the environmental Kuznets Curve. Sustainability, 9(5): 869. https://doi.org/10.3390/su9050869
[29] Li, K., Lin, B.Q. (2017). Economic growth model, structural transformation, and green productivity in China. Applied Energy, 187: 489-500. https://doi.org/10.1016/j.apenergy.2016.11.075
[30] Gaspar, J.M. (2018). A prospective review on new economic geography. The Annals of Regional Science, 61: 237-272. https://doi.org/10.1007/s00168-018-0866-5
[31] Harris, C.D. (1954). The market as a factor in the localization of industry in the United States. Annals of the Association of American Geographers, 44: 315-348. https://doi.org/10.1080/00045605409352140
[32] Krugman, P. (1991). Increasing returns and economic geography. The Journal of Political Economy, 99(3): 483-499. https://doi.org/ 10.1086/261763
[33] Gould, P., Haggett, P. (1967). Locational analysis in human geography. Locational Analysis in Human Geography, 292.
[34] Tang, C.S., Lu, P., Fan, S.Y., Deng, S.S. (2017). A study on spatial economic correlation among Beijing-Tianjin-Hebei urban agglomeration. Journal of Yanshan University (Philosophy and Social Science Edition), 18(6): 80-87. https://doi.org/10.15883/j.13-1277/c.20170608008
[35] Morrissey, K. (2014). A location quotient approach to producing regional production multipliers for the Irish economy. Papers in Regional Science, 95(3): 491-506. https://doi.org/10.1111/pirs.12143
[36] Morrissey, K. (2014). Producing regional production multipliers for Irish marine sector policy: A location quotient approach. Ocean and Coastal Management, 91(4): 58-64. https://doi.org/10.1016/j.ocecoaman.2014.02.006
[37] Jahn, M. (2017). Extending the FLQ formula: A location quotient-based interregional input–output framework. Regional Studies, 51(10): 1518-1529. https://doi.org/10.1080/00343404.2016.1198471
[38] Liao, H.W., Zhang, N. (2016). Research on the problem of industrial transfer under the coordinated development of Beijing-Tianjin-Hebei. Journal of University of Jinan (Social Science Edition), 26(3): 85-93.