Chun Li | Yi Cai*
© 2020 IIETA. This article is published by IIETA and is licensed under the CC BY 4.0 license (http://creativecommons.org/licenses/by/4.0/).
OPEN ACCESS
Under the influence of water, the strength of rock-soil material changes over time. The strength degradation conforms to varied laws in different areas of the slope. This paper carries out lab experiments on the strength degradation laws of slip zone soil under long-term saturation in a bank slope of the Three Gorges Reservoir (TGR) area. The experimental results show that the strength attenuation weakened with the growing saturation time. Based on the experimental data, the authors established the formulas about the variation of strength parameters with saturation time. As the saturation time increased from 2, 5, 10 to 30 days, the cohesive force decreased by 18.8%, 28.1%, 36.1%, and 41.3%, while the friction angle narrowed by 22.9%, 31.9%, 36.5%, and 39.4%, respectively. Hence, both cohesive force and the friction angle declined exponentially with the elapse of saturation time. In addition, numerical simulation was carried out under long-term saturation to reflect the effect of strength parameter degradation on slope stability. It is learned that the stability coefficient dropped from 1.377 to 1.005 over 17 years, and the annual difference of the factor of safety dropped exponentially to the equilibrium level.
bank slope, strength degradation, long-term saturation, slope stability
Since water impoundment, many landslides of varied scales have occurred in the Three Gorges Reservoir (TGR) area of Central China, posing a great threat to the lives of residents and the shipping in the Yangtze River [1, 2]. As a kind of slope failure, landslide could be attributed to various factors, namely, the insufficient strength of rock-soil mass, the weakness of structural plane, intense rainfall, seismic actions, and human activities [3-7].
The interaction mechanism between water and rock-soil mass has long been a hot topic in research of slope stability in the TGR area [8-12]. For instance, the strength degradation law of rock mass under cyclic wetting and drying has been deeply explored through experiments, creating many theoretical formulas and mathematical models. The relevant results have been applied to analyze the stability of bank slopes in the reservoir area [13-15]. Besides, the influence of wetting-drying cycle on the strength degradation of expansive soil has attracted much attention, for the expansive soil is highly sensitive to water due to its specific physical properties [16-20]. The relevant research has clarified the correlations between shear strength and water content, cycle number, and cycle loop. In general, the shear strength of soil in the drying path is higher than that in the wetting path, owing to the hysteresis effect; the shear strength difference between wetting and drying paths in the first cycle is more significant than that of the subsequent cycles.
Experimental results have shown that long-term water saturation greatly affects soil strength degradation. For example, considering long-term water saturation, the mechanical property of mudstone was found to decrease gradually to a constant value with the elapse of time [21, 22]. However, there are not many new reports on the influence of long-term water saturation over soil strength degradation.
In the reservoir area, the weakest plane of bank slopes usually falls in the slip zone. The strength of the slip zone directly hinges on the pore water in soil. Hence, the slip zone is the focal point in slope stability analysis. In the bank slope, the position of filtrating line changes with the periodic fluctuation of water level in the reservoir [23, 24]. Thus, the soil in the slip zone below the lowest infiltrating line is mainly affected by long-term water saturation, while that between the lowest and highest infiltrating lines is mainly affected by the wetting-drying cycle. The strength attenuation law of slip zone soil directly bears on the stability of the bank slopes in the reservoir area.
Despite the abundance of studies on strength attenuation of rock-soil mass, few researchers have considered the time-dependent stability of landslide. To master the trend of landslide stability, it is necessary to consider both strength attenuation law and rheological property of slip zone soil. But such attempts have rarely been made at home or abroad.
Drawing on the relevant literature, this paper measures the triaxial shear strength of slip zone soil under long-term saturation through lab experiments. Based on experiment data, the mathematical formulas about the attenuation law of strength parameters were put forward. Then, the effect of soil strength degradation on slope stability was explored through numerical simulation.
2.1 Samples of slip zone soil
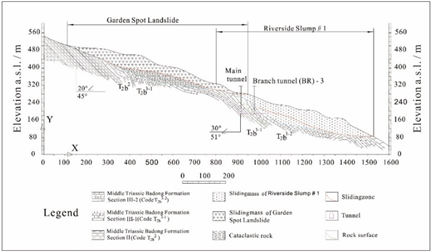
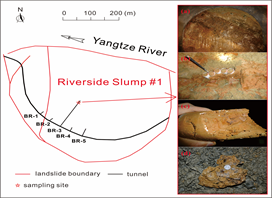
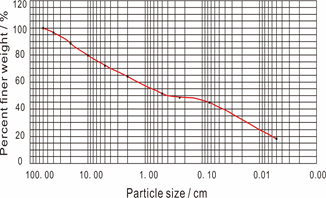
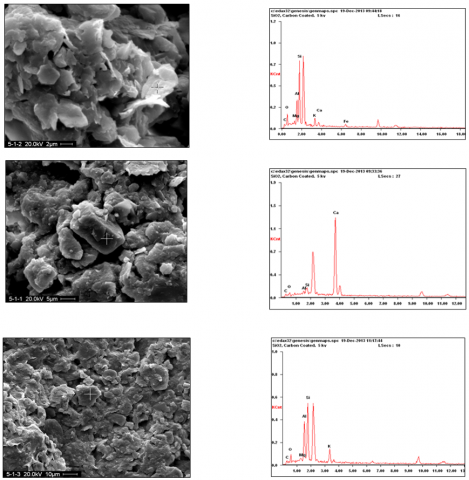
Samples used for the experimental study were taken from the slip zone of a typical reservoir landslide, named Huangtupo landslide in the TGR region, approximately 69 km far away from the dam, seen in Figure 1. The Engineering geological profile of the landslide was depicted in Figure 2. This huge ancient landslide is consisted by four subordinate landslides (the Riverside Slump #1, the Riverside Slump #2, the Garden Spot Landslide, the Substation Landslide), and has been reactivated by the fluctuation of the reservoir water level. The in-situ deformation monitoring data show that the Huangtupo landslide is in the creeping deformation stage at present [11]. Soil samples were taken from the BR-3 tunnel in the Riverside Slump #1 (Figure 3), which is 770 m in length, 450 ~ 500 m in width and 69.4 m in thickness. The physical properties of the slip zone soil are illustrated in Table 1, the mean natural water content is 9.8%, the dry density is 2.07 g/cm3, the argillaceous particle content is 64.7%, and the mean plasticity index Ip17 is 11.7. Samples are silty clay with gravels, particle diameter varies from 60 mm to 0.005 mm, the nonuniform coefficient Cu is 300 and the curvature coefficient Cc is 0.03, as indicated by Figure 4. Results of the X-ray diffraction tests shown that the slip zone soil is consist of calcite, chlorite, illite, quartz, and feldspar in descending order of abundance, and the expansibility is not obvious since the amounts of hydrophilic minerals is rare in the slip zone soil. Moreover, the layered sheets of clay and cuboid calcite are widely spread, as shown by Figure 5.
Before the tests, samples of the slip zone soil were stoved, grinded down and sieved to get fine particles less than 2 mm. Afterwards, these fine particles were mixed with distilled water at natural water content for 24 hours, and then were compacted to cylinder specimens layer by layer, 39.1 mm in diameter and 80 mm in height (Φ39.1×80mm). The initial cohesive force and friction angle of specimens were detected as 57.8 kPa and 22.2°, through the consolidated undrain triaxial compression tests (CU). These specimens will be further used to study the strength degradation under the long-term saturation condition.
Figure 1. Geographic location of Huangtupo Landslide provided by Google Earth
Figure 2. Engineering geological profile of the landslide
Figure 3. Site of in-situ sampling, including (a) sampling area; (b) in-situ sampling; (c) internal texture; (d) fragment of slip zone material
Figure 4. Particle size distribution of the slip zone soil
Table 1. Physical properties of the specimen sets
|
Sets |
Particle size fractions (%) |
Liquid Limit (LL) |
Plasticity index (Ip) |
Particle Density (ρs) |
Water content (w) |
Dry density (ρd) |
|||
|
Gravel (>2mm) |
Sand (0.075~2mm) |
Silt (0.005~0.075mm) |
Clay (<0.005mm) |
% |
/ |
g/cm3 |
% |
g/cm3 |
|
|
HD-1 |
29.7 |
21.7 |
28.3 |
20.3 |
28.9 |
12.0 |
2.73 |
10.1 |
2.07 |
|
HD-2 |
35.9 |
19.2 |
26.5 |
18.4 |
28.2 |
11.5 |
2.73 |
9.7 |
2.07 |
|
HD-3 |
38.7 |
18.9 |
24.7 |
17.7 |
26.9 |
11.2 |
2.73 |
9.6 |
2.06 |
|
HD-4 |
39.1 |
13.1 |
28.5 |
19.3 |
28.4 |
11.9 |
2.73 |
9.9 |
2.07 |
|
Mean value |
35.9 |
18.2 |
27.0 |
18.9 |
28.1 |
11.7 |
2.73 |
9.8 |
2.07 |
Figure 5. SEM images and energy spectrum of the slip zone soil
2.2 Long-term saturation tests
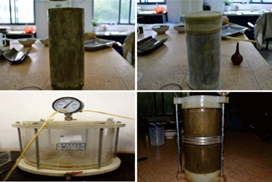
The Riverside Slump #1 shows greater deformation than the others according to in situ monitoring data, of which the relationship between the direct shear strength and the wetting-drying cycles has been investigated [25]. To explore the influence of time on soil strength, a vacuum pump was used to vacuumize the specimens, which were then soaked in distilled water for relatively quite a long time (seen in Figure 6). The specimen was wrapped in a rubber membrane to avoid soil erosion and also to prevent chemical reaction between soil and external water, while water permeated into soil through filter paper and porous stone at the top and the bottom of specimen. Five sets of specimens were soaked in water under constant water head for 2, 5, 10, 30 days, respectively.
Figure 6. Preparation process of one cylindrical specimen used in the tests
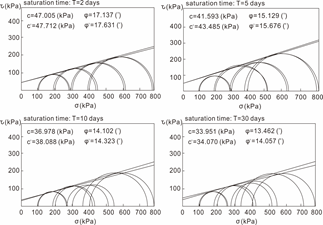
The specimen is characterized by clay soil as the gravels in the soil were removed, which means the internal water would be quite difficult to discharge when loaded. So, it is better to conduct the shearing test under the consolidated undrained condition, not only the testing time were shortened, but also the pore water pressure can be measured. On the basis of long-term saturation tests, the triaxial strength of slip zone soil was measured by CU tests after different saturation duration, results were shown in Figure 7. The pore water pressure of specimens was monitored during CU tests, so the variation of effective strength can be observed at the same time. Figure 7 shows that soil strength gradually decreases with saturation time increasing. When the saturation time varies from 2, 5, 10 to 30 days, the cohesive force of slip zone soil significantly decreased from 57.865 kPa to 47.005 kPa, 41.593 kPa, 36.987 kPa and 33.951 kPa, accordingly. While the friction angle reduced from 22.223° to 17.137°, 15.129°, 14.102°and 13.462°, respectively. The same attenuation regularity was found on the effective cohesive force and the effective friction angle of slip zone soil. It can be concluded that strength of slip zone soil reduced a lot at the first two days, as the cohesive force was 47.005 kPa and the friction angle was 17.137° when specimen was soaked in water for 2 days. With the saturation time going on, e.g. when it extended from 10 days to 30 days, the strength attenuation becomes weaken as the reduction of the cohesive force and the friction angle was merely 3 kPa and 0.6° in magnitude, respectively.
Figure 7. Strength value while saturation duration increases from 2 to 30 days
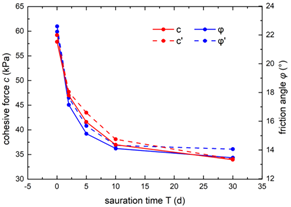
Figure 8. Strength variation in the long-term saturation tests
To reveal the strength variation characteristics, Figure 8 was plotted. Wherein, the red represents the cohesive force and the blue represents the friction angle, the normal strength and the effective strength were distinguished by solid and dash line. The cohesive force shows a negative relationship with saturation time, as well as the friction angle. Both the cohesive force and the friction angle degraded exponentially with saturation time going on. The reduction of cohesive force and friction angle was 18.8% and 22.9%, 28.1% and 31.9%, 36.1% and 36.5%, 41.3% and 39.4%, corresponding to 2, 5, 10, 30 days saturation. Similar degradation characteristics were found on the effective strength for both test results.
The strength parameters of slip zone soil are assumed to reduce simultaneously by different reduction coefficients, as shown in Eq. (1) and Eq. (2).
$c_{(t)}=\alpha \cdot e^{-t / a}+\mathrm{c}$ (1)
$\tan \varphi_{(t)}=\beta \cdot e^{-t / b}+d$ (2)
where, $\alpha$ and $\beta$ are the time-dependent reduction coefficients; $c_{0}$ and $\varphi_{0}$ is the initial cohesion and internal friction angle; $c_{(t)}$ and $\varphi_{(t)}$ is the reduced cohesion and internal friction angle at a certain time. $\alpha, \beta, a, b, c$ are the coefficients that need to be determined through tests.
According to the experimental data, $\alpha=23.98, \beta=0.16$ $a=5.31, b=2.29, c=33.86, d=0.25.$ The initial strength parameters $c_{0}=57.865 k P a, \varphi_{0}=22.223^{\circ} .$ To study the long-term stability of landslide, strength parameters of slip zone soil are reduced every 1 year. So, Eq. (3) and Eq. (4) can be transformed as follows:
$c_{(t)}=23.98 e^{-t / 5.31}+33.86$ (3)
$\tan \varphi_{(t)}=0.16 e^{-t / 2.29}+0.25$ (4)
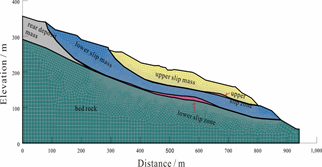
Based on the above test results, the strength deterioration of slip zone soil was taken into consideration in evaluating the time-varying stability in a relatively long period. The finite difference method was selected in modelling, which has been widely used in engineering [26]. A two two-dimensional model was built according to geological exploration data, and it was 940 m horizontally and 350 m vertically (seen in Figure 9). It was consisted of six parts: upper slip mass, upper slip zone, lower slip mass, lower slip zone, rear deposit mass and bed rock. The material composition of slip body, slip zone, bending rock are gravel soil, silty clay, muddy sandstone, respectively. The physical mechanic parameters of each zone used in numerical simulation was shown in Table 2.
In the modelling, the Mohr-Coulomb model was applied to the slip mass and the bed rock, for the sake of improving computational efficiency. The constitutive model of the slip zone soil was a viscoelastic H-K model, it is consisted by a spring (with elastic constant E0) connected with a Kelvin element (with elastic constant E1 and viscous constant η) in series. The creep constitutive equation can be written as:
$\varepsilon_{(t)}=\frac{\sigma_{0}}{E_{0}}+\frac{\sigma_{0}}{E_{1}}-\frac{\sigma_{0}}{E_{1}} e^{-\frac{E_{1}}{\eta} t}$ (5)
where, $\sigma_{0}$ is the constant stress; $E_{0}, E_{1}$ is the elastic modulus related to the instantaneous strain and linear strain, respectively; $\eta$ is the viscosity coefficient related to the attenuation creep.
The constitutive parameters in the viscoelastic model are obtained after data processing on the creep tests [27], $ \sigma_{0}=$ $0.5 \mathrm{MPa}, \quad E_{0}=17.47 \mathrm{kPa}, \quad E_{1}=51.41 \mathrm{kPa}, \quad \eta=$ $775.26 \mathrm{kPa} \cdot \mathrm{h}$.
The bottom of the model was fixed at both vertical and horizontal direction, while the left and right side of the model were fixed at horizontal direction.
Figure 9. The numerical model of Huangtupo landslide used in simulation modelling
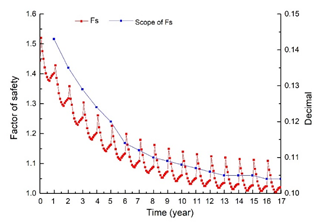
Figure 10. The time-varying stability of landslide in 17 years
When the strength deterioration formula was taken into account, the change of landslide stability was illustrated by Figure 10. Table 3 shows the stability coefficient in 17 years, the minimum Fs of investigated landslide reduces from 1.377 to 1.005 in 17 years, and the annually difference of Fs reduces gradually to a constant value in exponential format with time going on. So, it can be deduced that the influence of the strength attenuation on the value Fs becomes weak as time going on.
Table 2. Physical mechanic parameters used in modelling
|
Zone |
Elasticity modulus (MPa) |
Poisson’s ratio |
Unit weight (kN/m3) |
Cohesive force (kPa) |
Friction angle (°) |
|
Upper slip mass |
727.0 |
0.31 |
21.0 |
80.0 |
25.0 |
|
Upper slip zone |
28.6 |
0.34 |
19.9 |
33.0 |
16.0 |
|
Lower slip mass |
2100.0 |
0.29 |
23.0 |
90.0 |
24.0 |
|
Lower slip zone |
36.8 |
0.35 |
21.3 |
57.8 |
22.2 |
|
Rear deposit mass |
727.0 |
0.31 |
21.0 |
80.0 |
25.0 |
|
Bed rock |
36740.0 |
0.26 |
26.0 |
380.0 |
44.0 |
Table 3. The landslide stability coefficient in 17 years
|
Time (year) |
Maximum value of Fs |
Minimum value of Fs |
Mean value of Fs |
Scope of Fs |
|
1 |
1.520 |
1.377 |
1.416 |
0.143 |
|
2 |
1.428 |
1.293 |
1.330 |
0.135 |
|
3 |
1.358 |
1.229 |
1.265 |
0.129 |
|
4 |
1.304 |
1.180 |
1.214 |
0.124 |
|
5 |
1.261 |
1.141 |
1.174 |
0.120 |
|
6 |
1.226 |
1.112 |
1.144 |
0.114 |
|
7 |
1.199 |
1.087 |
1.118 |
0.112 |
|
8 |
1.179 |
1.069 |
1.099 |
0.110 |
|
9 |
1.162 |
1.053 |
1.083 |
0.109 |
|
10 |
1.149 |
1.041 |
1.071 |
0.108 |
|
11 |
1.139 |
1.032 |
1.062 |
0.107 |
|
12 |
1.131 |
1.025 |
1.054 |
0.106 |
|
13 |
1.124 |
1.019 |
1.048 |
0.105 |
|
14 |
1.120 |
1.015 |
1.044 |
0.105 |
|
15 |
1.115 |
1.010 |
1.039 |
0.105 |
|
16 |
1.112 |
1.008 |
1.037 |
0.104 |
|
17 |
1.109 |
1.005 |
1.034 |
0.104 |
In this work, experiments under the long-term saturation condition were conducted to study the strength degradation regularity of slip zone soil. Results shown that soil strength attenuation becomes weaken with saturation time increasing. When the saturation time varies from 2, 5, 10 to 30 days, the cohesive force of slip zone soil significantly decreased from 57.865 kPa to 47.005 kPa, 41.593 kPa, 36.987 kPa and 33.951 kPa, accordingly. While the friction angle reduced from 22.223° to 17.137°, 15.129°, 14.102°and 13.462°, respectively. When soaked in water, the soil strength reduced a lot at the first two days, as the cohesive force reduced to 47.005 kPa and the friction angle reduced to 17.137°. With saturation time going on, the strength attenuation becomes weaken.
The cohesive force shows a negative relationship with the saturation time, as well as the friction angle. The strength parameter c, φ can be summarized to functions related to the saturation time T. $c_{(t)}=23.98 e^{-t / 5.31}+33.86$, $\tan \varphi_{(t)}=0.16 e^{-t / 2.29}+0.25$. Both the cohesive force and the friction angle degraded exponentially with the saturation time going on. Similar degradation characteristics were found on the effective strength for both test results.
Numerical simulation considering the long-term saturation condition was carried out to illustrate the influence of strength parameter degradation on slope stability, the stability coefficient in 17 years was calculated, which reduced from 1.377 to 1.005, and the annually difference of Fs reduces gradually to a constant value in exponential format with time going on.
This research is supported by the Fundamental Research Funds for the Provincial Universities of Zhejiang (Grant No.: 22016000319030) and the Doctoral Scientific Research Foundation of Anhui Jianzhu University (Grant No.: 2018QD26).
[1] Tang, H.M., Wasowski, J., Juang, C.H. (2019). Geohazards in the three Gorges Reservoir Area, China-Lessons learned from decades of research. Engineering Geology, 261: 105267. https://doi.org/10.1016/j.enggeo.2019.105267
[2] Tang, H.M., Yong, R., Eldin, M.A.M.E. (2017). Stability analysis of stratified rock slopes with spatially variable strength parameters: The case of Qianjiangping landslide. Bulletin of Engineering Geology and the Environment, 76: 839-853. https://doi.org/10.1007/s10064-016-0876-4
[3] Song, D.Q., Chen, Z., Ke, Y.T., Nie, W. (2020). Seismic response analysis of a bedding rock slope based on the time frequency joint analysis method: A case study from the middle reach of the Jinsha River, China. Engineering Geology, 274: 105731. https://doi.org/10.1016/j.enggeo.2020.105731
[4] Tiwari, B., Ajmera, B., Dhital, S. (2017). Characteristics of moderate to large scale landslides triggered by the Mw 7.8 2015 Gorkha earthquake and its aftershocks. Landslides, 14: 1297-1318. https://doi.org/10.1007/s10346-016-0789-0
[5] Tao, Z.G., Shu, Y., Yang, X.J., Peng, Y.Y., Chen, Q.H., Zhang, H.J. (2020). Physical model test study on shear strength characteristics of slope sliding surface in Nanfen open -pit mine. International Journal of Mining and Science Technology, 30(3): 421-429. https://doi.org/10.1016/j.ijmst.2020.05.006
[6] Yano, A., Shinohara, Y., Tsunetaka, H., Mizuno, H., Kubota, T. (2019). Distribution of landslides caused by heavy rainfall events and an earthquake in northern Aso Volcano, Japan from 1955 to 2016. Geomorphology, 327: 533-541. https://doi.org/10.1016/j.geomorph.2018.11.024
[7] Serdarevic, A., Babic, F. (2019). Landslide causes and corrective measures-case study of the Sarajevo canton. Journal of Civil Engineering Research, 9(2): 51-57. https://doi:10.5923/j.jce.20190902.02
[8] Yin, Y.P., Huang, B.L., Wang, W.P., Wei, Y.J., Ma, X.H., Ma, F., Zhao, C.J. (2016). Reservoir-induced landslides and risk control in three Gorges Project on Yangtze River, China. Journal of Rock Mechanics and Geotechnical Engineering, 8(5): 577-595. https://doi.org/10.1016/j.jrmge.2016.08.001
[9] Song, K., Wang, F.W., Yi, Q.L., Lu, S.Q. (2019). Landslide deformation behavior influenced by water level fluctuations of the Three Gorges Reservoir (China). Engineering Geology, 247: 58-68. https://doi.org/10.1016/j.enggeo.2018.10.020
[10] Wu, Q., Tang, H.M., Ma, X.H., Wu, Y.P., Hu, X.L., Wang, L.Q., Criss, R.E., Yuan, Y., Xu, Y.J. (2019). Identification of movement characteristics and causal factors of the Shuping landslide based on monitored displacements. Bulletin of Engineering Geology and the Environment, 78(3): 2093-2106. https://doi.org/10.1007/s10064-018-1237-2
[11] Tang, H.M., Li, C.D., Hu, X.L., Su, A.J., Wang, L.Q., Wu, Y.P., Criss, R.E., Xiong, C.R., Li, Y.A. (2015). Evolution characteristics of the Huangtupo landslide based on in situ tunneling and monitoring. Landslides, 12(3): 511-521. https://doi.org/10.1007/s10346-014-0500-2
[12] Tang, H.M., Li, C.D., Hu, X.L., Wang, L.Q., Criss, R.E., Su, A.J., Wu, Y.P., Xiong, C.R. (2015). Deformation response of the Huangtupo landslide to rainfall and the changing levels of the Three Gorges Reservoir. Bulletin of Engineering Geology and the Environment, 74(3): 933-942. https://doi.org/ 10.1007/s10064-014-0671-z
[13] Jiao, Y.Y., Song, L., Tang, H.M., Li, Y.A. (2014). Material weakening of slip zone soils induced by water level fluctuation in the ancient landslides of three gorges reservoir. Advances in Materials Science and Engineering, 2014. https://doi.org/10.1155/2014/202340
[14] Yang, L., Chen, K.S., Lyu, M.F., Wang, Y.C. (2020). Study on failure of red clay slopes with different gradients under dry and wet cycles. Bulletin of Engineering Geology and the Environment. https://doi.org/10.1007/s10064-020-01827-6
[15] Mu, K., Kong, L.W., Zhang, X.W., Yin, S. (2016). Experimental investigation on engineering behaviors of red clay under effect of wetting-drying cycles. Journal of Rock Mechanics and Geotechnical Engineering, 37(8): 2247-2253. https://doi.org/10.16285/j.rsm.2016.08.016
[16] Wu, K., Zhao, C., Zhang, W., Wu, H.T., Wang, Y.J., Yu, Y.L. (2016). Swelling-shrinking characteristics and irreversible deformation of expansive soil during wetting-drying cycles. Journal of Harbin Institute of Technology, 48(12): 121-127. https://doi.org/10.11918/j.issn.0367-6234.2016.12.017
[17] Xu, D., Tang, C.S., Leng, T., Li, Y.S., Zhang, Y., Wang, K., Shi, B. (2018). Shear strength of unsaturated expansive soil during wetting-drying cycles. Earth Science Frontiers, 25(1): 286-296. https://doi.org/10.13745/j.esf.yx.2016-11-62
[18] Li, X.M., Kong, L.W., Guo, A.G.S., Liu, Y. (2017). Experimental research on shear strength of expansive soil under wetting-drying cycles based on wrapping method. Rock and Soil Mechanics, 38(3): 678-684.
[19] Yang, H.P., Wang, X.Z., Xiao, J.C. (2014). Influence of wetting-drying cycles on strength characteristics of Nanning expansive soils. Chinese Journal of Geotechnical Engineering, 36(5): 949-954.
[20] Zeng, Z.T., Lu, H.B., Zhao, Y.L. (2012). Wetting-Drying effect of expansive soils and its influence on slope stability. Applied Mechanics and Materials, 170-173: 889-893. https://doi.org/10.4028/www.scientific.net/AMM.170-173.889
[21] Lu, Y.L., Wang, L.G., Sun, X.K., Wang, J. (2017). Experimental study of the influence of water and temperature on the mechanical behavior of mudstone and sandstone. Bulletin of Engineering Geology and the Environment, 76: 645-660. https://doi.org/10.1007/s10064-016-0851-0
[22] Cai, X., Zhou, Z., Du, X. (2010). Water-induced variations in dynamic behavior and failure characteristics of sandstone subjected to simulated geo-stress. Bulletin of Engineering Geology and the Environment, 130: 104339. https://doi.org/10.1016/j.ijrmms.2020.104339
[23] Sun, G.H., Zheng, H., Tang, H.M., Dai, F.C. (2016). Huangtupo landslide stability under water level fluctuations of the Three Gorges Reservoir. Landslides, 13: 1167-1179. https://doi.org/10.1007/s10346-015-0637-7
[24] Sun, G.H., Yang, Y.T., Cheng, S.G., Zheng, H. (2016). Phreatic line calculation and stability analysis of slopes under the combined effect of reservoir water level fluctuations and rainfall. Canadian Geotechnical Journal, 54(5): 631-645. https://doi.org/10.1139/cgj-2016-0315
[25] Ni, W.D. (2014). Time-varying stability analysis of slope based on dynamic deterioration of geomaterials. China University of Geosciences.
[26] Li, C., Tang, H.M., Han, D.W., Zou, Z.X. (2019). Exploration of the creep properties of undisturbed shear zone soil of the Huangtupo landslide. Bulletin of Engineering Geology and the Environment, 78: 1237-248. https://doi.org/10.1007/s10064-017-1174-5
[27] Wang, J., Zhang, Y., Qin, Z., Song, S.G., Lin. P. (2020). Analysis method of water inrush for tunnels with damaged water-resisting rock mass based on finite element method-smooth particle hydrodynamics coupling. Computers and Geotechnics, 126: 103725. https://doi.org/10.1016/j.compgeo.2020.103725