Vivien Lai | Marlinda Abdul Malek | Samsuri Abdullah | Sarmad Dashti Latif* | Ali Najah Ahmed
© 2020 IIETA. This article is published by IIETA and is licensed under the CC BY 4.0 license (http://creativecommons.org/licenses/by/4.0/).
OPEN ACCESS
Analyzing and predicting the rises in sea level are vital elements in oceanography and marine management especially in managing low-lying coastal areas. The present study aims to analyze the ability of machine learning algorithm viz. regression support vector machine (RSVM) in predicting the changes in the sea level on the east coast of Peninsular Malaysia. The selected inputs for the proposed model are monthly mean sea level (MMSL), monthly sea surface temperature (SST), rainfall and mean cloud cover (MCC) for the period from January 2007 to December 2017. A total of 132 data points for each meteorological parameter were used, where 92 (70%) data points from January 2007 to December 2015 were used for training and 40 (30%) data points from January 2016 to December 2017 were used for validating and testing. Results showed based on the correlation coefficient that the model predicts the sea level rises accurately (R= 0.861, 0.825 and 0.857) for Kerteh, Tanjung Sedili, and Tioman Island, respectively. Moreover, the predicted values were similar to the historical tide-gauge data with very low error, which indicates that the proposed RSVM model can be a promising tool for decision-makers and can be reliable to predict monthly mean sea level rises in Malaysia.
sea level rise, machine learning, time series, meteorological, prediction
Even with the latest technologies available today, there are many complicating factors affected the reliability of the conventional models in predicting of future sea level for three near-shore regions of east coast Peninsular Malaysia (ECPM), viz Kerteh, Tanjung Sedili, and Tioman Island, which is crucial since the population in these low-lying near-shore coastal are frequently exposed to the occurrences of flood inundation. In addition to that, the majority of coastline of these areas are sandy beaches that have undergone the most severe erosion for the past two decades. Therefore, the purpose of accurate prediction of sea level is vital to mitigate any possible damage to the coastal regions and for better protection to the marine ecosystem, boost economic growth, and protect the environment [1]. These areas are suscepitable to any unexpected rises in the sea level which can lead to a serious impact on the coastal structure and the livelihood on the communities in the areas. Therefore, there is a need to develop model capable of capturing and predicting the changes in sea level accurately.
Time series prediction has long been used in various fields of applications [2]. In recent years, a lot of attention has been given to nonlinear or chaotic time-series predictions due to the complex changes that occur due to the drastic changes in climate [3, 4]. One of the major approaches used to carry out the prediction of the sea level rise is the regression model. Nevertheless, the conventional regression approach showed inability to accurately predict the sea level rise due to the ingrained non-linear interrelationship between the input and output variables, hence making it a continuously scientific challenge. Recently, Artificial intelligence (AI) adopted by researchers in order to overcome the limitations of the conventional models [5].
The techniques of artificial intelligence have recently obtained considerable attention from researchers and have been applied to address the limitations associated with the current models. Such techniques have become some of the favored computational methods for forecasting sea level rises, as they can achieve rapid computation using just a few parameters as input [6-9].
Lai et al. [10] proposed Artificial intelligence (AI) algorithm namely genetic programming (GP) to predict the monthly mean sea level (MMSL) for a horizon of 10 years ahead. This study was performed at the east coast of peninsular Malaysia (ECPM) and was compared with three different regions of ECPM in order to attain the consistency and strength of the prediction model. The results of the correlation coefficient of the testing stage given the result of 0.810 with iterations reached 300 epochs. One of the limitations in this algorithm is the time it takes to reach to the optimum value, therefore, there needs to propose a new algorithm capable of attaining a high level of accuracy in a shorter time.
A more recent Artificial intelligence (AI) algorithm, the support vector machine (SVM), has been derived from the statistical learning theory over the past several decades. This algorithm has attracted the interest of many researchers throughout the world [11]. The use of SVM to make an hourly and seasonal forecasts of the flow in the Sevier River Basin was described by Asefa et al. [12]. The advantages of using SVM over Artificial Neural Network (ANN) have been reported by Tkalich et al. [13]. They found that ANN models facing problems such as over-fitting and convergence time considers longer.
In SVM, there are many kernel functions can be used, the benefits of using the kernel function in the SVM algorithm is to make predictions more accurate compared with using a two-layer perceptron of neural network. The are many kernel functions in SVM algorithms, such as polynomial, sigmoid, radial basis functions which can be used to solve quadratic programming problems with linear constraints rather than solving a non-convex, unconstrained problem of minimization as regular ANNs used during training. The kernel functions in the SVM algorithm generated the network weights which could be used in predicting sea levels [5]. Therefore, the section of the best kernel function can help to achieve an acceptable level of accuracy.
Various methods for forecasting sea-level rise have been developed by Günaydin et al. [2, 14]. Such methods were developed using the simple linear production process. Therefore, these approaches have failed to identify the nonlinearity and complexity of the systems [15-18]. Therefore, this study is proposing the use of s supervised learning approach, regression support vector machine (RSVM) to predict the sea-level change at ECPM.
Figure 1. Location of tide gauge at the three areas on the ECPM
The selected study areas in this study are Kerteh which in the district of Kemaman in Terengganu; Tanjung Sedili is a coastal region in Kota Tinggi district, Johor, and finally Tioman Island which is in a district of Tompin, Pahang. The geographical of these study locations are located at the ECPM, Malaysia as shown in Figure 1. The data used in the analyses were historical monthly mean sea level (MMSL) for the period from 2007 to 2017 and was collected from the Department of Survey and Mapping Malaysia (DSMM). A total of 396 (11 years x 12 months x 3 regions) historical data points were generated from the tide data. However, data for certain periods are not available when maintenance work was carried out on the tide gauge meters. The method used to normalize these missing data is discussed in the data normalization section.
The data for the period from January 2007 to December 2015 were used to train while the data from January 2016 to December 2017 were used for analysis by the proposed algorithm. A total of 132 data points for each meteorological parameter were used, where 92 (70%) data points were used for training and 40 (30%) data points were used for validating and testing [19].
A Comprehensive description of the theory for the Regression Support Vector Machine (RSVM) was given by Lai et al. [10]. The use of a kernel function to map the non-linear input space into a linear feature space is very dependent on the nature of the data. In RSVM, there are three types kernel function, viz., Normalized polynomial kernel (NP), Radial basis kernel (RBF), and Pearson VII Universal Kernel. It has been reported that the performace RSVM with Pearson VII Universal Kernel outperformed RSVM with other kernel functions [20]. Therefore, in this study, the Pearson VII Universal Kernel was applied as a kernel function for RSVM and is referred to as the Pearson Universal Kernel (PUK) (Eq. 1):
$f(x)=H /\left[1+\left(\frac{2\left(x-x_{o}\right) \sqrt{2^{\left(\frac{1}{\omega}\right)}-1}}{\sigma}\right)^{2}\right]^{\omega}$ (1)
This model is also known as the regression support vector machine.
The predicted monthly mean sea level (MMSL) (Najah et al.) can be expressed as:
MSLpredicted = (MSL + SST +Rainfall + MCC)obs (2)
The input dataset for the proposed model is sea surface temperature (SST), rainfall and mean cloud cover (MCC) for the period from January 2007 to December 2017.
The independent dataset with missing values was normalized using the common artificial intelligence model function.
$Z_{i}=\frac{y_{i}-y_{\min }}{y_{\max }-y_{\min }}$ (3)
where, Zi is the missing value after normalization, yi is the value before the missing value, ymax is the maximum value, and ymin is the minimum value.
The model structure has to be optimized in order to minimize the uncertainties from model misspecifications and to ensure the efficiency of the proposed model. In this study, the model performance of the proposed algorithm was assessed using root-mean-square error (RMSE), correlation coefficient (R) and scatter index (SI) [21].
$\mathrm{RMSE}=\sqrt{\frac{\sum_{i=1}^{n}\left(M S L_{p}-M S L_{0}\right)^{2}}{N}}$ (4)
$\mathrm{R}=\frac{\sum_{i=1}^{n}\left(M S L_{o}-\overline{M S L}_{o}\right)\left(M S L_{p}-\overline{M S L}_{p}\right)}{\sqrt{\sum_{i=1}^{n}\left(M S L_{o}-\overline{M S L}_{o}\right)^{2}} \sum_{i=1}^{n}\left(M S L_{p}-\overline{M S L}_{p}\right)^{2}}$ (5)
where, $M S L_{p}$ and $M S L_{o}$ are the predicted and the observed monthly mean sea levels, respectively; $\mathrm{N}$ is the number of the data, $\overline{M S L}_{p}$ and $\overline{M S L}_{o}$ are the mean values of the predicted and observed monthly mean sea levels, respectively and $\bar{x}$ is the mean of the number of data.
The cross-validation method is one of the adopted methods for evaluating model architecture parameter values after traning process is completed. Different v-fold numbers will be investigated in this study and as the stopping criteria to meet the desire model performance.
As an example, Figure 2 shows the flowchart of the developed support vector machine model.
The present study aims to evaluate the ability of the RSVM models to predict the monthly mean sea level (Eq. 2) for 1 year ahead in the three study areas in the ECPM. The results for the three study areas were then compared in order to predict the efficiency of the proposed model in real applications.
Table 1 shows that the best performance using performance indicators (Eq. 4 and 5) with the lowest error and highest correlation coefficient for the monthly mean sea level for all study areas. It can be seen that the accuracy of the proposed models is constant for all stations for both training and testing datasets.
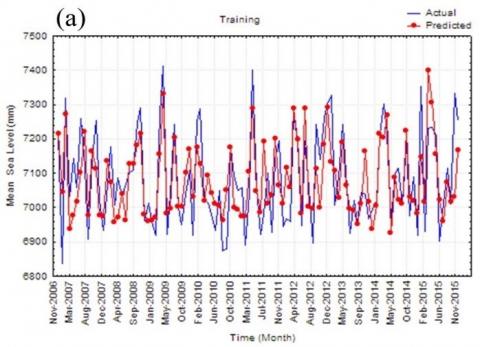
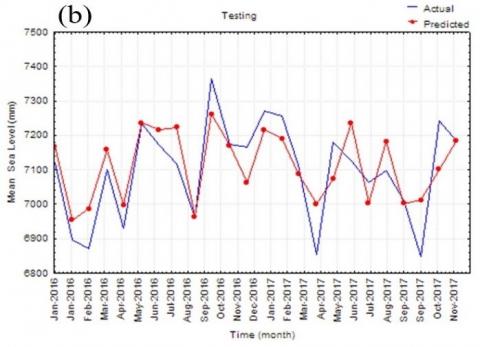
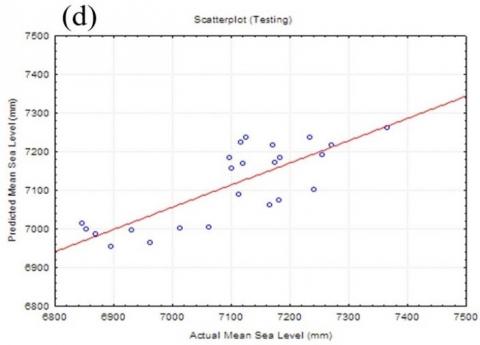
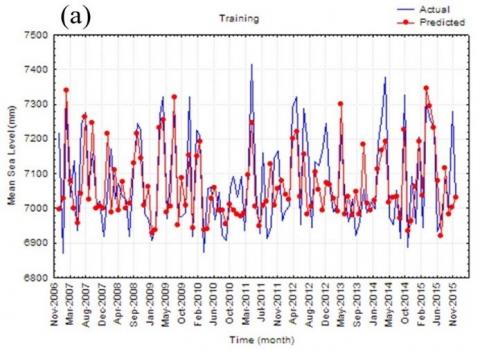
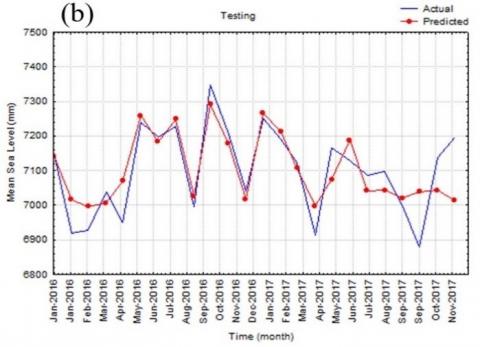
Figure 3 shows the model performance at Kerteh area with the 10 years data used to investigate the ability of the RSVM with PUK kernel functions to mimic the historical changes of mean sea level rise (MSLR). Similarly Figure 4 and Figure 5 present the performance of the proposed model during training and testing and scatter diagram for the other two stations; namely for Tanjung Sedili and Tioman Island.
As illustrated in Figures 5a and 5b, the results of 10 years ahead prediction at Tanjung Sedili region at ECPM, the predicted mean sea level in training and testing dataset were potential to simulate the trend of actual mean sea level graphs. The capability of the RSVM of PUK kernel functions shown the proficiency to satisfy the general behavior of the series.
In addition to that, it can be observed that the proposed model capable of capturing the extreme events for the three chosen stations which prove its superiority in dealing with non-linear cases.
The results of this study show that the effect of the kernel functions varies significantly and is contingent upon the dimensionality of the data set. The RSVM with PUK Kernel functions has shown the best model performance throughout this study. Model evaluation with optimal cross-validation of V-10 folds was obtained. During model training, sigma, σ, was determined by trial and error and was then used for the final prediction. It can be concluded that RSVM can be used to capture the non-linearity at sea level. The model proposed in this study has been proven to be one of the most suitable models for time series prediction [22-25].
Finally developed model then used to predict one year in advance the projected changes in sea level as shown in Table 2. The results showed that the 1 year ahead prediction horizon whereby the highest upper bound of predicted sea level (SL) was at Tanjung Sedili. However, it also showed that the lowest predicted lower bound of predicted SL at Tanjung Sedili. Kerteh is the second-highest for the upper and lower bound predicted SL, whereas Tioman Island was the least rise in 1 year ahead prediction horizon.
Figure 2. The flowchart of the developed model
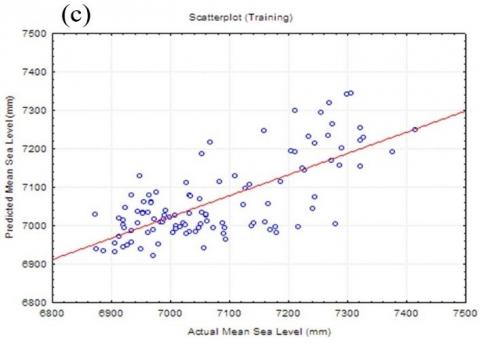
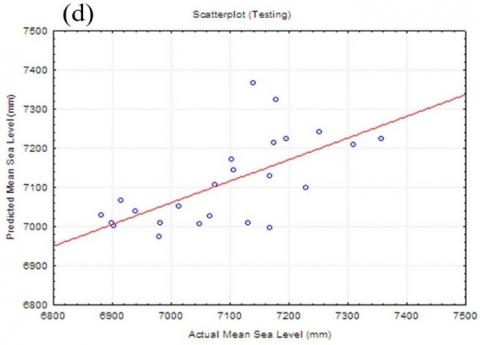
Figure 3. Actual vs. predicted MSLR for Kerteh. (a) training and (b) testing and scatter plots for (c) training and (d) testing
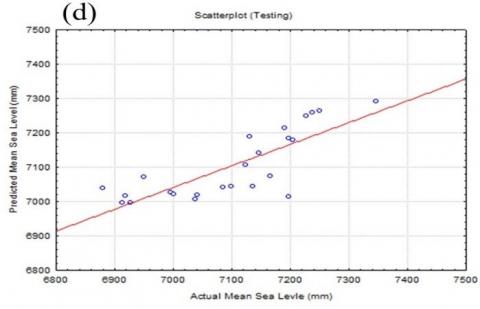
Figure 4. Actual vs. predicted MSLR for Tanjung Sedili. (a) training and (b) testing and scatter plots for (c) training and (d) testing
Figure 5. Actual vs. predicted MSLR for Tioman Island. (a) training and (b) testing and scatter plots for (c) training and (d) testing
Table 1. Statistical Parameters for the RSVM model with PUK Kernel for the three study areas
|
Location |
Training |
Testing |
||
|
RMSE (mm) |
R |
RMSE (mm) |
R |
|
|
Kerteh |
69.17 |
0.863 |
83.06 |
0.861 |
|
Tanjung Sedili |
77.10 |
0.815 |
73.43 |
0.825 |
|
Tioman Island |
72.83 |
0.820 |
70.34 |
0.857 |
Table 2. Upper and Lower Bound of Predicted SL at three study locations for 1 year ahead prediction horizon
|
Description |
1 Year Prediction Horizon |
||
|
Kerteh |
Tanjung Sedili |
Tioman Island |
|
|
Upper Bound of Predicted SL (mean, mm) |
7407 |
7306 |
7255 |
|
Lower Bound of Predicted SL (mean, mm) |
6938 |
6887 |
6911 |
This research aimed to develop Artificial Intelligence technique viz. Regression Support Vector Machine (RSVM) in order to simulate accurately Mean Sea Level Rise at three different crucial stations in Malaysian coastal. The results revealed that the proposed RSVM can be considered as a powerful algorithm in predicting the changes in the sea level. The hyper-parameters tuning technique such as V-fold introduced as stopping criteria and the optimal number found to be equal to 10. The selected meteorological parameters as input to the model have a profound influence on the accuracy of the proposed model.
It can be seen from the findings that the proposed model outperformed the conventional one and proved its capabilities in capturing the changes in the sea level of all three stations that been investigated in this study. High level of accuracy obtained at Kerteh and Tioman Island followed by Tanjung Sedili for both training and testing datasets. The finding of this study can be very significant in assessing the vulnerability of Tioman Island due to the changes in the rise of mean sea level. Future work can be conducted to validate the accuracy of the proposed model by using it in other countries and region.
Formal analysis, Samsuri Abdullah; Data Acquisition and Methodology, Ali Najah Ahmed; Supervision, Marlinda Abdul Malek; Writing – original draft, Vivian Lai; Writing – review & editing, Sarmad Dashti Latif.
The author declares that there is no conflict of interest regarding the publication of this manuscript. In addition, the ethical issues, including plagiarism, informed consent, misconduct, data fabrication and/or falsification, double publication and/or submission, and redundancy have been completely observed by the authors.
|
AI |
artificial intelligence |
|
ANN |
artificial neural network |
|
DSMM |
Department of Survey and Mapping Malaysia |
|
ECPM |
east coast Peninsular Malaysia |
|
GP |
genetic programming |
|
MCC |
mean cloud cover |
|
MMSL |
monthly mean sea level |
|
MSL |
mean sea level |
|
MSLR |
mean sea level rise |
|
PUK |
pearson Universal Kernel |
|
R |
correlation coefficient |
|
SI |
scatter index |
|
SL |
sea-level |
|
SST |
sea surface temperature |
|
SVM |
support vector machine |
|
RMSE |
root mean square error |
|
RSVM |
regression support vector machine |
[1] Jackson, L.P., Jevrejeva, S. (2016). A probabilistic approach to 21st century regional sea-level projections using rcp and high-end scenarios. Glob. Planet. Change, 146: 179-189. https://doi.org/10.1016/j.gloplacha.2016.10.006
[2] Ebrahimi, H., Rajaee, T. (2017). Simulation of groundwater level variations using wavelet combined with neural network, linear regression and support vector machine. Glob. Planet. Change, 148: 181-191. https://doi.org/10.1016/j.gloplacha.2016.11.014
[3] Aral, M.M., Guan, J. (2016). Global sea surface temperature and sea level rise estimation with optimal historical time lag data. Water (Switzerland), 8(11). https://doi.org/10.3390/w8110519
[4] Aral, M.M., Chang, B. (2017). Spatial variation of sea level rise at atlantic and mediterranean coastline of Europe. Water (Switzerland), 9(7). https://doi.org/10.3390/w9070522
[5] Huang, Y., Lan, Y., Thomson, S.J., Fang, A., Hoffmann, W.C., Lacey, R.E. (2010). Development of soft computing and applications in agricultural and biological engineering. Computers and Electronics in Agriculture, 71(2): 107-127. https://doi.org/10.1016/j.compag.2010.01.001
[6] Li, M., Li, Y., Leng, J. (2015). Power-type functions of prediction error of sea level time series. Entropy, 17(7): 4809-4837. https://doi.org/10.3390/e17074809
[7] Muslim, T.O., Ahmed, A.N., Malek, M.A., Abdulmohsin Afan, H., Khaleel Ibrahim, R., El-Shafie, A., Sapitang, M., Sherif, M., Sefelnasr, A., El-Shafie, A. (2020). Investigating the influence of meteorological parameters on the accuracy of sea-level prediction models in Sabah, Malaysia. Sustainability, 12(3): 1193. https://doi.org/10.3390/su12031193
[8] Chang, H.K., Lin, L.C. (2006). Multi-point tidal prediction using artificial neural network with tide-generating forces. Coast. Eng., 53(10): 857-864. https://doi.org/10.1016/j.coastaleng.2006.05.001
[9] Demuth, H., Beale, M., Hagan, M. (2008). Neural Network ToolboxTM 6. User’s Guide.
[10] Lai, V., Ahmed, A.N., Malek, M.A., Afan, H.A., Ibrahim, R.K., El-Shafie, A., El-Shafie, A. (2019). Modeling the nonlinearity of sea level oscillations in the malaysian coastal areas using machine learning algorithms. Sustain., 11(17): 4643. https://doi.org/10.3390/su11174643
[11] Vapnik, V.N. (2000). The Nature of Statistical Learning Theory. Springer New York.
[12] Asefa, T., Kemblowski, M., McKee, M., Khalil, A. (2006). Multi-time scale stream flow predictions: The support vector machines approach. J. Hydrol., 318: 1-4. https://doi.org/10.1016/j.jhydrol.2005.06.001
[13] Luu, Q.H., Tkalich, P., Tay, T.W. (2015). Sea level trend and variability around peninsular Malaysia. Ocean Sci., 11(4): 617-628. https://doi.org/10.5194/os-11-617-2015
[14] Günaydin, K. (2008). The estimation of monthly mean significant wave heights by using artificial neural network and regression methods. Ocean Eng., 35: 14-15. https://doi.org/10.1016/j.oceaneng.2008.07.008
[15] Li, D., Han, M., Wang, J. (2012). Chaotic time series prediction based on a novel robust echo state network. IEEE Trans. Neural Networks Learn. Syst., 23(5): 787-799. https://doi.org/10.1109/TNNLS.2012.2188414
[16] Zhao, P., Xing, L., Yu, J. (2009). Chaotic time series prediction: from one to another. Phys. Lett. Sect. A Gen. At. Solid State Phys., 373(25): 2174-2177. https://doi.org/10.1016/j.physleta.2009.04.033
[17] Chau, K.W., Wu, C.L., Li, Y.S. ( 2005). Comparison of several flood forecasting models in Yangtze River. J. Hydrol. Eng., 10(6). https://doi.org/10.1061/(ASCE)1084-0699(2005)10:6(485)
[18] Taormina, R., Chau, K.W., Sivakumar, B. (2015). Neural network river forecasting through baseflow separation and binary-coded swarm optimization. J. Hydrol., 529(3): 1788-1797. https://doi.org/10.1016/j.jhydrol.2015.08.008
[19] Najah, A., El-Shafie, A., Karim, O.A., El-Shafie, A.H. (2013). Application of artificial neural networks for water quality prediction. Neural Comput. Appl., 22: 187-201. https://doi.org/10.1007/s00521-012-0940-3
[20] Müller, K.R., Smola, A.J., Rätsch, G., Schölkopf, B., Kohlmorgen, J., Vapnik, V. (1997). Predicting time series with support vector machines. Lecture Notes in Computer Science. Springer Berlin Heidelberg 1997, pp. 999–1004. https://doi.org/10.1007/bfb0020283
[21] Imani, M., Kao, H.C., Lan, W.H., Kuo, C.Y. (2018). Daily sea level prediction at chiayi coast, taiwan using extreme learning machine and relevance vector machine. Glob. Planet. Change, 161: 211–221. https://doi.org/10.1016/j.gloplacha.2017.12.018
[22] Tripathi, S., Srinivas, V.V., Nanjundiah, R.S. (2006). Downscaling of precipitation for climate change scenarios: A support vector machine approach. J. Hydrol., 330: 3-4. https://doi.org/10.1016/j.jhydrol.2006.04.030
[23] Jiang, P., Li, R., Liu, N., Gao, Y. (2020). A novel composite electricity demand forecasting framework by data processing and optimized support vector machine. Applied Energy, 260: 114243. https://doi.org/10.1016/j.apenergy.2019.114243
[24] Lin, G.Q., Li, L.L., Tseng, M.L., Liu, H.M., Yuan, D.D., Tan, R.R. (2020). An improved moth-flame optimization algorithm for support vector machine prediction of photovoltaic power generation. Journal of Cleaner Production, 253: 119966. https://doi.org/10.1016/j.jclepro.2020.119966
[25] Li, L.L., Zhao, X., Tseng, M.L., Tan, R.R. (2020). Short-term wind power forecasting based on support vector machine with improved dragonfly algorithm. Journal of Cleaner Production, 242: 118447. https://doi.org/10.1016/j.jclepro.2019.118447