Dongling Liang | Qiang Fu | Yaowen Xu | Xinyan Shao | Ying Qi*
© 2020 IIETA. This article is published by IIETA and is licensed under the CC BY 4.0 license (http://creativecommons.org/licenses/by/4.0/).
OPEN ACCESS
Water conservation areas (WCAs), as an essential part of the ecosystem, are closely related to the sustainable development of socioeconomic system. To disclose the ecological and economical effects of the WCA, this paper clarifies the structure of the water resource-ecology-economy (ECC) system of the WCA, and sets up system dynamic models (SDMs) of the three subsystems under the ECC system. The dynamic evolution of the subsystems and the ECC system was simulated. Based on the feedbacks of the variables and objectives, the authors analyzed the internal correlations between water resource management, eco-environment, and economic development in the SDM, and predicted the trends of the three sub-systems. The proposed SDMs were proved valid through the analysis of a typical case. The analysis results show that the SDM should, relying on natural resources, reasonably grasp the functions of ecological regulation and market regulation, and correctly handle the relationship between ecological benefit and economic benefit.
water conservation areas (WCAs), water resources, ecology, economy, system dynamics model (SDM), dynamic evolution
In China, water resources are severely lacking and distributed unevenly in time and space. The water shortage has bottlenecked the development of both society and economy. Therefore, it is critical to optimize the water resource management, eco-environment construction, and socioeconomic growth model in water conservation areas (WCAs). According to principles of ecology and theories on market economy, the dynamic evolution between water resource system, ecological system, and economic system in WCAs could be analyzed by system dynamics method. A good understanding of the dynamic evolution enables decision-makers to prepare targeted polices and measures that ensure the effective use and sustainable development of water resources.
The research of the dynamic evolution between environmental subsystem, ecological subsystem, and economic subsystem in the same region can be traced back to the 1970s. In the early studies, models are constructed based on economic growth theories, and used to examine the coordinated development and elements of ecological subsystem and economic subsystem. Some scholars quantified the correlation between economy and environment, and some probed deep into the coordination between economic growth and eco-environment [1-6]. With the deepening of research, scholars Grossman et al. put forward the classic environmental Kuznets curve (EKC) model, and conducted empirical analysis based on panel data from developed countries [7-10]. The empirical results show that the urban economic level has an inverted U-shaped relationship with the quality of urban eco-environment. Since then, the EKC hypothesis has been applied extensively in many countries [11-15].
In recent years, the system dynamics model (SDM) has been increasingly applied to analyze and predict the interaction and dynamic evolution of elements within economic and social systems [16-22]. The SDM is a major tool to examine the dynamic complexity of systems. This model can effectively integrate individual systems, forming a new composite system, and vividly display the interaction between the elements in the composite system. For policy researchers, the information in the feedback loop of the SDM helps to visualize the expected effects of policy interventions. The right decisions could be made based on the dynamic changes of the system, which encompasses multiple correlated elements. With the aid of the SDM, many scholars have investigated the dynamic evolution of ecosystems, and presented policies on sustainable development [23-26].
Considering the actual conditions of the WCAs, this paper breaks down the water resource-ecology-economy (WEE) system of each WCA into three subsystems, namely, water resource subsystem, ecological subsystem, and economic subsystem, and sets up an SDM for each of the three sub-systems. Based on the feedbacks of variables and objectives, the internal relationships between the three subsystems were analyzed in details, and the future trends of them were predicted. Finally, the proposed models were proved valid through example analysis.
The remainder of this paper is organized as follows: Section 2 clarifies the structure of the WEE system in the WCA, and sets up the SDM for each of the three subs-systems; Section 3 verifies the proposed models through example analysis, and thoroughly discusses the analysis results; Section 4 puts forward the main conclusions.
Considering the actual conditions of the WCAs, the WEE system of the WCA was divided into three subsystems: water resource subsystem, ecological subsystem, and economic subsystem. Among them, the economic subsystem was further split into sub-subsystems like agriculture, industry, animal husbandry, forestry, and other characteristic industries (e.g. tourism), according to the different development goals in different regions.
Based on the feedbacks of variables and objectives, the internal relationships between water management, eco-environment, and economic growth in the WCA were analyzed, and the future trends of the three subsystems were predicted. The initial goal is to maximize the positive ecological effect, minimize the negative economic effect in the WCA, and the utmost goal is to gradually optimize the combined effect of ecology and economy in the region.
In the WEE system, the variable set includes object variables, state variables, control variables, and auxiliary variables. Relevant constants and functions were also covered in the system.
The object variables represent the objectives of the system, namely, agricultural income, forestry income, animal husbandry income, ecological benefit, and total economic income.
The state variables represent the states of the system, which are often cumulative in nature. Typical state variables are farmland area, grassland area, forest area, irrigable land area, dry land area, and livestock inventories.
The control variables are the measures taken to realize the objectives, such as livestock change rates, farmland area change rate, grassland area growth rate, forest area growth rate, polluting enterprise reduction rate, input growth rates, and water resource utilization coefficient.
The auxiliary variables were set to connect state variables with object variables. These variables often serve as the initial values of parameters in simulation.
The system structure and feedback mechanism of the WEE system are partly explained below.
2.1 Overall structure of the WEE system
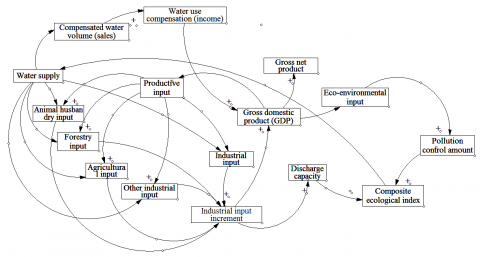
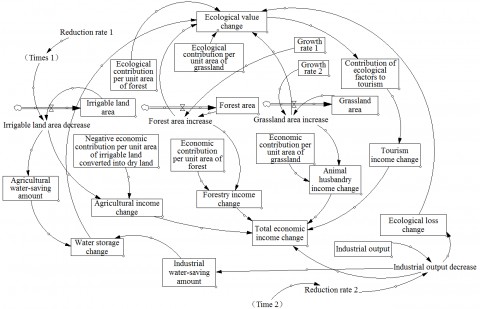
The WCAs are scattered across China, covering vastly different regions. In pursuit of ecological benefit, these regions have different starting points for economic growth. Therefore, the WEE system in each region was abstracted and simplified (Figure 1), creating an eco-economic development mode suitable for regional environment and resource conditions. Considering its unique role, water was distinguished from the other natural resource in the system.
As shown in Figure 1, the WEE system contains three major feedback loops. The first loop is the positive feedback loop between production capacity and cumulative output: gross product → productive input → industrial inputs → industrial input increment → gross product. The economic subsystem is solely involved in this loop.
Ecological benefit is considered in the other two feedback loops. One of them is a positive feedback loop: water supply → industrial inputs → industrial input increment → GDP → eco-environmental input → pollution control amount → composite ecological index → water supply. This feedback loop demonstrates the role of eco-environment in water resource conservation, revealing that the growth of environmental input will improve ecology and conserve more water resources; the rich water resources will in turn promote the development of various industries.
The other is a negative feedback loop between production capacity and eco-environment: water supply → industrial input → industrial input increment → discharge amount → composite ecological index → water supply. This feedback loop manifests that industrial input aggravates environmental pollution, exerting a negative effect on ecology. For simplicity, this feedback loop only takes account of the industrial impact on the environment.
Figure 1. The structure of the WEE system
2.2 Water resource subsystem
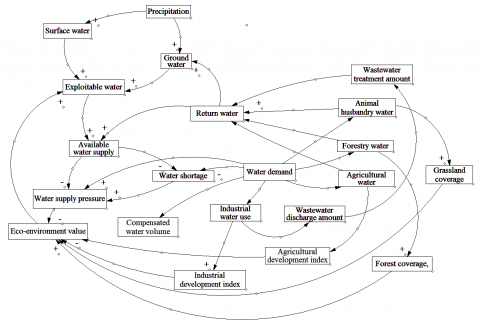
The water resource subsystem mainly describes the management of water supply and demand. The components of this subsystem include water resource development sub-subsystem, industrial water sub-subsystem, agricultural water sub-subsystem, forestry and animal husbandry water sub-subsystem, and sewage treatment sub-subsystem. The main feedback relationships in this subsystem are the positive effect of eco-environment on water resources, and the negative effect of economic growth on water resources. The structure of water resource subsystem is simplified as Figure 2.
2.3 Ecological subsystem
The ecological subsystem is linked up with economic subsystem and water resource subsystem through the changes in variables like forest area, grassland area, and water volume, and directly acts on the two subsystems. Here, the ecological subsystem is designed as a semi-closed ecological value assessment system, which mainly considers the variables related to ecological value evaluation. The estimation of ecological value helps to quantify the value of the entire WEE system. As shown in Figure 3, the ecological subsystem mainly involves the positive feedback relationship between forest, grassland, and water resources, and the negative feedback relationship between desertification, water resources, forest, and grassland.
2.4 Economic subsystem
Considering its special location and natural environment, the WCA should attach greater importance to ecological benefit than to economic benefit. Hence, this subsection mainly considers the development of forestry, animal husbandry, agriculture, and other industries (e.g. tourism) in the WCA. The structures of forestry sub-subsystem, animal husbandry sub-subsystem, and agricultural sub-subsystem are given below.
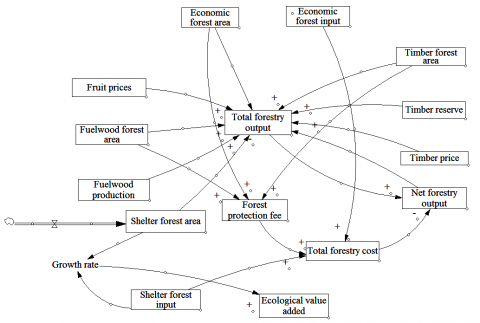
2.4.1 Forestry sub-subsystem
Both ecological value and economic income were considered in the forestry sub-subsystem. However, shelter forest was taken as the main type of forest, when evaluating the ecological value of forest sub-subsystem. In other words, the main concern is to maximize the planting area of shelter forest, without focusing on the area change of any other type of forest. This is because shelter forest contributes the greatest to regional ecological value in the forestry sub-subsystem. The most important indices of shelter forest are the planting areas of water conservation forest and windproof sand fixation forest. The structure of forestry sub-subsystem is shown in Figure 4.
2.4.2 Animal husbandry sub-subsystem
The WCAs generally boast abundant natural pastures, which create favorable conditions for the development of local animal husbandry. However, excess development of animal husbandry, especially the surge in the number of cattle and sheep, will greatly impede the growth of natural vegetation and severely damage grassland resources.
Figure 2. Water resource subsystem
Figure 3. Ecological subsystem
Figure 4. Forestry sub-subsystem
Figure 5. Animal husbandry sub-subsystem
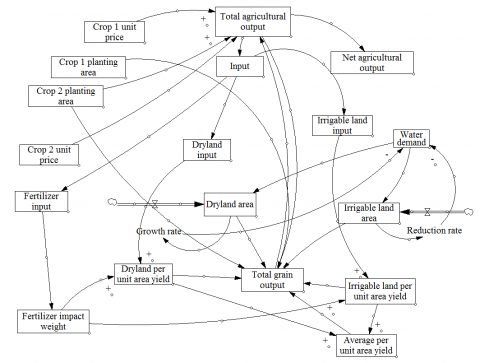
Figure 6. Agricultural sub-subsystem
Hence, the animal husbandry sub-subsystem mainly considers the impact of livestock on grassland ecosystem. For simplicity, only two kinds of livestock, namely, cattle and sheep, were selected to reflect the development trends of different kinds of livestock in the WCA. After all, it is necessary to increase the proportion of livestock species that have a limited damage on grassland, such as to realize the coordinated development of grassland growth and animal husbandry. The structure of the animal husbandry sub-subsystem is depicted in Figure 5.
2.4.3 Agricultural sub-subsystem
Agriculture takes up a large proportion of the economy in the WCA. In the 1990s, the proportion of agriculture was even greater than that of industry. During planting, irrigation is the largest consumer of water resources. Thus, the agricultural sub-subsystem must place water-saving in the first place, rather than purely pursue economic growth. At present, there are many policies controlling the irrigation water in the WCAs. The main control measure is to convert irrigable land into dry land. The conversion reduces the yield per unit area, causing a plunge of total agricultural output in the early phase. This factor was considered in the design of the structure of the agricultural sub-subsystem (Figure 6).
To verify its effectiveness, the proposed SDMs were applied to analyze a WCA in northeastern China. This WCA has a total of 71,825hm2 of farmland, and achieved a total agricultural output (excluding animal husbandry output) of RMB 770 million yuan. The conversion of irrigable land into dry land induces a loss RMB 500/mu, and saves 700m3 of water per mu. There are 328,687hm2 of forest land in the WCA, resulting in a total ecological value of RMB 709 million yuan. The WCA also has 491,000hm2 of grassland, with a total ecological value of RMB 8.32 million yuan. The total output of animal husbandry stood at RMB 1.21 billion yuan in 2016. The total industrial output of the WCA was RMB 7.5 billion yuan in 2016, decreasing at a rate of 10%. In addition, the tourism income of the region was RMB 120 million yuan in 2016.
The WEE system structure (Figure 7) in the WCA is derived based on the proposed SDMs. As shown in Figure 7, the water resource subsystem directly bears on the development of ecological subsystem and economic subsystem. The interactions between the subsystems and their elements are presented clearly in the structure of the WEE system. For example, the reduction in the area of irrigable land will suppress the agricultural output and water consumption; the increase in forest area and grassland area will enhance the forestry income, animal husbandry income, and ecological value; the growing ecological value will promote tourism and bring more tourism income.
The main variables of the SDMs include the change of total annual economic income, the change of annual ecological value, the change of tourism income, the change of agricultural income, the change of discharge amount, the change of ecological value, the change of water storage, water conservation per unit area of forest, and water conservation per unit area of grassland. Before the simulation, the initial values of some variables should be defined, including but not limited to industry incomes, forest area, grassland area, and ecological value.
Figure 7. Structure of the WEE system in the WCA
3.1 Variable settings
To initialize the variables, forest area, farmland area, grassland area, and industry outputs were selected according to the actual situation.
The ecological contribution per unit area of forest refers to the ecological value per hectare of forest land in the forestry sub-subsystem. This variable was calculated as RMB 2,157 yuan/hm2 by dividing the total ecological value with the forest area.
The economic contribution per unit area of forest refers to the economic value per hectare of forest land in the forestry sub-subsystem. This variable is the ratio of total forestry output to the forest area. Since the forest in the WCA is dominated by shelter forest, the variable could be neglected or set as an extremely small value. Here, this variable is set as RMB 100 yuan/hm2.
Similarly, the variables of the grassland sub-subsystem were initialized as follows:
The ecological contribution per unit area of grassland = the total ecological value / the grassland area = RMB 1,695 yuan/hm2;
The economic contribution per unit area of grassland = the total animal husbandry output / the grassland area = RMB 2,464 yuan/hm2.
The planting areas of forest and grassland were assumed to increase by 10% each year.
Moreover, it is assumed that 100,000mu of irrigable land is converted into dry land in 3 years. The negative economic contribution per unit area of irrigable land converted into dry land = 500 × 15 = RMB 7,500 yuan/hm2.
In the industrial sub-subsystem, the industrial output decreased sharply due to the closure of lots of water-consuming and high-pollution projects. During the simulation, it is assumed that these projects are closed in 5-7 years. The industrial output decrement could be set in advance or calculated based on relevant parameters.
3.2 Results analysis
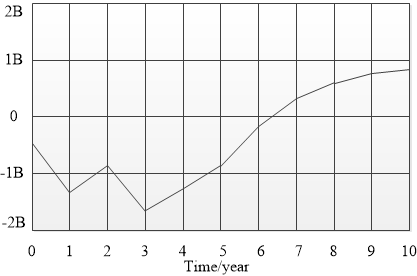
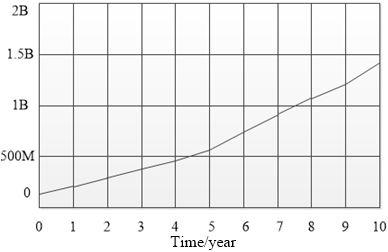
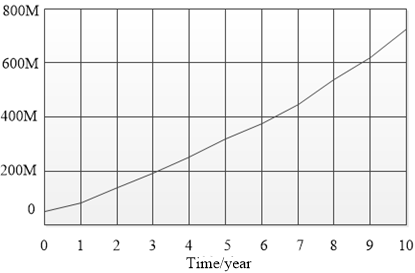
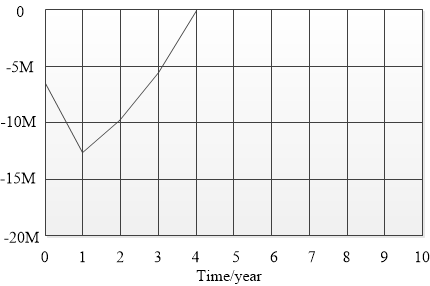
In the WCA, the industrial output had a marked decline due to the closure of lots of water-consuming and high-pollution projects. In the meantime, the agricultural income was severely affected by the conversion of irrigable land to dry land. The economic loss thus incurred could not be offset by the steady growth of tourism and animal husbandry. As shown in Figure 8, it takes about 6-7 years to fully eliminate these negative impacts. By contrast, the total ecological value of the WCA increased steadily, thanks to a series of ecological protection measures (Figure 9). The changes of tourism income and agricultural income are displayed in Figures 10 and 11, respectively.
Through the above analysis, the strategies for the WEE development of the WCA were put forward, in the light of the current situation in the region:
First, improve the regional eco-environment through multiple measures.
The possible measures include promoting ecological cultivation and management in agriculture, forestry, and animal husbandry, implementing ecological emigration, construct ecological communities, and building eco-parks in ecological function zones.
Second, transform the current economic pattern into ecological economy.
Relying on local natural resources, efforts should be made to control urbanization, adjust industrial structure, and lower resource consumption. Moreover, priority should be given to water resource conservation, and the development of ecological industries, aiming to steadily promote the efficiency of resource utilization.
Third, promote the rapid growth of ecological and market economy.
Guided by national preferential policies, the government should encourage industrial integration, adjust policy orientation, and transform its functions to suit the new economic growth mode.
Figure 8. Simulated change of economic income
Figure 9. Simulated change of ecological value
Figure 10. Simulated change of tourism income
Figure 11. Simulated change of agricultural income
Furthermore, the WCA must also sort out two relationships to promote ecological and market economy:
(1) Reasonably grasp the relationship between ecological regulation and market regulation.
Ecological regulation mainly depends on administrative and economic measures, while market regulation is grounded on market mechanism. The roles of the two regulation modes change from region to region. Ecological regulation is more effective than market regulation in regions with rich resources, good eco-environment, and limited pressure on sustainable development. On the contrary, market regulation is more effective than ecological regulation in regions with scarce resources, poor eco-environment, and huge pressure on sustainable development. The two regulation modes must be unified to serve to same goal: improving the living standard on the premise of ensuring the sustainability of regional nature, economy, society, and ecology.
(2) Correctly handle the relationship between ecological benefit and economic benefit.
To develop ecological and market economy, the WCA should strike a balance between the ecological benefit and economic benefit. It is unwise for the region to improve the eco-environment, without considering the economic benefit. This one-sided strategy will widen the regional income gap, and jeopardize social harmony. Moreover, ecological benefit and economic benefit interact and promote each other in the ecological and market economy. During the economic development, the WCA must balance the long-term ecological benefit with the short-term economic benefit. On the one hand, the eco-environment should be protected to maintain the sustainable development; on the other hand, the resources should be used more efficiently to create more economic benefit.
This paper firstly identifies the features of water resource management, eco-environmental protection, and socioeconomic development in the WCAs. Based on these features and the dynamic complexity of system evolution, the WEE system structure of the WCA was illustrated, and the SDMs were established for the three sub-systems of the WEE system. Next, the dynamics of the WEE system were simulated. The initial goal is to maximize the positive ecological effect, minimize the negative economic effect in the WCA, and the utmost goal is to optimize the combined effect of ecology and economy in the region. Next, the authors analyzed the internal correlations between water resources, eco-environment, and economy in the WCA, and predicted the trends of the three sub-systems based on the feedbacks of variables and objectives. Through case analysis, it is concluded that the WCA should, relying on natural resources, gradually transform the current economic pattern to ecological economy; the specific measures include reducing resource consumption, improving water resource conservation, and making efficient use of resources; efforts should also be made to reasonably grasp the functions of ecological regulation and market regulation, and correctly handle the relationship between ecological benefit and economic benefit.
[1] Solow, R.M. (1974). Intergenerational equity and exhaustible resources. The Review of Economic Studies, 41: 29-45. https://doi.org/10.2307/2296370
[2] Lu, C., Pang, M., Yang, J., Wang, D. (2018). Research on Interactions between the Economy and Environment in Tourism Development: Case of Qingyang, China. Sustainability, 10(11): 4033. https://doi.org/10.3390/su10114033
[3] Weidema, B.P., Schmidt, J., Fantke, P., Pauliuk, S. (2018). On the boundary between economy and environment in life cycle assessment. The International Journal of Life Cycle Assessment, 23(9): 1839-1846. https://doi.org/10.1007/s11367-017-1398-4
[4] Ruiz-Real, J.L., Uribe-Toril, J., De Pablo Valenciano, J., Gázquez-Abad, J.C. (2018). Worldwide research on circular economy and environment: A bibliometric analysis. International Journal of Environmental Research and Public Health, 15(12): 2699. ttps://doi.org/10.3390/ijerph15122699
[5] Shen, L., Huang, Y., Huang, Z., Lou, Y., Ye, G., Wong, S.W. (2018). Improved coupling analysis on the coordination between socio-economy and carbon emission. Ecological Indicators, 94: 357-366. https://doi.org/10.1016/j.ecolind.2018.06.068
[6] Yuan, B., Ren, S., Chen, X. (2017). Can environmental regulation promote the coordinated development of economy and environment in China’s manufacturing industry? A panel data analysis of 28 sub-sectors. Journal of Cleaner Production, 149: 11-24. https://doi.org/10.1016/j.jclepro.2017.02.065
[7] Grossman, G.M., Krueger, A.B. (1995). Economic growth and the environment. The Quarterly Journal of Economics, 110(2): 353-377. https://doi.org/10.2307/2118443
[8] Li, F., Dong, S., Li, F., Yang, L. (2016). Is there an inverted U-shaped curve? Empirical analysis of the environmental Kuznets curve in agrochemicals. Frontiers of Environmental Science & Engineering, 10(2): 276-287. https://doi.org/10.1007/s11783-014-0700-y
[9] Dinda, S. (2004). Environmental Kuznets curve hypothesis: A survey. Ecological Economics, 49(4): 431-455. https://doi.org/10.1016/j.ecolecon.2004.02.011
[10] Galeotti, M., Lanza, A., Pauli, F. (2006). Reassessing the environmental Kuznets curve for CO2 emissions: A robustness exercise. Ecological Economics, 57(1): 152-163. https://doi.org/10.1016/j.ecolecon.2005.03.031
[11] Li, F. (2019). An approach to economic growth and environment effects in Northeast Asia. In IOP Conference Series: Earth and Environmental Science, 381(1): 012056. http://dx.doi.org/10.1088/1755-1315/381/1/012056
[12] Copeland, B.R., Taylor, M.S. (2004). Trade, growth, and the environment. Journal of Economic Literature, 42(1): 7-71. https://doi.org/10.1257/002205104773558047
[13] Benedek, Z., Fertő, I. (2020). Does economic growth influence forestry trends? An environmental Kuznets curve approach based on a composite Forest Recovery Index. Ecological Indicators, 112: 106067. https://doi.org/10.1016/j.ecolind.2020.106067
[14] Rönnbäck, K., Granér, S. (2016). Historicizing the environmental Kuznets Curve: water pollution in Göta Älv, Sweden, 1895-2000. Water History, 8(2): 95-114. https://doi.org/10.1007/s12685-016-0157-y
[15] Xue, B., Zhang, Z.L., Guo, X.J. (2010). A study on the coupling relationships between regional economic growth and environmental pressure: Case of Ningxia Autonomous Region. Ecology and Environmental Sciences, 19(5): 1125-1131. https://doi.org/10.3969/j.issn.1674-5906.2010.05.024
[16] Tan, Y., Jiao, L., Shuai, C., Shen, L. (2018). A system dynamics model for simulating urban sustainability performance: A China case study. Journal of Cleaner Production, 199: 1107-1115. https://doi.org/10.1016/j.jclepro.2018.07.154
[17] Fang, W., An, H., Li, H., Gao, X., Sun, X., Zhong, W. (2017). Accessing on the sustainability of urban ecological-economic systems by means of a coupled energy and system dynamics model: A case study of Beijing. Energy Policy, 100: 326-337. https://doi.org/10.1016/j.enpol.2016.09.044
[18] Evrendilek, F., Wali, M.K. (2001). Modelling long-term C dynamics in croplands in the context of climate change: a case study from Ohio. Environmental Modelling & Software, 16(4): 361-375. https://doi.org/10.1016/S1364-8152(00)00089-X
[19] Sun, Y.F., Guo, H.C., Qu, G.Y. (2002). A system dynamics approach for sustainable development in the Miyun reservoir area, China. Chinese Geographical Science, 12(2): 157-165. https://doi.org/10.1007/s11769-002-0025-9
[20] Sun, Y., Liu, N., Shang, J., Zhang, J. (2017). Sustainable utilization of water resources in China: A system dynamics model. Journal of Cleaner Production, 142: 613-625. https://doi.org/10.1016/j.jclepro.2016.07.110
[21] Nguyen, T., Cook, S., Ireland, V. (2017). Application of system dynamics to evaluate the social and economic benefits of infrastructure projects. Systems, 5(2): 29. https://doi.org/10.3390/systems5020029
[22] Arquitt, S., Johnstone, R. (2008). Use of system dynamics modelling in design of an environmental restoration banking institution. Ecological Economics, 65(1): 63-75. https://doi.org/10.1016/j.ecolecon.2007.05.013
[23] You, S., Kim, M., Lee, J., Chon, J. (2018). Coastal landscape planning for improving the value of ecosystem services in coastal areas: Using system dynamics model. Environmental Pollution, 242: 2040-2050. https://doi.org/10.1016/j.envpol.2018.06.082
[24] Scolozzi, R., Schirpke, U., Geneletti, D. (2019). Enhancing ecosystem services management in protected areas through participatory system dynamics modelling. Landscape Online, 73: 1-17. https://doi.org/10.3097/LO.201973
[25] Kotir, J.H., Smith, C., Brown, G., Marshall, N., Johnstone, R. (2016). A system dynamics simulation model for sustainable water resources management and agricultural development in the Volta River Basin, Ghana. Science of the Total Environment, 573: 444-457. https://doi.org/10.1016/j.scitotenv.2016.08.081
[26] Yang, J., Lei, K., Khu, S., Meng, W., Qiao, F. (2015). Assessment of water environmental carrying capacity for sustainable development using a coupled system dynamics approach applied to the Tieling of the Liao River Basin, China. Environmental Earth Sciences, 73(9): 5173-5183. https://doi.org/10.1007/s12665-015-4230-0