Zhen Zhu | Yunfeng Zheng*
© 2020 IIETA. This article is published by IIETA and is licensed under the CC BY 4.0 license (http://creativecommons.org/licenses/by/4.0/).
OPEN ACCESS
Currently, the food consumption of Chinese urban residents is characterized by the huge number of consumers, multiple levels of consumption, fast changing consumption mode and clearly defined consumer orientation. In light of these, this paper introduces the concept and variables (e.g. the age structure) of adult equivalent scales method to the food consumption function, establishes a model to estimate the effects of demographic factors, and applies the model to predict the impacts of household income, family structure and other factors on food expenditure. The research results show that the food consumption of Chinese urban households is greatly affected by household disposable income and the family structure.
population structure, adult equivalent scales, food consumption, urban residents
Over the past three decades, the sustained rapid growth of the Chinese economy has bolstered the per-capita income and food consumption of urban residents in China. From 1990 to 2014, the per-capita food expenditure of Chinese urban households grew all the way from RMB 693.8 yuan to RMB 4,493.9 yuan, at an annual rate of 8.1%. Currently, the food consumption of Chinese urban residents is characterized by the huge number of consumers, multiple levels of consumption, fast changing consumption mode and clearly defined consumer orientation.
The growing trend of food expenditure is in sync with the expansion of urban population. In 2014, the total number of rural migrant workers, who have limited spending power, in Chinese cities reached the staggering figure of 274 million [1]. The influx of these special urban residents increases the heterogeneity of urban residents in food consumption, which in turn affects the development of the food industry [2]. To ensure food safety, it is meaningful to examine the influencing factors of food expenditure and identify the pattern of food consumption among urban residents.
The existing studies on these influencing factors mainly focus on such factors as income and family structure [3]. Following is a brief review of the representative research on the effect of income on the food expenditure of urban residents. Based on the urban household survey data of eastern China’s Jiangsu Province, Zheng and Henneberry [4] discovers that the income elasticity of demand of low-income groups is high for poultry meat (0.474) and low for grains (0.139), and that of middle- and high-income groups is high for aquatic products and low for edible oil. Referring to the China City Statistical Yearbook, Dong and Hu [5] found that low-income households have a weak income elasticity of demand (2.27) for milk, although the income elasticity of demand for edible oil, eggs and vegetables is less than one in all income groups. Using the data of urban household surveys, Han and Chen [6] explored the effects of income on food consumption of rural migrant workers, revealing that the income elasticity of demand is flexible for livestock products (1.081) and high for edible oil (0.787). To sum up, the income elasticity of demand of different income groups varies with the types of data and research models.
With the continuous demographic transition (e.g. population ageing and low birth rate) in urban areas, single-child families now take up a good proportion in China’s urban households [7, 8]. The effect of family structure, including the gender and age of family members in different age groups, on food expenditure of urban residents has attracted much attention. For instance, Gould [9] designs variables that characterize the age structure of urban families by adult equivalent scales method, and analyzes the impact of the age structure on the food expenditure of Chinese urban residents. In fact, the adult equivalent scales have been widely adopted to study the relationship between age structure and food consumption [10-13]. However, the relevant studies have two problems. For one thing, the population is generally divided based on life development into children, adults and the elderlies, which cannot fully reflect the variation in food consumption between different ages. For another, the children-adults consumption coefficient and elderlies-adults consumption coefficient are hypothetical.
Considering the growth in per-capita income, the shift in food consumption pattern and the constant changes of population structure, this paper sets up an adult equivalent scales model according to the actual data on urban household consumption and the unique features of China’s population growth, explores the influencing factors of food expenditure among urban residents, and carries out microscale data analysis on the relationship between income, population structure and food consumption.
Based on the food consumption data released by National Bureau of Statistics of China, this section analyzes the changes in food consumption of Chinese urban residents, laying the basis for subsequent empirical analysis.
Over the years, the total food consumption in China has grown continuously, but at a decreasing growth rate. The structure of food consumption also undergoes constant changes, marking an era of transformation and upgrading. Since 2000, the food expenditure of Chinese urban residents has increased rapidly, while the proportion of food expenditure to total consumption expenditure first declined and then stabilized. Compared with the past, Chinese urban residents now attach importance to food quality, enjoy convenient access to food products, and boast a great potential of food consumption. These changes are mainly induced by two factors: the urban residents earn more money thanks to economic growth; the fast urbanization has brought a huge influx of migrants to cities.
2.1 Per-capita food expenditure
To begin with, the per-capita food expenditure and Engel coefficient of urban and rural residents were compared in details. As shown in Table 1, the gap between Chinese urban and rural residents in food expenditure has been widened continuously. From 2000 to 2016, the per-capita food expenditure of Chinese urban residents increased from RMB 1,958.3 yuan to RMB 6,762.4 yuan, putting the mean annual rate at RMB 300.3 yuan. Meanwhile, the per-capita food expenditure of Chinese rural residents only grew at a mean annual rate of RMB 152.85 yuan from RMB 820.5 yuan to RMB 3,266.1 yuan.
The significant growth in food consumption of urban residents is accompanied by the deep plunge of Engel coefficient across the country, that is, the improvement of living standards. From 2000 to 2012, the Engel coefficient dropped by 9.88% from 39.18% to 29.3% for urban residents, and by 16.89% from 49.13% to 32.24% for rural residents. Obviously, urban residents have a lower Engel coefficient than their rural counterparts, but the gap is gradually narrowing.
Table 1. Per-capita food expenditure and Engel coefficient of urban and rural residents
|
Years |
Urban residents |
Rural residents |
The gap between urban and rural food consumption |
||
|
Per capita food consumption expenditure |
Engel's Coefficient |
Per capita food consumption expenditure |
Engel's Coefficient |
||
|
2000 |
1947.31 |
39.22 |
820.52 |
49.13 |
1137.79 |
|
2005 |
2926.39 |
36.68 |
1162.16 |
45.48 |
1752.23 |
|
2010 |
4812.71 |
35.67 |
1800.67 |
41.09 |
3004.04 |
|
2011 |
5523.34 |
36.32 |
2107.34 |
40.36 |
3398.99 |
|
2012 |
6060.85 |
36.23 |
2323.89 |
39.33 |
3716.96 |
|
2013 |
5576.88 |
30.13 |
2495.50 |
37.67 |
3075.20 |
|
2014 |
6011.01 |
30.05 |
2814.00 |
33.57 |
3186.00 |
|
2015 |
6334.70 |
29.73 |
3048.00 |
33.05 |
3311.70 |
|
2016 |
6756.41 |
29.30 |
3266.10 |
32.24 |
3496.30 |
2.2 Food categories
The categories of food (e.g. animal food and plant food) consumed by Chinese urban and rural residents are listed in Table 2 below. From which, it can be seen that the per-capita food consumption of urban residents has remained largely stable, while the proportion of animal and plant food being consumed has changed. In 2016, urban residents on average consumed 343.8kg of food, basically the same as the 340.9kg in 2003. From 2000 to 2016, the per-capita consumption of plant food among urban residents remained basically the same, despite a slight growth from 262.7kg to 266.9kg. As for animal food, the per-capita consumption of urban residents grew rapidly from 58.2kg in 2000 to 76.1kg in 2003 and then slowly reached 76.9kg in 2016.
For rural residents, the total food consumption and plant food consumption has both declined, while the consumption of animal food exhibited an upward trend. Specifically, the total food consumption of rural residents dropped from 407.7kg in 2000 to 332.9kg in 2016. In the same period, the per-capita consumptions of animal food and plant food among rural residents respectively increased from 27kg to 51.2kg, and decreased from 380.7kg to 281.7kg.
For urban residents, the share of animal food in the consumption structure has been steadily expanding. In 1981, the urban residents on average consumed 37.1kg of animal food, accounting for 10.28% of all food products being consumed. The proportion was widened to 15.45% in 1993, 22.32% in 2013 and 22.37% in 2016.
Table 2. The categories of food consumed by Chinese urban and rural residents
|
Years |
Main food consumption (kg) |
The proportion of animal food |
The proportion of plant food |
|||
|
Urban residents |
Rural residents |
Urban residents |
Rural residents |
Urban residents |
Rural residents |
|
|
2000 |
320.9 |
407.7 |
18.14 |
6.62 |
81.86 |
93.38 |
|
2005 |
335.4 |
366.4 |
22.00 |
9.06 |
78.00 |
90.94 |
|
2010 |
334.5 |
333.7 |
22.09 |
10.16 |
77.91 |
89.84 |
|
2011 |
330.2 |
324.8 |
22.29 |
11.33 |
77.71 |
88.67 |
|
2012 |
331.7 |
316.1 |
22.73 |
11.83 |
77.27 |
88.17 |
|
2013 |
341.1 |
342.9 |
21.20 |
13.44 |
78.80 |
86.56 |
|
2014 |
340.9 |
332.8 |
22.18 |
14.36 |
77.82 |
85.64 |
|
2015 |
338.7 |
329.5 |
22.53 |
15.20 |
77.47 |
84.80 |
|
2016 |
343.8 |
332.9 |
22.37 |
15.38 |
77.63 |
84.62 |
2.3 Consumption of animal products
(1) Consumption of meat products
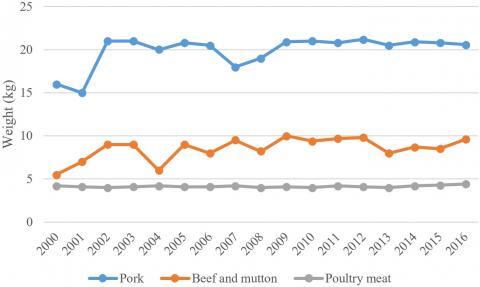
Figure 1 shows the per-capita consumption of different meat products among Chinese urban residents.
As shown in Figure 1, pork is the most popular meat product among Chinese urban residents, followed by poultry meat, and beef and mutton. More and more pork has been consumed over the years. On average, each urban resident consumed 16.9kg of pork in 1981, 17.7kg in 1992 and 20.4kg in 2016. Now, pork products contribute half of the total meat consumption. However, the share of pork in the total amount of meat being consumed has been shrinking from 82.44% in 1981, 66.79% in 1992 and 58.45% in 2016.
For urban residents, both the consumption of poultry meat and its proportion to the total consumption of meat have been increasing. The annual consumption of poultry meat per urban resident was merely 1.9kg in 1981, taking up 9.27% of all meat products being consumed. In 1992, each urban resident consumed 5.1kg of poultry meat. By 2016, the annual consumption has grown to 10.2kg, and its proportion to the total consumption of meat to 29.23%.
The consumption of beef and mutton remains low among Chinese urban residents, taking up about 10% of the total meat consumption. The per-capita consumption has been growing rather slowly, from 3.3kg in 2000 to 4.3kg in 2016.
(2) Consumption of other animal products
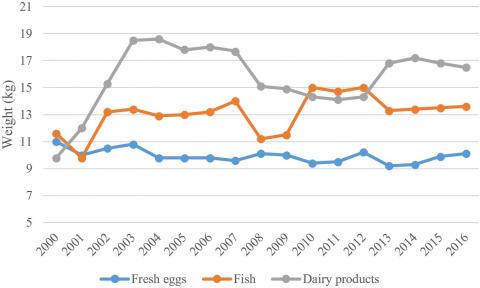
Figure 2 shows the per-capita consumption of other animal products (e.g. eggs, fish and dairy products) among Chinese urban residents.
Figure 1. Per-capita consumption of different meat products among Chinese urban residents
Figure 2. Per-capita consumption of other animal products among Chinese urban residents
As shown in Figure 2, the development of dairy products consumption can be divided into four phases for Chinese urban residents. The annual per-capita consumption grew rapidly from 4.8kg in 1996 to 19.6kg in 2003, remained stable between 17kg and 19kg from 2003 to 2007, decreased from 17.8kg in 2007 to 13.7kg in 2011 due to the melamine incident, and rebounded thereafter to 17.1kg in 2016.
For Chinese urban residents, the annual mean consumption of fish increased all the way to 14.8kg in 2016, and that of fresh eggs grew from 5.1kg in 1981 to 11.1kg in 1997 and remained at about 10kg ever since.
2.4 Consumption of plant products
The per-capita consumption of plant products among Chinese urban residents is illustrated in Figure 3 below. Note that the term “Grains” also covers beans and potatoes after 2012, due to a revision by the National Bureau of Statistics in 2013.
In general, the annual plant food consumption per urban resident has remained basically stable. From 1993 to 2016, the per-capita plant food consumption increased slightly from 264.4kg to 266.9kg. In the same period, the proportion of plant food consumption in total food consumption dropped from 84.55% to 77.63%. Obviously, plant food continuous to dominate the food consumption of Chinese urban residents.
On the categories of plant food, great changes have taken place in the consumption of grains, fresh vegetables and fresh melons since the reform and opening-up in 1978. The annual consumption of grains per urban resident decreased by nearly half from 145.4kg in 1981 to 79.7kg in 2001, and remained stable around 80kg from 2002 to 2012. The annual consumption of fresh vegetables per urban resident dropped from 152.3kg in 1981 to 116.5kg in 1995, and remained stable ever since. The annual consumption of fresh melons per urban resident was stabilized after increasing from 21.2kg in 1981 to 57.5kg in 2000. The per-capita consumption of edible oils remained at a low level, growing from 8.2kg in 2000 to10.6kg in 2016.
Figure 3. The per-capita consumption of plant products among Chinese urban residents
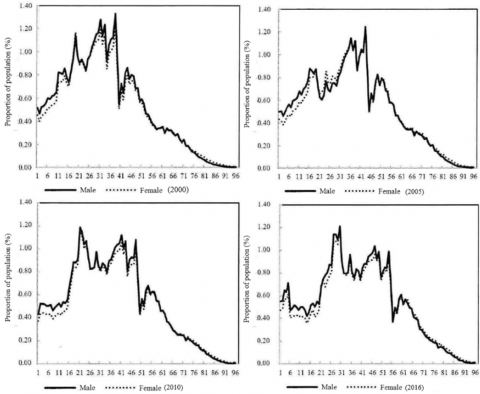
Figure 4 describes the variation in the number of Chinese urban residents of each gender and in different age groups from 2000 to 2016.
Figure 4. Gender and age structure of Chinese urban population in 2000~2016
Obviously, aging and low birth rate have been the two dominant features of Chinese urban population since 2000. The proportion of urban residents aged 0~14 has dropped from 18.42% in 2000 to 14.68% in 2016, while that of those aged above 65 has rose from 6.42% in 2000 to 8.49% in 2005, surpassing the threshold for an ageing society, and further to 9.6% in 2016.
Tables 3 and 4 respectively display the dependency ratio and sex ratio of Chinese urban population in different age groups. Note that the dependency ratio refers to the age-population ratio of those typically not in the labor force (the dependent part) and those typically in the labor force (the productive part), while the sex ratio means the ratio of males to females in a population.
It can be seen that the proportion of urban working population fluctuated constantly from the level of 75.16% in 2000, and eventually returned to 75.72%, thanks to the influx of numerous rural laborers. On the sex ratio, the proportion of females in urban residents increases with age. This could be attributed to the fact that males have more abnormal deaths while females enjoy a longer life expectancy. In the age group 0~14, the sex ratio of urban population remained above 100 in 2000~2016, indicating that there are more males than females aged 0~14. In the same period, the sex ratio was about 104 for urban residents between 15~64. The sex ratio of those over 65 was always below 100: 91.61 in 2000 and 90.44 in 2016.
The changes in urban population structure are mainly the result of the growth in life expectancy and the decline in fertility rate. On the one hand, the life expectancy of China’s population has been growing steadily with the improving living and medical standards. According to the National Bureau of Statistics, the mean life expectancy of China’s population increased from 71.4 in 2000 to 76.34 in 2015. The growth in mean life expectancy of males (69.63~73.64) is smaller than that of females (73.33~79.64). On the other hand, the China’s population growth is characterized by low birth rate, low mortality rate and low natural growth rate. Since 2001, the birth rate remained below 13%, and the mortality rate stayed at around 7%, leading to a relatively low fertility rate.
More complex changes are expected for Chinese urban population under the combined effects of the existing family planning policies and the newly introduced second-child policy. All these changes will have an impact on food consumption and safety among the urban residents (Table 5).
Table 3. Variation in the dependency ratio of Chinese urban population in different age groups
|
Years |
Total population |
0-14 years old |
15-64 years old |
65 years old or older |
The proportion of elderly people to children |
Ratio of children being raised |
Ratio of elderly people being raised |
|||
|
Population |
ratio |
Population |
ratio |
Population |
ratio |
|||||
|
2000 |
45906 |
8456 |
18.42 |
34501 |
75.16 |
2948 |
6.42 |
34.87 |
24.51 |
8.55 |
|
2005 |
56212 |
9333 |
16.60 |
42107 |
74.91 |
4772 |
8.49 |
51.13 |
55.16 |
44.33 |
|
2010 |
66978 |
9428 |
14.08 |
52327 |
78.12 |
5224 |
7.80 |
55.41 |
18.02 |
9.98 |
|
2016 |
79298 |
11640 |
14.68 |
60047 |
75.72 |
7611 |
9.60 |
65.39 |
19.38 |
12.68 |
Table 4. Variation in the sex ratio of Chinese urban population in different age groups
|
Years |
0-14 years old |
15-64 years old |
65 years old or older |
||||||
|
Male |
Female |
Sex ratio |
Male |
Female |
Sex ratio |
Male |
Female |
Sex ratio |
|
|
2000 |
4481.24 |
3975.08 |
112.73 |
17650.39 |
16850.91 |
104.74 |
1409.66 |
1538.72 |
91.61 |
|
2005 |
5020.34 |
4312.52 |
116.41 |
20916.66 |
21190.71 |
98.71 |
2272.62 |
2499.10 |
90.94 |
|
2010 |
5097.83 |
4329.96 |
117.73 |
26683.98 |
25642.56 |
104.06 |
2510.72 |
2712.94 |
92.55 |
|
2016 |
6267.55 |
5372.37 |
116.66 |
30718.97 |
29327.67 |
104.74 |
3614.61 |
3996.83 |
90.44 |
Table 5. Birth rate, mortality rate and natural growth rate of china’s population
|
Index |
Birth rate (‰) |
Mortality rate (‰) |
Natural growth rate (‰) |
|
2000 |
14.03 |
6.45 |
7.58 |
|
2003 |
12.41 |
6.40 |
6.01 |
|
2006 |
12.09 |
6.81 |
5.28 |
|
2009 |
11.95 |
7.08 |
4.87 |
|
2012 |
12.10 |
7.15 |
4.95 |
|
2015 |
12.07 |
7.11 |
4.96 |
|
2016 |
12.95 |
7.09 |
5.86 |
4.1 Conceptual framework and model setting
The food expenditure of each urban household can be expressed as:
E=f(Y,P,D,Z)+u (1)
where, E is the household food expenditure; Y is the household income; P is the price index of various food products; D is the family structure variable; Z is the other influencing factors (i.e. residence, family education level, the number of family members working in state-owned enterprises, the size of the local city, and the region variable) on household food consumption; u is a random error term. The food expenditure function can be rewritten as:
lnE=β0+β1lnI+β2(lnI)2+β3lnP+β4FAES+β5Z+μ (2)
where, FAES is the age structure index of each household; β0,…, β5are unknown parameters. The meaning of the other parameters is the same as that in Eq. (1). Eq. (2) can be solved by the least squares method. The FAES can be expressed as:
FAES=c1×VA+c2×VB+c3×VC+c4×VD+c5×VE+c6×VF+c7×VG+c8×VH+c9×VI+e11×VJ+e21×VK+e31×VL+e41×VM+e12×VN+e22×VO+e32×VP+e42×VQ
where, VA, VB…, VQ are family structure variables about the number and age of family members. In each family, males between 35 and 40 were taken as the standard members and assigned the adult equivalent value of 1, i.e. VC c3=1. Then, each of the other family members was converted to standard members, and assigned a corresponding adult equivalent value. This method is called the adult equivalent scales method (Model 1).
4.2 Data analysis
Our research uses the 2009 urban household survey data released by the National Bureau of Statistics [14-16]. Six provincial administrative regions (hereinafter referred to as provinces), namely, Hebei, Guangdong, Henan, Jilin, Sichuan and Xinjiang, were selected to represent the northern, southern, central, north-eastern, southwestern and northwestern regions of China, respectively. In total, 10,462 urban households were randomly selected from these provinces, including 1,935 from Hebei, 2,371 from Guangdong, 1,602 from Henan, 1,222 from Jilin, 2,246 from Sichuan, and 1,086 from Xinjiang.
All these households meet the definition of “urban households” in Chinese laws and regulations: non-agricultural households with permanent residence in urban districts or neighborhood committees. Here, the samples also cover the agricultural households with permanent residence in these areas, as well as the agricultural or non-agricultural households without permanent residence but having lived in urban districts or neighborhood committees for more than half a year.
In general, 15.3% of the sample households are from Henan, 18.5% from Hebei, 11.7% from Jilin, 22.7% from Guangdong, 21.5% from Sichuan and 10.4% from Xinjiang. The proportion of each province is above 10%, an evidence for the rationality of sample selection. For comparison, Xinjiang was taken as the reference province in our research.
The food products consumed by urban households were divided into ten main categories: cereals (rice and flour), edible oils (animal oil and vegetable oil), meat (pork, beef, mutton, other meats and meat products), poultry meat (chicken, duck meat, other poultry meats and poultry meat products), eggs (fresh eggs and egg products), aquatic products (fish and shrimp), dairy products (fresh dairy products, milk powder, yogurt and other dairy products), vegetables (fresh vegetables, dried vegetables and vegetable products), fruits (fresh fruits, fresh melons, dried fruits and dried melons), grains (starch, potato, dried beans and pastries).
4.2.1 Expenditure on each food type
Table 6 shows the per-capita food expenditure of the sample households in 2009. It can be observed that the urban households in Guangdong on average spent the most (RMB 9,755.37 yuan) on food products, while those in Henan spent the least (RMB 45,896.695 yuan). The expenditures of urban households in different provinces were compared on each type of food.
The urban households in Guangdong on average spent RMB 1,248.980 yuan on cereals, more than those in any other province, while those in Hebei spent RMB 790.532 yuan on cereals, fewer than those in any other province. The urban households in Guangdong also dwarfed those in other provinces in the per-capita expenditure on meat, poultry meat, aquatic products, vegetables, fruits and grains. Specifically, the meat expenditure of Guangdong urban households was RMB 3,412.079 yuan, RMB 920.926 yuan higher than that of the second-ranking Sichuan urban households; the poultry meat expenditure of Guangdong urban households was RMB 1,486.778 yuan, RMB 739.724 yuan higher than that of the second-ranking Sichuan urban households; the aquatic products expenditure of Guangdong urban households was RMB 1,680.986 yuan, RMB 1,192.759 yuan higher than that of the second-ranking Hebei urban households.
On edible oils, Sichuan and Jilin were respectively at the top and bottom in the ranking of expenditure per urban resident. The per-capita expenditure of Sichuan urban households stood at RMB 4,87546 yuan, while that of Jilin urban households was only RMB 302.085 yuan. On eggs, Hebei urban households spent an average of RMB 302.085 yuan, more than that of urban households in any other province.
Table 6. Urban household expenditure on different types of food
|
Food |
Total sample |
Hebei |
Jilin |
Henan |
Guangdong |
Sichuan |
Xinjiang |
|
cereals |
965.744 |
790.532 |
911.019 |
949.049 |
1248.980 |
861.731 |
960.875 |
|
rice |
444.463 |
279.294 |
483.471 |
211.068 |
727.708 |
511.136 |
282.87 |
|
flour |
129.844 |
230.339 |
193.238 |
166.213 |
14.762 |
28.766 |
286.098 |
|
starch and potato |
85.363 |
64.467 |
56.511 |
105.97 |
94.551 |
91.082 |
92.773 |
|
dried beans |
136.995 |
110.674 |
159.92 |
158.6 |
168.197 |
115.182 |
103.217 |
|
oil |
400.952 |
400.948 |
304.697 |
321.440 |
437.107 |
487.546 |
368.532 |
|
vegetable oil |
389.955 |
398.266 |
297.369 |
320.913 |
427.133 |
454.021 |
367.501 |
|
animal oil |
10.997 |
2.681 |
7.328 |
0.528 |
9.974 |
33.525 |
1.031 |
|
meat |
1966.918 |
1242.282 |
1523.311 |
1285.450 |
3142.079 |
2221.153 |
1671.017 |
|
pork |
1260.362 |
686.104 |
822.706 |
724.959 |
2331.551 |
1663.143 |
394.141 |
|
beef |
236.047 |
200.754 |
369.27 |
122.936 |
273.176 |
200.304 |
308.733 |
|
lamb |
165.758 |
162.009 |
123.215 |
128.651 |
63.658 |
31.697 |
775.212 |
|
poultry |
675.523 |
274.422 |
296.113 |
355.708 |
1486.778 |
747.054 |
369.780 |
|
chicken |
391.787 |
126.522 |
181.697 |
168.952 |
940.26 |
382.241 |
215.837 |
|
duck |
92.308 |
21.14 |
27.538 |
20.121 |
184.972 |
177.828 |
19.31 |
|
eggs |
258.623 |
203.085 |
278.884 |
286.820 |
235.365 |
252.821 |
179.564 |
|
fresh eggs |
239.076 |
282.395 |
253.317 |
267.42 |
217.311 |
233.084 |
163.97 |
|
aquatic products |
658.075 |
392.136 |
488.197 |
237.328 |
1680.956 |
390.565 |
263.780 |
|
fish |
429.314 |
199.455 |
294.86 |
149.124 |
1114.966 |
294.68 |
184.979 |
|
shrimp |
90.845 |
128.005 |
93.397 |
45.876 |
174.516 |
25.534 |
40.497 |
|
vegetables |
1294.435 |
1092.351 |
1250.046 |
1104.161 |
1591.295 |
1488.296 |
936.079 |
|
fresh vegetables |
1188.656 |
982.883 |
1167.412 |
1030.651 |
1419.729 |
1395.452 |
880.109 |
|
fruits |
876.735 |
678.799 |
1016.609 |
719.672 |
1132.067 |
783.834 |
938.371 |
|
fresh fruits |
572.204 |
423.437 |
714.824 |
397.723 |
808.792 |
545.249 |
473.396 |
|
fresh melon |
101.706 |
116.474 |
187.169 |
107.603 |
81.701 |
59.221 |
102.064 |
|
pastries |
230.66 |
205.994 |
182.435 |
219.691 |
325.238 |
186.507 |
229.883 |
|
dairy products |
518.579 |
470.497 |
421.309 |
456.456 |
625.313 |
582.044 |
441.057 |
|
fresh dairy products |
26.451 |
260.788 |
180.515 |
257.793 |
230.806 |
344.782 |
282.565 |
|
milk powder |
119.153 |
57.062 |
80.76 |
65.445 |
253.937 |
128.544 |
28.524 |
|
yogurt |
79.397 |
117.709 |
100.372 |
78.06 |
60.628 |
60.157 |
70.271 |
|
Total food expenditure |
6522.346 |
4954.799 |
5817.404 |
4589.695 |
9755.37 |
6846.953 |
5245.763 |
|
Number of samples |
10462 |
1935 |
1222 |
1602 |
2371 |
2246 |
1086 |
4.2.2 Provincial food consumption
As shown in Table 7, the provincial food consumption carries the following features:
(1) On the total consumption, the food consumption of all sample households averaged at 969.431kg. The urban households in Jilin on average consumed 1,000.321kg of food, more than those in any other province, while those in Xinjiang on average consumed 929.967kg, fewer than those in any other province.
(2) By the per-capita consumption, the different types of food can be ranked in descending order as follows: vegetables (365.869kg), cereals (159.613kg), fruits (???kg), meat (73.793kg), dairy products (58.102kg), edible oils (30.915kg), fresh eggs (30.890kg), aquatic products (30. 536kg), grains (28.239kg) and poultry meat (26.003kg).
(3) Under each category of food, the consumption of specific food products per urban resident demonstrates the regional features and consumption habits of the Chinese people.
On cereals, the sample households on average consumed 115.104kg of rice and 44.509kg of flour. By consumption per urban resident, Guangdong and Xinjiang were the greatest and the smallest consumers of rice, respectively (170.493kg vs. 57.150kg). The two provinces switched their places in the ranking of per-capita consumption of four (96.764kg vs. 3.392kg).
Table 7. Consumption of different types of food in each province
|
Food |
Total sample |
Hebei |
Jilin |
Henan |
Guangdong |
Sichuan |
Xinjiang |
|
cereals |
259.613 |
160.240 |
193.026 |
121.503 |
173.885 |
146.727 |
172.607 |
|
rice |
115.104 |
76.693 |
135.937 |
57.150 |
170.493 |
138.709 |
75.843 |
|
flour |
44.509 |
93.547 |
57.089 |
64.353 |
3.392 |
8.018 |
96.764 |
|
starch and potato |
28.239 |
24.370 |
23.016 |
36.617 |
21.936 |
31.592 |
35.473 |
|
oil |
30.915 |
29.740 |
30.429 |
24.167 |
28.769 |
38.092 |
33.361 |
|
vegetable oil |
30.069 |
29.483 |
29.664 |
24.105 |
27.874 |
35.818 |
33.274 |
|
animal oil |
0.846 |
0.257 |
0.765 |
0.062 |
0.895 |
2.274 |
0.087 |
|
meat |
73.793 |
49.419 |
59.791 |
45.551 |
105.513 |
95.895 |
59.673 |
|
pork |
60.426 |
36.146 |
43.229 |
36.854 |
96.023 |
88.075 |
22.908 |
|
beef |
7.849 |
7.494 |
12.365 |
4.379 |
7.640 |
6.799 |
11.150 |
|
lamb |
5.518 |
5.779 |
4.197 |
4.318 |
1.850 |
1.021 |
25.615 |
|
poultry |
26.003 |
10.140 |
14.578 |
14.279 |
52.751 |
29.573 |
18.636 |
|
chicken |
20.545 |
8.881 |
12.700 |
12.532 |
42.865 |
18.670 |
17.121 |
|
duck |
5.458 |
1.259 |
1.878 |
1.747 |
9.886 |
10.903 |
1.515 |
|
fresh eggs |
30.890 |
42.133 |
38.586 |
40.100 |
21.673 |
24.380 |
22.197 |
|
aquatic products |
30.536 |
21.485 |
28.175 |
14.544 |
65.441 |
21.264 |
15.888 |
|
fish |
27.698 |
17.156 |
25.323 |
12.878 |
60.321 |
20.564 |
14.549 |
|
shrimp |
2.838 |
4.329 |
2.852 |
1.666 |
5.120 |
0.700 |
1.339 |
|
vegetables |
365.869 |
359.204 |
363.864 |
406.279 |
344.589 |
400.021 |
296.214 |
|
fruits |
151.540 |
153.593 |
185.295 |
173.847 |
130.341 |
122.712 |
182.938 |
|
fresh fruits |
107.325 |
102.457 |
133.432 |
106.645 |
107.136 |
104.220 |
94.462 |
|
fresh melon |
44.215 |
51.136 |
51.827 |
67.202 |
23.205 |
18.492 |
88.476 |
|
pastries |
13.930 |
15.547 |
14.775 |
16.288 |
13.112 |
12.234 |
11.913 |
|
dairy products |
58.102 |
77.095 |
48.820 |
57.639 |
33.842 |
61.626 |
81.068 |
|
fresh dairy products |
44.522 |
53.768 |
33.022 |
43.559 |
25.211 |
51.923 |
69.265 |
|
milk powder |
1.397 |
1.231 |
1.239 |
0.921 |
2.132 |
1.524 |
0.703 |
|
yogurt |
12.183 |
22.096 |
14.559 |
13.159 |
6.500 |
8.179 |
11.100 |
|
Total food expenditure |
969.431 |
942.966 |
1000.321 |
950.815 |
991.852 |
984.116 |
929.967 |
|
Number of samples |
10462 |
1935 |
1222 |
1602 |
2371 |
2246 |
1086 |
On edible oils, the sample households on average consumed 30.069kg of vegetable oils, with Sichuan and Henan being the largest and smallest consumers, respectively (35.818kg vs. 24.105kg).
On meat, Guangdong ranked the first in terms of the per-capita consumption (105.513kg), followed by Sichuan (95.95kg). The other four provinces consumed less than 60kg of meat per urban resident. Specifically, Guangdong and Sichuan were the top two consumers of pork, with per-capita consumptions of 96.023kg and 88.075kg, respectively, while Xinjiang was the least pork consuming province (22.908kg). Jilin and Xinjiang consumed more beef per urban resident than any other province (12.365kg vs. 11.15kg). In addition, Xinjiang was the largest consumer of mutton, with per-capita consumption of 25.615kg.
On poultry meat, the leading consumers per urban resident were Guangdong and Sichuan (52.751kg vs. 29.573kg). The per-capita consumption of the other four provinces was merely 20kg. Specifically, Guangdong consumed 42.865kg per urban resident, more than any other province. The same occurred to Sichuan in terms of duck meat (10.903kg).
On eggs, Hebei and Henan were the leading consumers, with per-capita consumptions of 42.133kg and 40.100kg respectively.
On aquatic products, Guangdong took a huge lead in per-capita consumption (65.441kg). For example, this province consumed an average of 60.321kg of fish, much more than any other province. On dairy products, Xinjiang was the leading consumer, with a per-capita consumption of 81.068kg.
On vegetables, Henan and Guangdong occupied the top two spots in the ranking of per-capita consumption (406.279kg vs. 400.021kg), while Xinjiang came at the bottom (296.214kg). On fruits, Jilin had the highest per-capita consumption (185.259kg), followed by Xinjiang (182.938kg), while Sichuan had the lowest per-capita consumption (122.712kg).
4.2.3 Age structure analysis
According to the family life cycle theory, the evolution of each family can be divided into the following phases: formation, expansion, stabilization, contraction, empty-nesting and disintegration. These phases are closely related to the age structure of family members. Thus, this sub-section explores the relationship between the age structure and the food consumption of the sample households (Table 8).
Table 8. Per-capita food expenditure of sample urban households with different age structures
|
Type of family |
Number of samples |
Per capita food consumption expenditure |
|
Couple, 24-29 years old |
50 |
2988.71 |
|
Boy, Six years old and below |
40 |
2427.64 |
|
Girl, Six years old and below |
36 |
2735.24 |
|
Couple, 30-34 years old |
54 |
3864.11 |
|
Boy, 7-11years old |
63 |
2338.27 |
|
Girl, 7-11years old |
55 |
2355.54 |
|
Couple, 35-39 years old |
34 |
3818.55 |
|
Boy, 12-16years old |
143 |
2533.23 |
|
Girl, 12-16years old |
112 |
2318.35 |
|
Couple, 40-44 years old |
55 |
3041.93 |
|
Boy, 17-21years old |
158 |
2579.63 |
|
Girl, 17-21years old |
108 |
2534.38 |
|
Couple, 45-49 years old |
200 |
3177.06 |
|
Couple, 50-54 years old |
252 |
3376.20 |
|
Couple, 55-59 years old |
272 |
3632.92 |
|
Couple, 60-64 years old |
163 |
3684.00 |
|
Couple, 65-69 years old |
80 |
3186.30 |
|
Couple, Over 70 years old |
114 |
2520.60 |
It can be seen from Table 8 that the per-capital food expenditure of each urban household depends on the number of family members and on the age structure. For instance, the couples aged 30~34 have the largest per-capita food expenditure, while those aged 40~64 increases with age. Males aged 11 and below spent less on average than females in the same age group, while males aged 12~21 spent more on average than their female counterparts. These results confirm the impact of demographic changes on food consumption in urban households, and the importance of adult equivalent scales to the empirical analysis.
4.2.4 Food price analysis
As mentioned before, this paper investigates the food consumption in Chinese urban households against such influencing factors as residence, family education level and the number of family members working in state-owned enterprises. The residence has an impact on household food consumption, because the locals are more likely to have good job opportunities and social security. The education level directly bears on which food the residents choose to consume, and thus affects food expenditure. Here, the family education level is split into eight categories, namely, illiteracy, elementary school, junior high school, senior high school, vocational school, specialist school, undergraduate school and graduate school, and each level is given a rating against a 1~8 scale. On average, the family education level of the sample households was 4.708. The number of family members working in state-owned enterprises was considered because it determines the economic stability of the household.
Table 9 shows the consumption and expenditure of each urban household on the ten types of food. Note that the food price stands for the value per unit of food. It can be seen that meat is the most expensive type of food, with a price of RMB 22.941 yuan/kg, while vegetables are the cheapest type of food, with a price of RMB 3.496 yuan/kg.
Table 9. Statistical description of variables in the sample households
|
Variable |
Total sample |
|
|
Average value |
Standard deviation |
|
|
Household disposable income (yuan) |
44435.27 |
26063.39 |
|
Family members’ education level |
4.708 |
1.981 |
|
Number of working people in the state sector |
0.771 |
0.850 |
|
registered residence (1= Local household registration, 0= Other) |
0.966 |
0.182 |
|
city (1= Small city, 0= Other) |
0.183 |
0.386 |
|
Price(yuan/Kg) |
|
|
|
cereals |
4.195 |
1.110 |
|
meat |
22.941 |
3.675 |
|
poultry |
19.195 |
4.523 |
|
eggs |
8.366 |
1.987 |
|
aquatic products |
15.616 |
4.523 |
|
dairy products |
9.981 |
7.994 |
|
vegetables |
3.496 |
0.997 |
|
fruits |
6.244 |
2.639 |
|
region |
|
|
|
Henan |
0.153 |
0.360 |
|
Hebei |
0.185 |
0.388 |
|
Guangdong |
0.227 |
0.419 |
|
Sichuan |
0.215 |
0.411 |
|
Jilin |
0.117 |
0.321 |
|
Xinjiang |
0.104 |
0.420 |
|
Number of samples |
10462 |
|
4.2.5 Income group analysis
As shown in Table 9, the mean disposable income of Chinese urban households is RMB 44,435.27 yuan. In light of this, the sample households can be divided into low-income ones, middle-income ones and high-income ones. The mean disposable income of the high-income group is RMB 68,417.63 yuan, 1.7 times that of middle-income group and 2.8 times that of low-income group.
Table 10 depicts the relationship between food consumption and income group. It can be seen that the food consumption is positively correlated with the household disposable income. The high-income households contribute 21.9% of the food expenditures, twice that of low-income households.
Besides, the household owners in the high-income group are more educated than those in low-income group: 59.4% of high-income household owners are graduates from specialist school or above, while only 23.2% of low-income household owners have the same education background. 22.1% of high-income households live in small cities, so do 15.7% of low-income households.
Many family members in high-income household have local residence, while only a few in middle- and low-income households. Guangdong has the highest percentage of high-income households (33.4%), and Xinjiang has the lowest percentage (6.9%). Meanwhile, Sichuan and Jilin respectively have the highest and lowest percentages of low-income households (26.1% vs. 12%).
The sample households also differ greatly in the proportion of working family members, the expenditure on durable goods and the number of other properties. Table 11 statistically describes the variables of the family structure VA,VB,…,VQ. It can be seen that the mean value of these variables ranges 0.101 to 0.667, that of VQ is 0.101, and that of VG is 0.607.
4.2.6 Estimated food expenditures
Three models were constructed based on Model 1 and used to estimate the food expenditure of the sample households (Table 12). Specifically, Model 2 was created by introducing the square and logarithm of household disposal income to Model 1, Model 3 was designed by introducing family structure variables to Model 1, and Model 4 was constructed by introducing both the square and logarithm of household disposal income and family structure variables to Model 1. The square of household disposal income in Model 4 was proved as significant at the level of 1%, revealing the rationality of the addition of the squared term. The multicollinearity test shows that the variance inflation factors (VIFs) of all variables other than the square and logarithm of household disposal income were smaller than 5, eliminating the possibility of multicollinearity problems.
Comparing the estimation results of Models 3 and 4, it is learned that the variables were similar in coefficient estimates and significance, except for household disposable income and its squared term, indicating the good stability of the models. The estimation results of Model 4 show that the values of 14 out of the 17 family structure variables were below the significance level of 10%. This means Model 4 enjoys better estimation performance than Model 3. Thus, the estimation results of this model were further analyzed below.
The estimates of Model 4 show that the food expenditure of a household is greatly suppressed by the number of family members working in state-owned enterprises, and significantly boosted by the local residence and the scale of the local city. In other words, an urban household tends to spend more on food if its members are permanent registered residents and the local city is relatively large. Meanwhile, the family education level does not have a significant impact on the household food expenditure. In addition, the prices of the main types of food, which still mean the value per unit of food, were estimated to be significant at the 1% level, indicating the major impact of food price on household food expenditure.
Furthermore, the estimation results of the regional variable show that Henan and Hebei have significantly negative variables, while Guangdong and Sichuan have significantly positive variables. All these provinces differ greatly from the reference province of Xinjiang in household food expenditure.
Table 10. Statistical description of variables in different income groups
|
Variable |
Low income group |
Middle income group |
High income group |
|||
|
Average value |
Standard deviation |
Average value |
Standard deviation |
Average value |
Standard deviation |
|
|
Household disposable income (yuan) |
24311.02 |
9605.842 |
40582.92 |
12261.88 |
68417.63 |
28292.25 |
|
Family members' education level |
4.782 |
2.057 |
4.807 |
1.980 |
4.534 |
1.894 |
|
Number of working people in the state sector |
0.492 |
0.707 |
0.875 |
0.866 |
0.947 |
0.895 |
|
registered residence (1= Local household registration, 0= Other) |
0.978 |
0.146 |
0.970 |
0.172 |
0.950 |
0.218 |
|
city (1= Small city, 0= Other) |
0.157 |
0.363 |
0.171 |
0.376 |
0.221 |
0.415 |
|
Price(yuan/Kg) |
|
|
|
|
|
|
|
cereals |
3.888 |
0.779 |
4.053 |
0.953 |
4.644 |
1.365 |
|
meat |
22.219 |
3.700 |
22.790 |
3.503 |
23.815 |
3.640 |
|
poultry |
18.522 |
4.482 |
18.820 |
4.372 |
20.244 |
4.527 |
|
eggs |
8.273 |
1.962 |
8.150 |
1.911 |
8.674 |
2.049 |
|
aquatic products |
14.476 |
4.085 |
15.398 |
4.360 |
16.975 |
4.744 |
|
dairy products |
9.540 |
7.904 |
9.291 |
7.631 |
11.112 |
8.314 |
|
vegetables |
3.278 |
0.883 |
3.408 |
0.934 |
3.801 |
1.088 |
|
fruits |
5.739 |
2.465 |
5.959 |
2.457 |
7.035 |
2.796 |
|
region |
|
|
|
|
|
|
|
Henan |
0.146 |
0.353 |
0.168 |
0.374 |
0.145 |
0.353 |
|
Hebei |
0.169 |
0.375 |
0.219 |
0.414 |
0.167 |
0.373 |
|
Guangdong |
0.171 |
0.377 |
0.175 |
0.380 |
0.334 |
0.472 |
|
Sichuan |
0.261 |
0.439 |
0.202 |
0.401 |
0.182 |
0.386 |
|
Jilin |
0.120 |
0.325 |
0.127 |
0.333 |
0.104 |
0.305 |
|
Xinjiang |
0.134 |
0.411 |
0.109 |
0.396 |
0.069 |
0.424 |
|
Number of samples |
3488 |
3487 |
3487 |
|||
Table 11. Statistical description of variables in the FASE
|
Variable |
Average value |
Standard deviation |
Minimum |
Maximum |
|
VA |
0.2219 |
0.341 |
0 |
2.006 |
|
VB |
0.341 |
0.441 |
0 |
3000 |
|
VC |
0.557 |
0.412 |
0 |
2.987 |
|
VD |
0.388 |
0.409 |
0 |
2.000 |
|
VE |
0.104 |
0.285 |
0 |
2.352 |
|
VF |
0.335 |
0.439 |
0 |
3.453 |
|
VG |
0.607 |
0.396 |
0 |
3.000 |
|
VH |
0.396 |
0.412 |
0 |
2.000 |
|
VI |
0.104 |
0.286 |
0 |
2.000 |
|
VJ |
0.378 |
0.786 |
0 |
5.024 |
|
VK |
0.224 |
0.540 |
0 |
3.811 |
|
VL |
0.581 |
0.836 |
0 |
3.004 |
|
VM |
0.102 |
0.335 |
0 |
1.470 |
|
VN |
0.331 |
0.745 |
0 |
5.003 |
|
VO |
0.279 |
0.592 |
0 |
5.089 |
|
VP |
0.588 |
0.834 |
0 |
4.320 |
|
VQ |
0.101 |
0.332 |
0 |
1.470 |
|
Variable |
Model 1 |
Model 2 |
Model 3 |
Model 4 |
|
The logarithm of the income that the family can control |
0.34*** (0.007) |
2.547*** (0.147) |
0.294*** (0.007) |
2.666*** (0.141) |
|
The square of the logarithm of the income that the household can control |
|
-0.106*** (0.007) |
|
-0.114*** (0.007) |
|
Family members’ education level |
0.010*** (0.002) |
0.009*** (0.002) |
0.000 (0.002) |
-0.001 (0.002) |
|
Number of working people in the state sector |
-0.025*** (0.005) |
-0.025*** (0.004) |
-0.015*** (0.005) |
-0.014*** (0.004) |
|
registered residence |
0.095*** (0.020) |
0.094*** (0.020) |
0.066*** (0.019) |
0.064*** (0.019) |
|
Small city |
0.040*** (0.010) |
0.045*** (0.010) |
0.042*** (0.009) |
0.047*** (0.009) |
|
Food price |
Yes |
Yes |
Yes |
Yes |
|
Regional variable |
Yes |
Yes |
Yes |
Yes |
|
Demographic variable |
|
|
|
|
|
VA |
|
|
0.166 *** (0.024) |
0.170*** (0.024) |
|
VB |
|
|
0.106*** (0.010) |
0.104*** (0.010) |
|
VC |
|
|
0.121*** (0.014) |
0.123*** (0.014) |
|
VD |
|
|
0.152*** (0.015) |
0.145*** (0.015) |
|
VE |
|
|
0.092*** (0.016) |
0.096*** (0.016) |
|
VF |
|
|
0.082*** (0.010) |
0.083*** (0.009) |
|
VG |
|
|
0.111*** (0.015) |
0.119*** (0.015) |
|
VH |
|
|
0.170*** (0.016) |
0.183*** (0.015) |
|
VI |
|
|
0.095*** (0.014) |
0.105*** (0.014) |
|
VJ |
|
|
-0.026*** (0.009) |
-0.027*** (0.009) |
|
VK |
|
|
-0.012*** (0.008) |
-0.009 (0.008) |
|
VL |
|
|
0.007 (0.006) |
0.005 (0.006) |
|
VM |
|
|
0.032*** (0.012) |
0.031*** (0.012) |
|
VN |
|
|
-0.026*** (0.009) |
-0.026*** (0.009) |
|
VO |
|
|
-0.028*** (0.007) |
-0.025*** (0.007) |
|
VP |
|
|
-0.018*** (0.006) |
-0.015*** (0.006) |
|
VQ |
|
|
0.017 (0.013) |
0.015 (0.012) |
|
Constant term |
4.134*** (0.116) |
-7.365*** (0.772) |
4.279*** (0.113) |
-8.099*** (0.746) |
|
Number of samples |
10462 |
10462 |
10462 |
10462 |
|
Adjusted coefficient of determination |
0.456 |
0.468 |
0.496 |
0.509 |
|
***, **, * indicate 1%, 5%, 10%, respectively |
||||
Focusing the food expenditure of Chinese urban residents, this paper introduces the concept and variables (e.g. the age structure) of adult equivalent scales method to the food consumption function, establishes a model to estimate the effects of demographic factors, and applies the model to predict the impacts of household income, family structure and other factors on food expenditure. Through detailed analysis, the main conclusions were drawn on the food expenditure of Chinese urban residents:
(1) The elasticity of food expenditure to the family structure index, which represents the age and gender conditions of a household, was estimated as 0.066 at the significance level below 1%, indicating that the gender-age structure, i.e. the family structure, directly affects the household food expenditure. The result reflects the importance of demographic factors in the evaluation of food consumption.
(2) The elasticity of food expenditure to household disposable income was estimated as 0.321 without considering the family structure, and as 0.269 when the family structure was taken into account. Thus, the income elasticity will be exaggerated if demographic factors are not considered in the analysis of food consumption.
(3) The elasticity of food expenditure to household disposable incomes of low-, middle- and high-income groups were estimated as 0.411, 0.307, and 0.098, respectively, at the significance level below 5% This means the income elasticity of food expenditure is negatively correlated with the income level. The food consumption of high-income urban residents is more sensitive to the changes in the age structure than that of residents in other income groups.
To sum up, the food consumption of Chinese urban households is greatly affected by household disposable income and the family structure.
The article is the achievements of the annual project of the Research Center for the Theory System of Socialism with Chinese Characteristics in Fujian Province (FJ2019ZTB097).
[1] Horowitz, S., Yu, P. (2015). Holding China’s west: explaining CCP strategies of rule in Tibet and Xinjiang. Journal of Chinese Political Science, 20(4): 451-475. https://doi.org/10.1007/s11366-014-9323-1
[2] Chen, D.D., Gao, W.S., Chen, Y.Q., Zhang, Q. (2010). Ecological footprint analysis of food consumption of rural residents in China in the latest 30 years. Agriculture and Agricultural Science Procedia, 1: 106-115. https://doi.org/10.1016/j.aaspro.2010.09.013
[3] Adrian, J., Daniel, R. (1976). Impact of socioeconomic factors on consumption of selected food nutrients in the United States. American Journal of Agricultural Economics, 58(1): 31-38. https://doi.org/10.2307/1238574
[4] Zheng, Z., Henneberry, S.R. (2011). Household food demand by income category: Evidence from household survey data in an urban Chinese province. Agribusiness, 27(1): 99-113. https://doi.org/10.1002/agr.20243
[5] Dong, X., Hu, B. (2010). Regional difference in food consumption away from home of urban residents: A panel data analysis. Agriculture and Agricultural Science Procedia, 1: 271-277. https://doi.org/10.1016/j.aaspro.2010.09.034
[6] Han, X., Chen, Y. (2016). Food consumption of outgoing rural migrant workers in urban area of China. China Agricultural Economic Review, 8(2): 230-249. https://doi.org/10.1108/CAER-06-2015-0067
[7] Hesketh, T., Xing, Z.W. (2000). Human population growth. China's one child family policy is changing. BMJ Clinical Research, 320(7232): 443-443. https://doi.org/10.1136/bmj.320.7232.443
[8] Liu, L. (2005). Fertility trends in china's more developed urban districts: the case of four cities. Population, Space and Place, 11(5): 411-424. https://doi.org/10.1002/psp.377
[9] Gould, B.W. (2002). Household composition and food expenditures in China. Agribusiness: An International Journal, 18(3): 387-407. https://doi.org/10.1002/agr.10020
[10] Li, M., Shen, K. (2013). Population aging and housing consumption: A nonlinear relationship in China. China & World Economy, 21(5): 60-77. https://doi.org/10.1111/j.1749-124X.2013.12039.x
[11] Zhu, Q., Wei, T.Y. (2016). Future impacts of population aging and urbanization on household consumption in China. Population Research, 40(6): 62-75.
[12] Zuo, X., Yang, X. (2009). The long-term impact on the Chinese economy of an aging population. Social Sciences in China, 30(1): 197-208. https://doi.org/10.1080/02529200802704027
[13] Estrada, G., Park, D., Ramayandi, A. (2011). Population aging and aggregate consumption in developing Asia. ADB Economics Working Paper Series, 282: 1-24. https://doi.org/10.2139/ssrn.1963503
[14] Deng, O., Zhang, S., Deng, L., Zhang, C., Fei, J. (2018). Wet nitrogen deposition across the urban-intensive agricultural–rural transect of a small urban area in southwest China. Environmental Science and Pollution Research, 25(8): 7866-7874. https://doi.org/10.1007/s11356-017-1082-z
[15] Gao, H., Stiller, C.K., Scherbaum, V., Biesalski, H.K., Wang, Q., Hormann, E., Bellows, A.C. (2013). Dietary intake and food habits of pregnant women residing in urban and rural areas of Deyang City, Sichuan Province, China. Nutrients, 5(8): 2933-2954. https://doi.org/10.3390/nu5082933
[16] Keung Wong, D.F., Li, C.Y., Song, H.X. (2007). Rural migrant workers in urban China: living a marginalised life. International Journal of Social Welfare, 16(1): 32-40. https://doi.org/10.1111/j.1468-2397.2007.00475.x