
Rinjani Afizah Wulandari | Giva Andriana Mutiara | Muhammad Rizqy Alfarisi* | Periyadi
© 2026 The authors. This article is published by IIETA and is licensed under the CC BY 4.0 license (http://creativecommons.org/licenses/by/4.0/).
OPEN ACCESS
The SmartVest system requires a stable and reliable impact detection module to support the objective evaluation of shooting training. However, multiplexing-based multi-sensor systems face limitations in capturing very short transient signals generated by high-velocity impacts, since sequential scanning may miss signals whose duration is shorter than the system scanning interval. This study aims to design and implement a multiplexed piezoelectric sensor array system based on the ESP32-S3 microcontroller for real-time ballistic impact detection in a wearable SmartVest device. The proposed system employs 37 piezoelectric sensors distributed across the vest surface and integrated with an analog multiplexer to enable efficient multi-channel signal acquisition under limited analog-to-digital converter (ADC) input availability. To improve signal stability and protect the acquisition circuit, a signal conditioning circuit was developed using a series resistor, a Zener diode for overvoltage protection, a parallel capacitor for peak-hold operation, and a pull-down resistor to stabilize transient responses. The acquisition process was analytically characterized using the resistor–capacitor (RC) time constant and sequential multiplexing parameters to examine the temporal behavior of conditioned transient signals during multi-channel acquisition. Experimental validation was conducted using live ammunition at shooting distances of 18 m, 20 m, 22 m, and 25 m, with a total of 40 trials. The results show that all impact events under the tested conditions were successfully detected, with no missed impact events observed. The system produced voltage responses of up to 3.3 V, remaining within the safe operating range of the microcontroller, and was able to identify multi-sensor activation within a single impact event, indicating the spatial distribution of impact energy. Overall, the proposed system demonstrates reliable real-time impact detection, efficient data acquisition, and spatial mapping capability, making it a promising solution for wearable SmartVest applications and Internet of Things (IoT)-based multi-sensor monitoring systems.
analog multiplexing, ballistic impact detection, embedded system, ESP32-S3, piezoelectric sensor array, real-time monitoring, signal conditioning, wearable sensor
Impact detection systems are one of the essential components in various engineering applications, such as structural health monitoring systems, security systems, wearable systems, and sensor-based training systems. In shooting training systems, an effective impact detection system not only determines whether a projectile hits the target, but also provides detailed information regarding the impact location and the spatial distribution of impact energy. This information is crucial for performance evaluation and shot pattern analysis, which cannot be obtained from conventional static target systems alone [1-3].
However, in practice, conventional shooting training systems still largely rely on manual evaluation methods that provide only limited information in the form of scores or the number of shots hitting the target [4]. This approach is not capable of delivering more in-depth technical information, such as impact distribution patterns, tendencies of repeated errors, or the characteristics of impact energy on the target surface. As a result, the evaluation process tends to be general and provides limited specific feedback for improving shooter performance [3, 5].
The advancement of sensor technology and embedded systems provides opportunities to overcome these limitations through wearable-based impact detection systems, enabling real-time monitoring of pressure and mechanical interactions directly on the user’s body [6]. One of the most widely used sensors for this purpose is the piezoelectric sensor, due to its fast response to mechanical stress and vibration [7]. This type of sensor is capable of generating high-amplitude electrical signals within a very short duration during impact events, making it highly suitable for applications such as structural health monitoring, vibration sensing, and wearable physiological monitoring [8, 9].
Nevertheless, the implementation of piezoelectric sensors in multi-sensor systems presents several significant technical challenges. The generated signals are typically transient in nature, characterized by high amplitude and very short duration [10, 11], which may introduce noise, unstable readings, and potential risk of microcontroller damage if not properly handled. Furthermore, the use of multiple sensors within a single system is constrained by the limited number of analog-to-digital converter (ADC) channels available on the microcontroller. Therefore, a design approach is required that not only preserves signal integrity but also ensures efficient multi-channel data acquisition.
An earlier SmartVest system for airsoft sport-games was developed to automatically detect player hits and monitor game status using light-dependent resistor (LDR) and vibration/piezoelectric sensors integrated with a Raspberry Pi-based monitoring system [12]. The system employed five predefined firing points and was capable of recording hit events and player status in real time. However, the sensing architecture relied on a limited number of predefined sensing points and did not address dense multi-channel piezoelectric acquisition, transient signal retention, or sequential multiplexed scanning for spatial impact localization.
Several previous studies have explored the use of piezoelectric sensors for impact detection and sensor-based monitoring systems. However, most of these studies are still limited to single-sensor implementations or have not fully integrated signal conditioning circuits, multi-channel data acquisition systems, and system performance analysis [13, 14]. Therefore, a research gap remains in the development of a reliable and fully integrated multi-channel piezoelectric-based impact detection system.
However, in multiplexing-based multi-sensor systems, there exists a fundamental challenge that has not been extensively addressed, namely the mismatch between the very short duration of transient signals generated by piezoelectric sensors and the scanning time in sequential data acquisition processes. This condition may lead to signal loss when the scanning time exceeds the duration of the generated signal. Although multiplexing techniques are widely employed to overcome ADC channel limitations, analysis of the trade-off between acquisition efficiency and transient signal detection reliability remains limited in the existing literature.
The limitations identified in previous studies indicate that the main challenge is not only increasing the number of sensing channels, but also maintaining reliable acquisition of short-duration piezoelectric signals when multiple sensors are accessed sequentially. Existing approaches commonly address sensor sensitivity, individual impact detection, or multi-channel acquisition separately, whereas the interaction between signal conditioning, transient signal retention, multiplexed scanning, and impact localization requires further investigation in an integrated wearable system. Therefore, the research gap addressed in this study lies in the integration and experimental evaluation of these aspects within a 37-channel piezoelectric sensing architecture. The proposed system combines resistor–capacitor (RC)-based signal conditioning, sequential analog multiplexing, peak-based threshold detection, and spatial sensor mapping to evaluate whether transient impact signals can be reliably acquired and localized under real ballistic impact conditions.
Based on these issues, this study proposes the design and performance analysis of a multiplexed piezoelectric sensor array system for real-time impact detection. The developed system integrates piezoelectric sensors with a signal conditioning circuit consisting of high-value series resistors, a Zener diode as a voltage limiter, parallel capacitors, and a pull-down resistor to maintain the stability of high-energy transient signals. To address the limitations of ADC channels, the system uses an analog multiplexer so that multiple sensors can be efficiently acquired through a single ADC channel. An ESP32-S3 microcontroller is used as the main processing unit to perform sensor scanning, data acquisition, and impact detection using peak detection and threshold filtering methods. With this approach, the system is still capable of consistently detecting impacts despite environmental noise [15].
Unlike conventional multi-sensor impact detection systems that mainly focus on sensor integration and localization performance, this study specifically investigates the relationship between transient piezoelectric signal duration and sequential multiplexed acquisition timing. The proposed system integrates RC-based signal retention and high-speed sequential scanning to preserve short-duration impact signals during multiplexed acquisition while maintaining low hardware complexity and efficient ADC resource utilization.
The main contributions of this research are as follows: 1) Development of a 37-channel piezoelectric sensor array for real-time wearable impact detection. 2) Design of an RC-based signal conditioning circuit to preserve transient piezoelectric signals and protect the ADC interface from high-voltage spikes. 3) Implementation of a sequential analog multiplexing acquisition architecture for efficient multi-channel sensing using limited ADC resources. 4) Development of an impact detection algorithm based on peak detection and threshold filtering. 5) Experimental validation of the proposed system under real ballistic impact conditions at multiple shooting distances.
The results of this research are expected to serve as a foundation for the development of efficient, stable multi-channel sensor-based collision detection systems that can be implemented in various embedded systems and mechatronics applications.
Research on sensor-based impact detection systems has advanced rapidly, particularly with the use of piezoelectric sensors, which are known for their rapid response to changes in mechanical stress. These sensors are capable of converting mechanical energy into electrical signals in a very short time, making them widely used in applications such as structural health monitoring and impact detection systems [16-18]. Several studies have shown that piezoelectric sensors exhibit high sensitivity to mechanical stress variations, enabling accurate measurement of vibration and shock events [19]. These characteristics make piezoelectric sensors well-suited for real-time detection systems.
On the other hand, the advancement of wearable systems based on the Internet of Things (IoT) has further driven the integration of sensors into devices that can be directly used by end users. Wearable systems enable data acquisition to be performed directly at the point of occurrence, resulting in more contextual data compared to conventional methods. However, the implementation of wearable systems with a large number of sensors still faces limitations, particularly in terms of data acquisition and hardware resources [17]. To address the constraints of limited ADC channels and microcontroller resource management, analog multiplexing techniques are commonly employed to route multiple input channels sequentially to a single ADC module [20]. Although efficient in terms of pin usage, most existing literature has not thoroughly addressed how to maintain data integrity when dealing with piezoelectric transient signals characterized by very fast rise times and impulsive amplitudes.
In addition, signal conditioning is a critical aspect in sensor-based systems. Piezoelectric signals, which are impulsive and high in amplitude, may introduce noise, distortion, and potential damage to electronic components if not properly managed [9]. Therefore, interface circuits such as charge amplifiers are required to convert electrical charge into voltage signals that can be further processed by data acquisition systems [21]. Several studies have proposed the use of RC filters and voltage protection as basic solutions. However, the integration of voltage protection, current limiting, and signal retention mechanisms (peak hold) within multi-channel systems has not been comprehensively explored. Furthermore, microstructure-based sensors generally offer high sensitivity but limited detection range, whereas three-dimensional porous structures can extend the detection range at the cost of relatively lower sensitivity. Hence, a more optimal sensing system design approach is still required [22].
Table 1. Comparison of the proposed system with representative previous studies
|
Study |
Main Application |
Sensor/ Channel Configuration |
Acquisition/ Processing Approach |
Localization Capability |
Signal Conditioning/ Readout |
Experimental Validation |
|
Liu et al. [18] |
Indirect characterization of impact force on steel plates |
4 piezoelectric sensors arranged symmetrically |
TDoA and explicit dynamic FEA (LS-DYNA) |
2D coordinate estimation; maximum axial relative error ≤ 11% |
Direct voltage measurement using oscilloscope |
Steel ball drop tests (260 g, 40 mm diameter) at velocities of 1.0–3.0 m/s |
|
Capineri et al. [23] |
Structural health monitoring of laminate structures |
Up to 8 passive PZT sensors |
Real-time multichannel acquisition and TDoA minimization |
High-accuracy 2D localization inside/outside ROI |
16-channel programmable AFE; SNR >72 dB; 270–800 kHz bandwidth |
Low-energy hammer impacts; error stabilization with ≥6 sensors |
|
Wang and Zhong [17] |
Low-velocity impact monitoring on carbon fiber composite |
7 PZT sensors in compact array |
Two-stage sparse feature mapping and 2D-MUSIC |
Area classification and point localization; error < 2 cm |
Integrated SHM acquisition; narrow-band extraction at 50 kHz |
Steel-ball drop impacts and ABAQUS FEM simulation |
|
Zhao et al. [24] |
Local impact and vibration sensing |
4 flexible BaTiO₃-resin composite film sensors |
Centroid localization based on relative voltage |
Grid-based local impact detection |
Direct electromechanical voltage readout |
Drop-ball impact characterization on composite panel |
|
Karbari et al. [21] |
Low-vibration signal processing |
Multi-element concept; 2-channel experimental validation |
Active analog processing and threshold-based channel activation |
No spatial localization |
Op-amp charge amplifier, rectifier, comparator, band-pass filter |
Function-generator and laboratory experimental testing |
|
Ku and Lu. [25] |
Wearable electronic skin and tactile/physiological monitoring |
4 × 4 flexible piezoelectric array (16 channels) |
CMOS-integrated spatiotemporal readout |
Spatial mapping of distributed tactile pressure and force |
CMOS-integrated readout with high input impedance |
Experimental tactile/force characterization; 5–14 Pa resolution |
|
Mutiara et al. [12] |
Wearable real-time laser and impact monitoring for airsoft sport-games |
5 predefined target points using LDRs and piezoelectric vibration sensors |
Sensor acquisition using NodeMCU/Arduino, wireless transmission via Wi-Fi to Firebase, and Raspberry Pi-based monitoring |
5 predefined target zones: 4 non-fatal zones and 1 fatal zone at the left chest |
Ceramic capacitor for temporary charge storage; dark cover used to reduce external-light interference on LDR |
Green-laser testing up to 25 m and airsoft BB impact testing at 5–18 m; piezoelectric detection became difficult at 18 m; reported system response of 1–2 s |
|
This study |
Wearable real-time ballistic impact detection for SmartVests |
37 piezoelectric sensors across 5 body zones |
Sequential analog multiplexing, peak detection, and threshold filtering (1500 ADC) |
Zone-based spatial localization using primary and secondary sensors; up to 5 activated sensors |
Passive RC-based signal retention/filtering + 3.3 V Zener protection |
40 live-ammunition trials at 18, 20, 22, and 25 m; 100% impact detection; measured peak voltage 1.26–3.30 V |
Note: ADC = analog-to-digital converter, LDRs = light-dependent resistors, TDoA = time difference of arrival, ROI = region of interest, AFE = analog front end, SNR = signal-to-noise ratio, CMOS = Complementary Metal–Oxide–Semiconductor, RC = resistor–capacitor.
Table 1 summarizes the main characteristics of representative piezoelectric-based sensing approaches discussed in the literature. The reviewed studies demonstrate different approaches to impact sensing, including impact-force characterization, structural impact localization, flexible piezoelectric sensing, signal conditioning, and multi-channel readout. These studies show that piezoelectric sensing can support both impact detection and spatially distributed sensing, but the system architectures and evaluation objectives vary according to their respective applications. In contrast, the proposed system combines multi-channel sensing, signal conditioning, sequential analog multiplexing, and sensor-zone localization within a wearable ballistic impact detection platform.
Based on the reviewed studies, including previous SmartVest systems for airsoft applications, the remaining gap is focused on the integration of dense multi-channel piezoelectric sensing with signal conditioning and sequential multiplexed acquisition while maintaining reliable detection of short-duration impact signals. Previous SmartVest implementations demonstrated the feasibility of automated hit detection and remote monitoring, but used a limited number of predefined sensing points and did not address the temporal challenges associated with sequential acquisition of a high-density piezoelectric array.
Therefore, this study proposes a multiplexed piezoelectric sensor array system that integrates signal conditioning techniques and multiplexing-based acquisition methods to support reliable real-time impact detection with high detection accuracy and system stability.
3.1 System overview
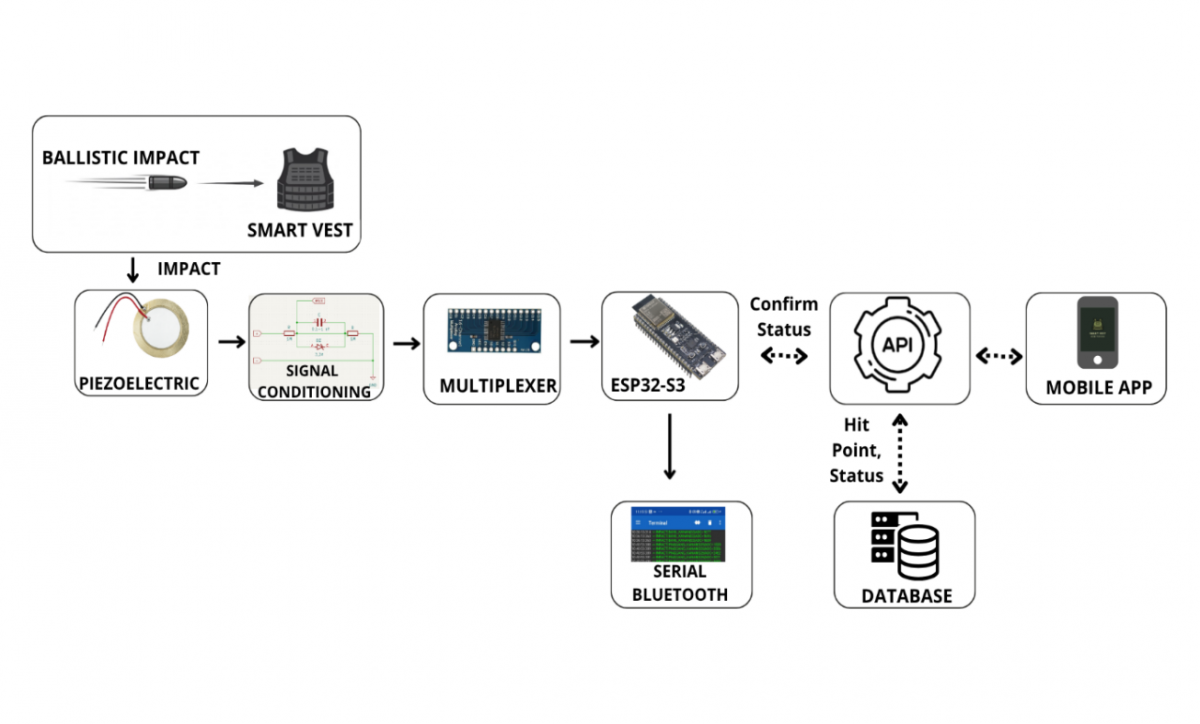
This study develops a wearable sensor-based system designed to detect impact events in real time using a multi-channel piezoelectric sensor configuration [23-26]. The system is organized into several main stages, namely the sensing layer (piezoelectric sensor array), signal conditioning circuit, data acquisition module, and processing unit implementing the detection algorithm. The overall system architecture is illustrated in Figure 1.
In the sensing layer, the system employs a piezoelectric sensor array consisting of 37 piezoelectric sensors distributed across the vital areas of the SmartVest. These sensors function as transducers that convert mechanical energy generated by impact events into transient electrical signals [27].
However, the generated signals are highly transient and unstable, making them unsuitable for direct processing by the microcontroller [28, 29]. Therefore, a signal conditioning circuit is required to ensure compatibility with the data acquisition stage. This process includes voltage clamping and high-frequency noise reduction to produce stable and reliable signals for further processing [30].
The data acquisition process is implemented using an analog multiplexing scheme, which enables multiple sensors to be read using a limited number of ADC channels. By sequentially scanning each channel, the system can efficiently access all sensors without significantly increasing hardware complexity.
The acquired data are subsequently processed by the microcontroller to detect impact events. The detection algorithm applies threshold filtering and peak analysis within a predefined time window to determine the magnitude and location of the impact. The detection results are then transmitted in real time through wireless communication for monitoring purposes.
Figure 1. System overview
Overall, the proposed system architecture is designed to achieve a balance between efficiency and scalability, enabling the integration of a large number of sensors while maintaining real-time performance and reliable detection of short-duration impact events. To provide a detailed overview of the hardware configuration and system parameters utilized in this study, the system specifications are summarized in Table 2.
Table 2. System configuration and experimental parameters
|
Parameter |
Value |
|
Number of Sensors |
37 Piezoelectric sensors |
|
Sensor Type |
Piezoelectric |
|
Microcontroller |
ESP32-S3 |
|
ADC Resolution |
12-bit |
|
Reference Voltage |
3.3 V |
|
Multiplexer |
CD74HC4067 |
|
Acquisition Method |
Sequential scanning |
|
Detection Method |
Peak detection + Threshold |
|
Threshold Value |
1500 (ADC units) |
|
Test Distances |
18 m, 20 m, 22 m, 25 m |
|
Number of Trials |
10 per distance |
Note: ADC = analog-to-digital converter.
3.2 Piezoelectric sensor modeling
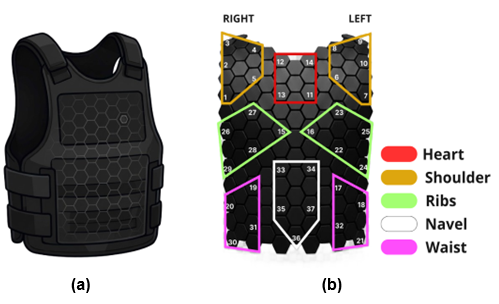
The sensing layer of the SmartVest system consists of 37 piezoelectric sensors distributed and mounted on the front surface of the vest, as illustrated in Figure 2(a), forming a sensing array with wide-area coverage. Piezoelectric sensors were selected due to their high sensitivity and fast response characteristics in converting mechanical energy into electrical signals, which can be modeled using an equivalent electrical circuit to improve the accuracy of the signal acquisition system [31-33]. The conversion process of mechanical force (F) into electrical charge (Q) and voltage (V) in the piezoelectric sensor is modeled using the linear relationship between force and charge, as well as the relationship between charge and capacitance, as expressed in Eq. (1) and Eq. (2):
$Q=d \times F$ (1)
$V=\frac{Q}{C}$ (2)
where, $d$ is the piezoelectric coefficient and $C$ is the sensor capacitance. Since impact events generate transient signals with very short durations, the voltage decay characteristic over time (t) is modeled using an equivalent RC circuit. The voltage response as a function of time can be expressed in exponential form, as shown in Eq. (3) and Eq. (4):
$V(t)=V_0 e^{\left\{-\frac{t}{R C}\right\}}$ (4)
$V(t)=V_0\left(1-e^{\left\{-\frac{t}{R C}\right\}}\right)$ (5)
Based on the equivalent RC circuit model, the transient response of the piezoelectric sensor is governed by the RC time constant, where the signal decay rate depends on the resistance and capacitance values of the interface circuit. Therefore, the RC network plays an important role in extending the transient signal duration and improving the probability of signal capture during sequential multiplexed acquisition. Piezoelectric sensors have been widely implemented in impact detection systems, vibration monitoring, and structural health applications due to their capability to detect transient events with high temporal resolution [25, 34]. These characteristics make piezoelectric sensors a reliable standard for mechanical impact monitoring in wearable devices. Recent studies have also demonstrated that piezoelectric sensor arrays are capable of performing spatially and temporally distributed force detection with high sensitivity through the integration of Complementary Metal–Oxide–Semiconductor (CMOS)-based readout circuits, making them highly relevant for impact monitoring applications in flexible electronics [25].
Figure 2. Physical design of the SmartVest: (a) Visual representation of the vest, and (b) mapping of the distribution of 37 piezoelectric sensors by zone
To improve the precision of impact location analysis in shooting applications, the 37 sensors were divided into several zone mappings, namely the shoulder, heart, rib, navel, and waist regions, as illustrated in Figure 2(b). The detailed sensor ID allocation for each zone is presented in Table 3.
Table 3. Distribution of sensor IDs by zone on the SmartVest
|
Location |
ID Sensor |
Amount |
|
Shoulder Right & Left |
S1-S5 (Right) & S6-10 (Left) |
10 |
|
Heart |
S11-S14 |
4 |
|
Ribs Right & Left |
S15, S26-S27 (Right) & S16, S22-S24 (Left) |
10 |
|
Navel |
S33, S34, S35, S36, S37 |
5 |
|
Waist Right & Left |
S19, S20, S30, S31 (Right) & S17, S18, S21, S32 (Left) |
8 |
Based on this configuration, each sensor operates as an independent sensing node, enabling the system to comprehensively identify impact locations. This mapping is crucial for generating accurate spatial energy distribution data across the entire surface of the vest.
3.3 Signal conditioning circuit design
Piezoelectric sensors generally produce output signals with high impedance and large voltage spikes during sudden impact events. These signals may exceed the safe voltage limits of microcontroller inputs and can introduce noise into the signal acquisition system [30, 35]. Therefore, a signal conditioning circuit is required to stabilize the sensor output and protect the analog interface [36, 37].
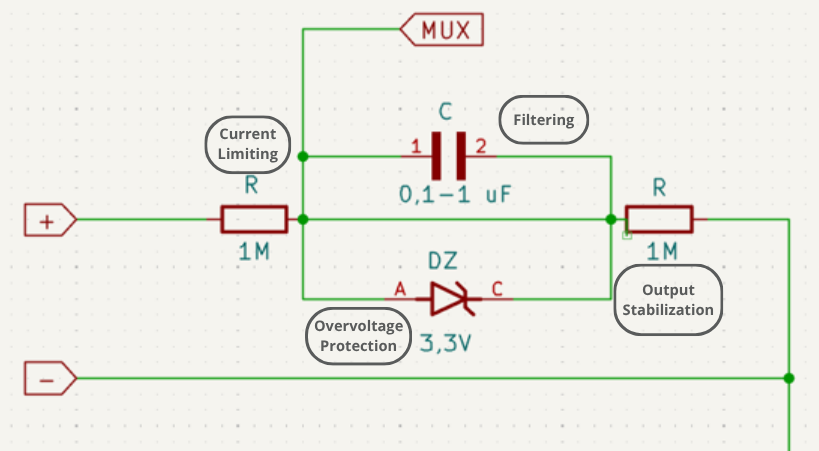
The proposed signal conditioning circuit used in this study is illustrated in Figure 3. The circuit employs several passive components designed to regulate voltage levels and improve signal stability [38]. As the first stage of protection, a series resistor is connected directly after the piezoelectric sensor to limit the electrical current generated by the initial spike of high-energy transient signals.
Figure 3. Signal conditioning circuit
In addition, a Zener diode with a breakdown voltage of approximately 3.3 V is employed to suppress excessive voltage spikes generated during high-energy impact events, thereby preventing potential damage to the microcontroller ADC inputs.
A capacitor is also incorporated into the circuit to perform basic noise filtering and signal smoothing. This capacitor forms a simple RC filter network that helps reduce high-frequency noise and slightly extends the duration of very short transient signals, enabling them to be captured more reliably by the ADC sampling system [39]. The signal retention process follows the time constant $(\tau)$ principle of the RC circuit, which can be mathematically expressed as shown in Eq. (5):
$\tau=R \times C$ (5)
Through the implementation of this time constant, the acquisition system obtains a sufficient time window to accurately capture the peak amplitude value, even when the impact occurs within a microsecond-scale duration. Similar signal conditioning approaches have been widely applied in sensor interface circuits to improve the reliability of embedded sensing systems [30, 39]. The main components and functions of the proposed signal conditioning circuit are summarized in Table 4.
Table 4. Components and functions of the signal conditioning circuit
|
Component |
Function |
|
Series Resistor |
Limits input current and protects the circuit from high transient signals |
|
Zener Diode (3.3 V) |
Clamps voltage to prevent overvoltage at ADC input |
|
Capacitor |
Filters high-frequency noise and retains transient peak signals |
|
Pull-down Resistor |
Stabilizes output and discharges stored charge |
|
RC Network |
Defines time constant for signal shaping and transient response control |
Note: ADC = analog-to-digital converter., RC = resistor–capacitor.
3.4 Analog multiplexing architecture
One of the main challenges in implementing large-scale sensor arrays is the limited number of analog input channels available on embedded microcontrollers. Although the ESP32-S3 provides multiple ADC channels, the available number is still insufficient to directly connect dozens of piezoelectric sensors simultaneously.
To address this limitation, the proposed system employs an analog multiplexing architecture based on the CD74HC4067 integrated circuit. The CD74HC4067 is a 16-channel analog multiplexer that allows multiple analog input signals to be sequentially routed to a single output channel.
By controlling the multiplexer address lines, the microcontroller can select which sensor signal is connected to the ADC input at a particular time. The use of this sequential scanning method significantly reduces the requirement for input pins while improving the efficiency of multi-channel signal acquisition. The system scanning speed is determined by the total scanning time ($T_{\{scan\}}$), which depends on the number of sensors and the reading time of each channel. Mathematically, this relationship can be expressed as shown in Eq. (6):
$T_{\{scan\}}=N \cdot T_{\{read\}}$ (6)
Furthermore, the system scanning frequency can be expressed as the reciprocal of the total scanning time, as shown in Eq. (7):
$f_{\{scan\}}=\frac{1}{T_{\{scan\}}}$ (7)
where, $N$ represents the total number of sensors and $T_{\{read\}}$ denotes the time duration required to read a single channel. Through this time-division multiplexing scanning method, the microcontroller is capable of performing high-speed sampling without sacrificing temporal resolution. This capability is essential to ensure that transient signals generated by impact events can be captured completely, even while channel switching processes are continuously performed. Such a strategy has proven effective in embedded sensor systems for managing complex sensor arrays under limited hardware resources.
3.5 Data acquisition system
The data acquisition system is designed to manage the flow of information from the sensing layer to the central processing unit and visualization platform in real time. The process begins with analog data acquisition through the 12-bit ADC unit of the ESP32-S3 microcontroller. The resulting digital values are then converted into voltage values (V) to accurately represent the impact intensity. The conversion from digital ADC values to analog voltage can be expressed as shown in Eq. (8):
$V_{\{out\}}=\frac{A D C}{2^n-1} V_{\{ref\}}$ (8)
where, ADC value represents the digital reading obtained from the ADC conversion process, $n$ denotes the bit resolution (12-bit), and $V_{ref}$ represents the system reference voltage. This stage plays an important role in ensuring that the acquired data possess sufficient precision to accurately represent the magnitude of mechanical impacts on the vest.
After the voltage conversion process is performed locally, the ESP32-S3 packages the data into a digital format containing sensor identification and timestamps. The data are then transmitted wirelessly via a Wi-Fi network to a monitoring platform, either web-based or mobile-based. This platform serves as a user interface that presents data visualization in the form of spatial mapping on a digital target model. Consequently, users and instructors can directly analyze the impact location and energy distribution systematically immediately after the event occurs.
3.6 Impact detection algorithm
The impact detection method employed in this study is based on a combination of peak detection and threshold filtering to identify impact events and determine the locations of activated sensors. This approach was selected because it efficiently captures the transient signal characteristics generated by piezoelectric sensors in real-time systems.
In the initial stage, the analog signals acquired from each sensor channel are sequentially scanned using a multiplexer and read by the ADC of the ESP32-S3-based microcontroller. The obtained ADC values are then converted into voltage values to represent the actual signal amplitude of each sensor.
Next, a peak detection process is performed to determine the maximum signal value within a specified time window. The peak signal value can be expressed as shown in Eq. (9):
$Vpeak =\max (V(t))$ (9)
After the peak value is obtained, a threshold filtering process is applied to determine whether the signal corresponds to a valid impact event. The detection condition is expressed as shown in Eq. (10):
$Vpeak > Vthreshold$ (10)
If this condition is satisfied, the system identifies the activated sensor based on the multiplexer channel currently being read. This information is subsequently utilized to determine the relative impact location (impact localization) and to classify the impact zone according to the sensor distribution on the SmartVest.
This approach enables the system to distinguish between noise signals and valid impact signals, thereby improving detection reliability and overall system performance.
To provide a more structured overview of the implemented algorithm stages, the system process flow is summarized in Table 5.
Table 5. Processing steps of the proposed impact detection algorithm
|
Step |
Process |
|
1 |
Sequential multiplexer scanning |
|
2 |
ADC sampling and data acquisition |
|
3 |
ADC-to-voltage conversion |
|
4 |
Peak signal extraction |
|
5 |
Threshold-based filtering |
|
6 |
Active sensor determination |
|
7 |
Spatial zone classification |
|
8 |
Impact event detection |
Note: ADC = analog-to-digital converter.
3.7 Performance evaluation metrics
The system performance evaluation primarily focuses on detection success rate, signal stability, and real-time acquisition capability under various impact conditions. SNR and response time are considered theoretically to support the interpretation of signal quality and transient acquisition behavior, respectively. The experimentally evaluated indicators include impact detection capability, signal amplitude, signal stability, and spatial response.
The impact detection success rate was used to evaluate the system’s capability to detect valid impact events under ballistic impact conditions. This metric is calculated as the ratio between the number of successfully detected impact events and the total number of impact trials, as expressed in Eq. (11):
Detection Success Rate $=\frac{N_{detected}}{N_{total}} \times 100 \%$ (11)
where, $N_{detected}$ represents the number of successfully detected impact events, and $N_{total}$ denotes the total number of experimental trials.
In addition, the signal-to-noise ratio (SNR) is used to evaluate the quality of the signal produced by the system after the signal conditioning process. The SNR value represents the ratio between the signal amplitude and the noise amplitude, which can be expressed as shown in Eq. (12):
$S N R=20 \log \left(\frac{V_s}{V_n}\right)$ (12)
where, $V_s$ is the signal amplitude and $V_n$ is the noise amplitude.
The system response time is also analyzed to evaluate the speed of the system in detecting impact events. This parameter is strongly influenced by the scanning time in the multiplexing process as well as the time constant ($\tau$) of the signal conditioning circuit.
Through these considerations, the system performance can be evaluated experimentally in terms of impact detection capability, signal amplitude, and spatial response, while SNR and response time provide theoretical considerations for signal quality and transient acquisition performance.
3.8 Experimental setup
System testing was conducted to evaluate the impact detection performance under various distance conditions using a projectile-based impact testing scenario. The experiments were designed to simulate real impact events on the SmartVest equipped with a piezoelectric sensor array.
The experiments were conducted at several distance variations, namely 18 m, 20 m, 22 m, and 25 m. At each distance, 10 trials were performed to ensure the consistency and reliability of the measurement results. Each trial generated signal data from all sensors, which were subsequently processed using the ESP32-S3-based acquisition system.
During the testing process, several key parameters were observed, including the signal peak value (ADC peak), converted voltage output, activated sensor identification, and the detected impact location. These data were used to evaluate the experimentally measured performance indicators, including impact detection success rate, peak signal amplitude, converted voltage output, activated sensor identification, and impact localization. SNR and system response time were considered as theoretical performance aspects related to signal quality and transient acquisition, respectively, but were not directly quantified in the present experiments.
In addition, the testing configuration also considered the sensor distribution on the SmartVest to analyze the spatial response to impact events. With this approach, the system can be evaluated not only in terms of detection capability, but also in its ability to accurately determine the relative impact location.
4.1 Impact detection performance
The impact detection performance of the developed SmartVest system was evaluated through controlled ballistic impact experiments conducted at four shooting distances, namely 18 m, 20 m, 22 m, and 25 m. At each distance, ten shots were performed, resulting in a total of 40 impact events. The purpose of this evaluation was to determine whether the proposed multiplexed piezoelectric sensor array system could successfully detect impact events under the tested conditions.
Prior to the ballistic impact experiments, a no-impact baseline observation was conducted to evaluate the sensor output under idle conditions. During this condition, the sensor output fluctuated within approximately 200–800 ADC units. Therefore, the detection threshold was set to 1500 ADC units to provide a sufficient margin above the maximum baseline fluctuation while maintaining sensitivity to low-amplitude valid impact responses. For the 12-bit ADC with a 3.3 V reference voltage, this threshold corresponds to approximately 1.21 V. In comparison, the maximum baseline fluctuation of 800 ADC units corresponds to approximately 0.64 V. This separation indicates that the selected threshold can reduce the possibility of false detection caused by low-amplitude noise or non-impact fluctuations.
An impact event was considered successfully detected when at least one piezoelectric sensor generated a peak ADC value exceeding the predefined threshold of 1500 ADC units. For each impact event, the sensor with the highest ADC value was identified as the primary response, while other activated sensors within the same event were considered secondary responses caused by impact energy propagation.
The impact detection success rate was calculated using Eq. (11). Based on the experimental results, all 40 ballistic impact events generated peak ADC responses above the predefined threshold. Therefore, the detection success rate was obtained as follows:
Detection Success Rate $=\frac{40}{40} \times 100 \%=100 \%$
These results confirm that the proposed system is capable of reliably detecting all impact events under the experimental conditions.
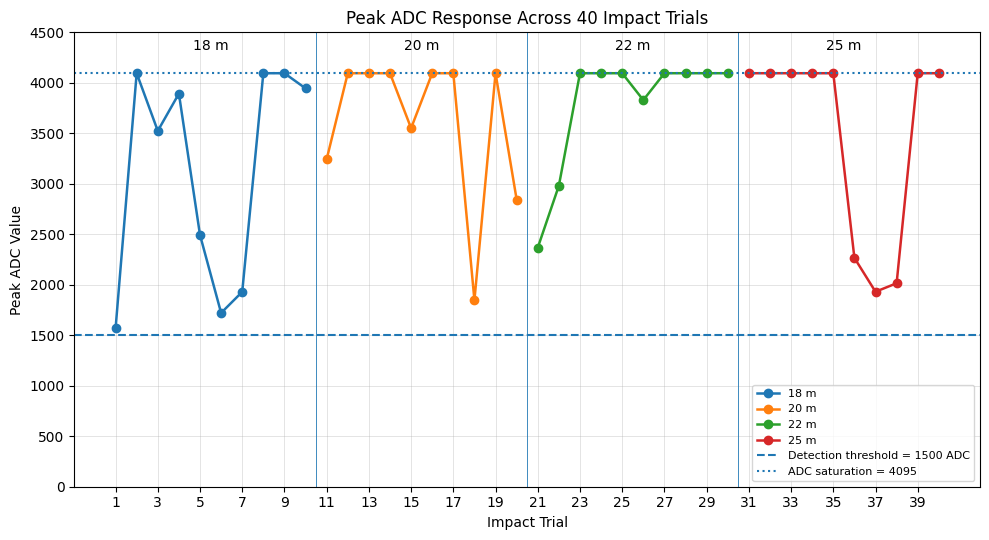
Figure 4. Peak analog-to-digital converter (ADC) response of detected impact events across 40 ballistic trials at shooting distances of 18 m, 20 m, 22 m, and 25 m
Figure 4 presents the peak ADC responses obtained from all 40 ballistic impact trials. As shown in the figure, all impact events produced peak ADC values above the detection threshold of 1500 ADC units, confirming that no missed detection occurred during the experiments. Several trials reached the ADC saturation value of 4095, indicating that high-energy impact signals were successfully limited by the signal conditioning circuit without exceeding the ADC acquisition range.
Overall, the proposed system achieved a 100% impact detection success rate under the tested ballistic impact conditions. However, this value represents the detection success rate for actual impact events, not a complete classification accuracy. Further evaluation under longer no-impact conditions and various environmental disturbance scenarios is recommended to quantify the false positive rate more comprehensively.
4.2 Impact localization analysis
In addition to evaluating detection performance, the system was further analyzed based on its capability to determine impact locations and the spatial distribution of impact energy.
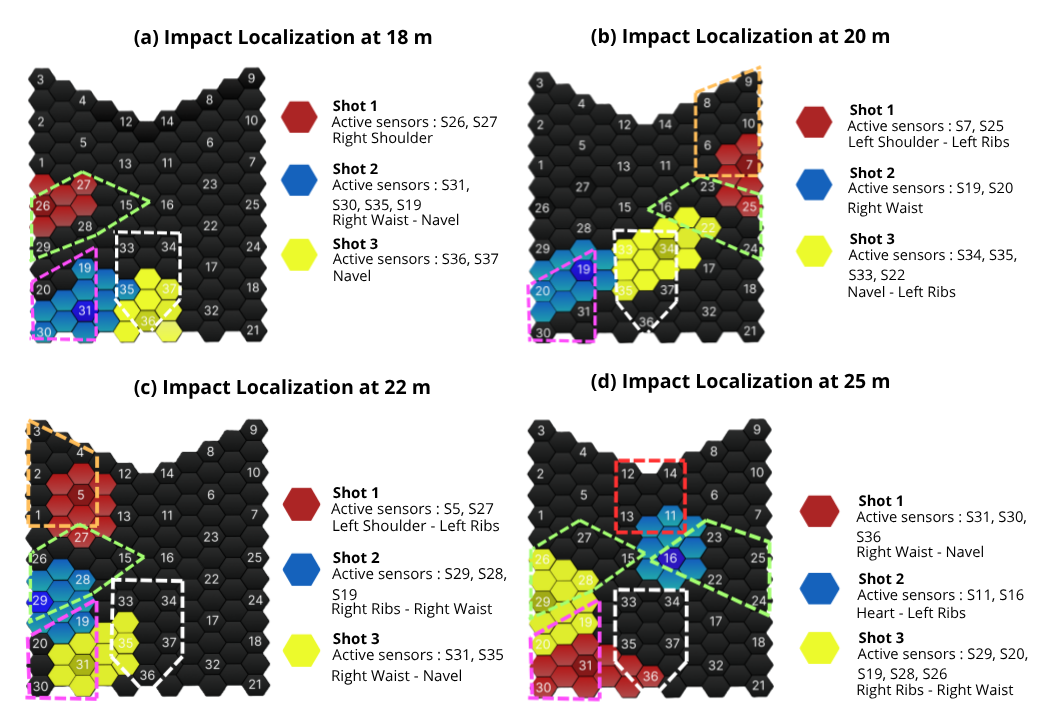
The localization analysis was performed by identifying the sensor with the highest amplitude as the primary sensor, representing the impact center. Meanwhile, other sensors activated around the primary point were categorized as secondary sensors, indicating the affected area (impact effect) caused by the propagation of impact energy.
The impact localization results at various shooting distances are presented in Figure 5, illustrating the distribution of sensor activations at distances of 18 m, 20 m, 22 m, and 25 m. Each color in the figure represents a different impact event, allowing the activation patterns among shots to be visually analyzed.
To maintain visualization clarity, Figure 5 presents only several representative shots at each distance, while the complete dataset from all 40 trials was still utilized in the overall system performance analysis.
Based on Figure 5, the system is capable of identifying impact locations across various vest zones, including the waist, navel, ribs, and shoulder regions. The detected primary sensor indicates the center of impact, whereas the activation of surrounding secondary sensors reflects the propagation of mechanical energy from the impact point to adjacent areas. These results demonstrate that the system can effectively distinguish the primary impact center from the surrounding energy propagation effects.
In several impact events, more than one sensor was activated simultaneously, indicating a multi-sensor activation phenomenon caused by impact energy propagation. This pattern provides a more comprehensive representation of energy distribution compared to single-sensor-based detection systems.
Furthermore, the sensor activation patterns exhibit variations across different shooting distances. At shorter distances, the distribution of activated sensors tends to be wider, whereas at longer distances, the sensor activation becomes more localized due to the reduced impact energy received.
These results demonstrate that the SmartVest system is not only capable of detecting impact events, but also of providing a spatial representation of impact energy distribution. Therefore, the system can be utilized as a real-time piezoelectric sensor-based impact mapping solution.
Nevertheless, under lower impact energy conditions, the number of activated secondary sensors tends to decrease. This indicates that the system sensitivity to energy distribution is still influenced by the magnitude of the impact energy received by the sensors, which remains an aspect for further improvement in future studies.
4.3 Scanning performance
Scanning performance is one of the critical aspects of the proposed system because the signals generated by piezoelectric sensors exhibit transient characteristics with extremely short durations. Therefore, the analog multiplexer-based sequential scanning mechanism needs to provide sufficient temporal response to support the acquisition of transient impact signals.
The implemented acquisition system consists of 37 piezoelectric sensor channels connected through three analog multiplexers with a channel configuration of 16, 16, and 5 channels. During sequential acquisition, a programmed delay of 120 µs is applied after each channel reading. Therefore, the accumulated contribution of the programmed inter-channel delay for 37 channels is 4.44 ms. In addition, a 5 ms peak detection window is implemented to capture and process transient impact responses.
This relationship demonstrates that the number of sensor channels directly affects the temporal burden of sequential acquisition. For the implemented 37-channel configuration, the programmed inter-channel delay contributes 4.44 ms to the acquisition process. The experimental activation timestamps presented in Table 6 are therefore interpreted in relation to the programmed acquisition parameters rather than as a direct measurement of the complete scan-cycle duration.
Table 6. Timing parameters of the implemented acquisition system
|
Timing Parameter |
Symbol/Formula |
Value |
|
Number of sensor channels |
— |
37 channels |
|
Number of multiplexers |
— |
3 |
|
MUX channel configuration |
— |
16 + 16 + 5 |
|
Programmed inter-channel delay |
$T_{delay}$ |
120 µs/channel |
|
Accumulated programmed delay contribution |
37 × 120 μs |
4.44 ms |
|
Peak detection window |
$T_{peak}$ |
5 ms |
|
Resistor–capacitor (RC) time constant |
$\tau=R_{e q} C$ |
50 ms |
The RC interface also affects the temporal response of the conditioned piezoelectric signal. The implemented circuit uses two 1 MΩ resistors and a 100 nF capacitor. Considering the two resistors as the resistive path seen by the capacitor, the equivalent resistance is approximately 500 kΩ, resulting in an RC time constant of approximately 50 ms. This time constant provides temporal persistence of the conditioned signal during the sequential acquisition process.
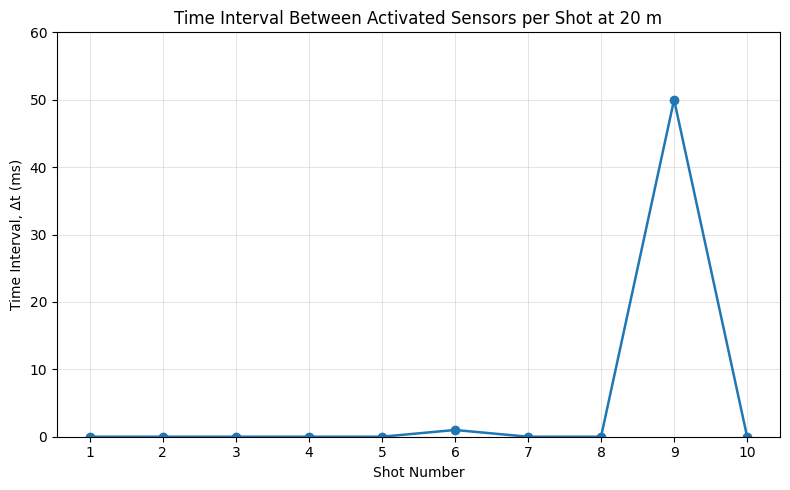
The calculated RC time constant is directly related to the temporal behavior observed during the multi-sensor acquisition test. With an RC time constant of approximately 50 ms, the conditioned signal is expected to persist for a longer duration than the original short-duration piezoelectric pulse. This temporal persistence provides an opportunity for the sequential acquisition process to detect the signal when the corresponding sensor channel is accessed. The experimentally recorded multi-sensor activation intervals in Table 7 provide an observation of this temporal behavior, with most sensor activations occurring within 0–1 ms and the maximum recorded interval reaching 50 ms.
Reliable acquisition of transient impact signals depends on whether the conditioned signal remains detectable when the corresponding sensor channel is accessed during sequential scanning. In the implemented system, the temporal response is influenced by both the programmed inter-channel delay and the RC conditioning circuit. Therefore, the recorded multi-sensor activation timestamps are used as an experimental indicator of the temporal distribution of the detected impact responses.
To evaluate the scanning-related response of the system, experimental data obtained at a shooting distance of 20 m were used as a representative scenario. This distance was selected because the recorded data showed multi-sensor activation across several areas of the vest surface. The number of activated sensors and the time interval between the first and last recorded sensor activation within each impact event are summarized in Table 7.
Table 7. Multi-sensor activation and time spread per shot at 20 m
|
Shot |
Active Sensors (IDs) |
Δt (ms) |
|
1 |
S7, S25 |
0 |
|
2 |
S35, S33 |
0 |
|
3 |
S35, S19 |
0 |
|
4 |
S35, S36 |
0 |
|
5 |
S26, S1 |
0 |
|
6 |
S16, S15 |
1 |
|
7 |
S19, S20 |
0 |
|
8 |
S33, S35 |
0 |
|
9 |
S34, S35, S33, S22 |
50 |
|
10 |
S4, S3 |
0 |
Based on Table 7, several impact events activated more than one sensor within a single shooting event. At a shooting distance of 20 m, the maximum number of activated sensors was four, as observed in shot 9. This result indicates that the system was able to record multiple sensor responses within the same impact event. Meanwhile, across all 40 experimental trials conducted at different shooting distances, the maximum number of activated sensors was 5, as summarized in Section 4.7.
Furthermore, the recorded time interval between activated sensors, denoted as Δt, was generally close to 0 ms for most shots. Only shot 6 produced a Δt of 1 ms, while shot 9 produced the maximum observed Δt of 50 ms. These results show that multiple sensor activations were recorded within a short temporal interval for most impact events, indicating that the system could record distributed sensor responses within the same impact event spatially.
Figure 6 illustrates the time spread between the first and last recorded sensor activations for each impact event at a shooting distance of 20 m. Most events exhibited a Δt close to 0 ms, while the maximum observed value was 50 ms in shot 9. This result indicates that the system was able to record multiple sensor activations with different temporal spreads within an impact event.
It should be noted that the Δt value represents the time spread between recorded sensor activations rather than the direct hardware scanning time of the multiplexer. Therefore, Δt is used only as an experimental indicator of the temporal distribution of multi-sensor responses. The timing analysis in this study is based on the implemented acquisition parameters and experimentally recorded sensor activation timestamps. Direct hardware-level measurements of multiplexer switching time, complete scan-cycle duration, ADC acquisition interval, and end-to-end detection latency were not performed and are therefore not presented as measured quantitative results. Direct measurement using an oscilloscope or logic analyzer is recommended for future work to further quantify the hardware-level timing performance.
Figure 6. Time interval between activated sensors per shot at 20 m shooting distance
4.4 Signal conditioning effectiveness
The effectiveness of the signal conditioning circuit was evaluated based on the peak voltage values generated by the piezoelectric sensors under various shooting distance conditions. A summary of the minimum, maximum, and average voltage values is presented in Table 8.
Table 8. Summary of peak voltage across shooting distances
|
Distance |
Min Voltage (V) |
Max Voltage (V) |
Average Voltage (V) |
Standard Deviation, σ |
|
18 m |
1.26 |
3.30 |
2.53 |
0.58 |
|
20 m |
1.49 |
3.30 |
2.91 |
0.52 |
|
22 m |
1.91 |
3.30 |
3.05 |
0.39 |
|
25 m |
1.56 |
3.30 |
2.81 |
0.52 |
Based on Table 8, all measured voltage values remain within the safe operating range of the microcontroller ADC, namely below 3.3 V. This indicates that the voltage protection mechanism operates effectively in suppressing voltage spikes generated by high-energy impact events. Theoretically, the output voltage is limited by the characteristics of the Zener diode, such that the maximum measured voltage can be approximated by the clamping voltage, as expressed in Eq. (13):
$V_{\text {clamp}} \approx V_{\text {zener}} \approx 3.3 \mathrm{~V}$ (13)
This condition is further supported by the measurement results, which show saturation at the maximum ADC value, indicating that the signal reached the acquisition limit without exceeding the safe operating range of the system.
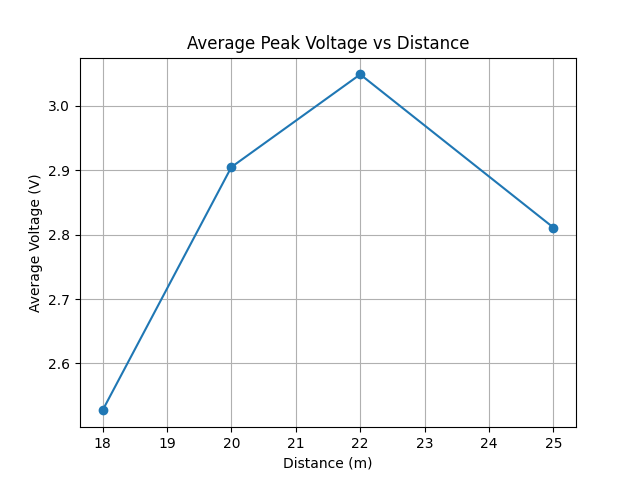
Figure 7 illustrates the relationship between the shooting distance and the average peak voltage generated by the sensors. The graph shows that the voltage values remain relatively stable across different distance variations, without significant degradation. This indicates that the quality of the received signals is well maintained despite variations in impact energy.
In addition, during several impact events, the measured voltage values approached the maximum ADC limit. This indicates that the system is capable of consistently capturing high-energy impact signals.
Figure 7. Graph of average peak voltage vs. distance
These results are also consistent with the findings presented in Section 4.3, where multiple sensors could be detected almost simultaneously within a single impact event. This indicates that the transient signals remain sufficiently detectable throughout the scanning process.
Overall, the implemented signal conditioning circuit is capable of maintaining the stability of the piezoelectric sensor output signals, allowing them to be properly processed by the microcontroller under all testing distance variations. Nevertheless, the occurrence of several voltage values reaching the maximum ADC limit suggests that improving the signal acquisition resolution may be considered for future system development.
4.5 Sensor array response
The sensor array response was analyzed to evaluate how the system detects impact locations across different areas of the vest surface. During the experiments, the activated sensors were not always located at the same positions, but instead depended on the impact location generated by each shot. The distribution of sensor activation counts based on body zones is summarized in Table 9.
Table 9. Distribution of primary impact zones across body regions
|
Body Zone |
Activation Count |
|
Shoulder |
6 |
|
Ribs |
8 |
|
Navel |
14 |
|
Waist |
11 |
|
Heart |
1 |
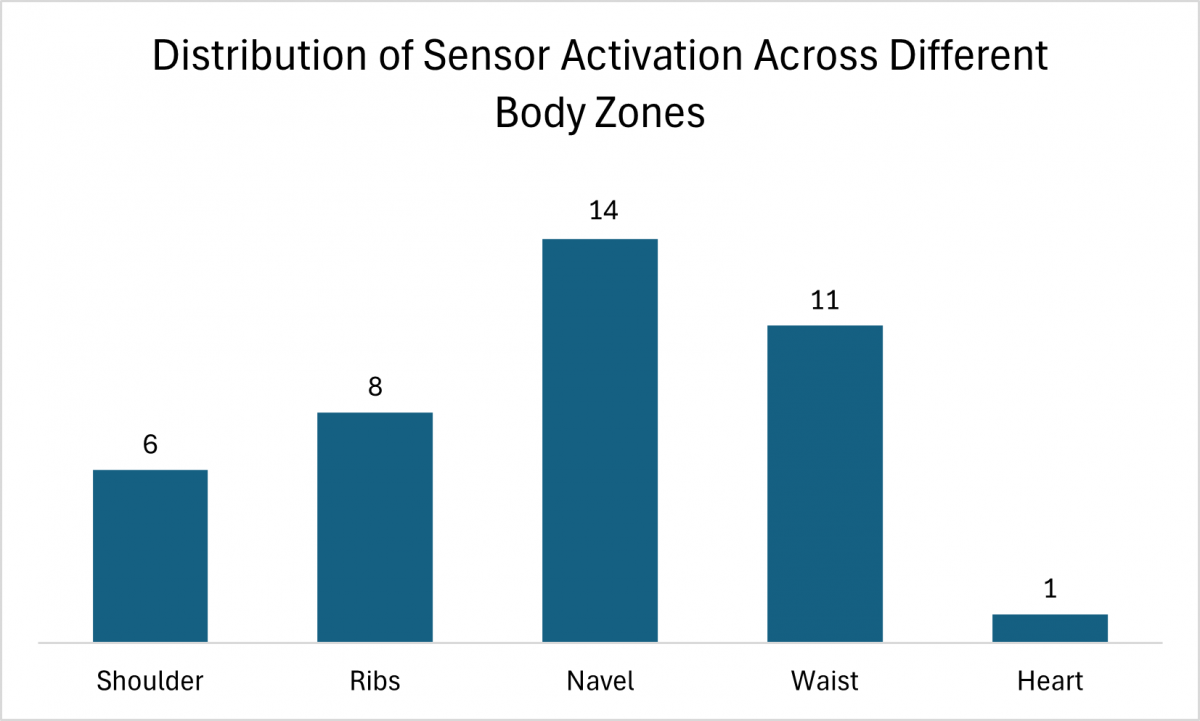
Based on Table 9, sensor activations are distributed across all vest surface zones, with the highest number of activations occurring in the navel area, followed by the waist and ribs regions. To provide a more quantitative analysis, this distribution can be expressed as the percentage of activations relative to the total number of events. The activation percentage can be defined as shown in Eq. (14):
Activation Percentage $=\frac{N_{\text {activation }}}{N_{\text {tatal }}} \times 100 \%$ (14)
In addition, several impact events resulted in the simultaneous activation of multiple sensors. This condition indicates that the impact energy is not only received by a single sensor, but also propagates to neighboring sensors. Such activation patterns represent the impact effect, where the primary sensor indicates the impact center, while the additional activated sensors (secondary sensors) describe the energy distribution across the surrounding area.
The distribution of sensor activations across each zone is also illustrated in Figure 8. The graph shows that the sensor responses are not concentrated in a single area, but rather distributed across multiple regions of the vest surface.
Figure 8. Distribution of sensor activation across different body zones
These results indicate that the implemented sensor array configuration is capable of uniformly recording impact locations across various areas of the vest surface. Therefore, the system is not only able to detect the occurrence of impacts, but also capable of providing more specific information regarding the impact location.
Overall, the experimental results demonstrate that the sensor array utilized in the SmartVest operates consistently in detecting the spatial distribution of impact locations across the entire observation area. This capability supports the implementation of the system as a wearable device for real-time impact monitoring.
4.6 Signal stability across shooting distances
The effect of shooting distance variation on the system response was analyzed to evaluate the stability of signal acquisition under different testing conditions. The analysis was conducted using the average peak voltage values obtained at each shooting distance. The relationship between shooting distance and average peak voltage is illustrated in Figure 7.
Based on the obtained results, the average peak voltage values at each shooting distance remain within a relatively stable range. Although slight voltage variations are observed among the testing distances, these changes do not exhibit a significant decreasing trend as the shooting distance increases. This indicates that the system is capable of maintaining impact detection sensitivity under various testing conditions.
The highest average voltage value was obtained at a shooting distance of 22 m, while slight decreases were observed at distances of 18 m and 25 m. The observed variations may also be affected by differences in impact location and impact conditions among individual trials.
To further strengthen the signal stability analysis, the standard deviation (σ) was computed for each shooting distance using Eq. (15) to quantify the level of data variation relative to the average value. The statistical summary across all four shooting distances is presented in Table 8.
As shown in Table 8, the standard deviation values across the four shooting distances range from 0.39 V to 0.58 V, indicating a relatively consistent level of variation among repeated impact measurements. The lowest standard deviation was observed at 22 m (σ = 0.39 V), while the highest was observed at 18 m (σ = 0.58 V). These values indicate that the measured peak voltages exhibited some variation across repeated trials, but the variation remained within a relatively limited range under the tested conditions. Importantly, no measured trial at any shooting distance produced a peak voltage below the detection threshold of 1.21 V, indicating that all tested impact events generated sufficient signal amplitude for detection.
The average peak voltages ranged from 2.53 V to 3.05 V, corresponding to a maximum difference of 0.52 V across the four tested distances. The mean values did not exhibit a consistent decreasing trend as the shooting distance increased. The observed variations may also be affected by differences in impact location and impact conditions among individual trials. Considering the relatively small difference between the average values and the observed standard deviations, the results indicate that the system maintained relatively stable signal responses across the tested shooting distances. However, these results should be interpreted within the tested distance range and experimental conditions, and they do not establish the absence of a distance-dependent effect under other conditions.
$\sigma=\sqrt{\frac{1}{N} \sum_{i=1}^N\left(V_i-\bar{V}\right)^2}$ (15)
Table 10. Threshold characterization under different operating conditions
|
No. |
Test Condition |
Observed ADC Range |
Equivalent Voltage Range (V) |
Detection Threshold |
Detection Status |
|
1 |
Stationary |
0–400 |
0.00–0.32 |
1500 (1.21 V) |
Not detected |
|
2 |
Slow walking while wearing SmartVest |
400–1200 |
0.32–0.97 |
1500 (1.21 V) |
Not detected |
|
3 |
Light impact (manual strike) |
1500–2000 |
1.21–1.61 |
1500 (1.21 V) |
Detected |
|
4 |
Live-fire test shooting |
2001–4095 |
1.61–3.30 |
1500 (1.21 V) |
Detected |
Note: ADC = analog-to-digital converter.
Overall, the experimental results demonstrate that the developed system is capable of maintaining stable signal responses across all shooting distance variations. This indicates that the implemented sensor array configuration and signal acquisition circuit are sufficiently reliable to support impact detection in the wearable-based SmartVest system.
To further evaluate the robustness of the detection threshold, additional tests were conducted under several operating conditions, including a stationary condition, slow walking while wearing the SmartVest, light impact, and test shooting. The objective of this evaluation was to determine whether low-intensity wearable motion could trigger impact detection. The experimental results are summarized in Table 10.
The results show that the stationary condition generated ADC values between 0 and 400 (0.00–0.32 V), while slow walking while wearing the SmartVest produced values ranging from 400 to 1200 ADC (0.32–0.97 V). Both conditions remained below the predefined detection threshold of 1500 ADC (1.21 V) and therefore did not trigger impact detection. In contrast, light impact and test shooting generated ADC responses satisfying ADC ≥ 1500, resulting in impact detection.
These results indicate that the selected threshold can distinguish the tested low-intensity wearable motion from impact events. In particular, the slow-walking test demonstrates that normal low-intensity movement of the SmartVest did not produce an ADC response sufficient to trigger impact detection under the tested conditions.
4.7 System performance summary
Based on all experimental results and analyses conducted, the SmartVest system demonstrates consistent and reliable performance in detecting impact events in real time. A summary of the system performance is presented in Table 11 to provide a quantitative overview of the capabilities of the proposed system.
Table 11. Summary performance
|
Parameter |
Value |
|
Impact detection success rate |
100% |
|
Max sensors detected |
5 |
|
Max Δt |
50 ms |
|
Voltage range |
1.26–3.30 V |
|
Average voltage |
2.82 V |
|
ADC saturation |
Yes |
|
Missed impact events |
None |
|
Monitoring operation |
Real-time |
Note: ADC = analog-to-digital converter.
Based on Table 11, all impact events were successfully detected throughout the testing process, and no missed impact events were observed under the tested experimental conditions. This result indicates that the implemented acquisition architecture was able to capture the evaluated impact events using the current 37-sensor configuration. However, this observation does not establish that signal loss would not occur under longer scanning sequences, rapid consecutive impacts, or more complex operating conditions.
In addition, the system was capable of detecting up to five sensors simultaneously within a single impact event, demonstrating its ability to capture the spatial propagation of impact energy. The maximum recorded activation ($\Delta t$) of 50 ms provides an experimental observation of the temporal distribution of multi-sensor responses. However, this value does not represent the complete hardware scanning time. The observed activation intervals are therefore interpreted together with the programmed acquisition parameters and the RC time constant to characterize the temporal behavior of the implemented system.
From the signal perspective, the measured voltage range was between 1.26 V and 3.30 V, with an average value of 2.82 V. These values indicate that the generated signals are sufficiently strong for processing while still remaining within the safe operating limits of the system. The occurrence of ADC saturation during several experiments further demonstrates that the voltage protection circuit effectively limits the signal to the maximum allowable level.
Furthermore, the absence of missed impact events under the tested conditions indicates that the integrated sensing, signal conditioning, and data acquisition system successfully detected the evaluated impact events. Overall, these results demonstrate that the proposed system is capable of detecting impact events with a 100% detection success rate under the tested conditions and exhibits stable, responsive, and safe performance for real-time wearable-based impact monitoring applications.
4.8 Discussion
Although the experimental results demonstrate reliable performance under the tested conditions, it is important to acknowledge the expected system behavior under several practical operating scenarios that were not directly evaluated in this study.
First, regarding rapid consecutive impacts occurring within a short time interval, the system's ability to capture such events depends on the relationship between the RC time constant (τ), the conditioned signal duration, and the sequential acquisition process. If two impacts occur within a sufficiently short interval, their detectability depends on whether the corresponding sensor signals remain above the detection threshold when their channels are accessed. Multiple impacts may therefore be captured when the conditioned signals remain detectable during sequential acquisition. However, an impact occurring after the conditioned signal has decayed and before the corresponding channel is accessed again may not be detected. This limitation becomes more critical as the number of sensors increases and the acquisition burden increases.
The relationship between the RC time constant and sequential acquisition can also be interpreted from the implemented circuit parameters. With an equivalent resistance of approximately 500 kΩ and a 100 nF capacitor, the calculated RC time constant is approximately 50 ms. This value indicates that the conditioned signal can persist for a measurable period after the initial impact, increasing the opportunity for the sequential acquisition process to detect the signal when the corresponding sensor channel is accessed. The experimentally observed multi-sensor activation intervals in Table 7 provide an experimental observation of the temporal distribution of detected responses. These observations can be discussed in relation to the calculated RC time constant, although the activation intervals should not be interpreted as direct measurements of the RC decay or the complete scanning cycle.
Second, regarding external vibrations and environmental disturbances, the current system relies on a fixed detection threshold of 1500 ADC units (approximately 1.21 V) to distinguish valid impact events from background noise. Under controlled testing conditions, the baseline noise fluctuated within 200–800 ADC units (0.16–0.64 V), providing a sufficient margin above the noise floor. However, in environments with persistent mechanical vibrations, electromagnetic interference, or body movement artifacts, the baseline noise level may increase, potentially causing false positive detections or requiring adaptive threshold adjustment. The current design does not implement dynamic threshold adaptation, which represents a limitation for deployment in highly dynamic operational environments.
Third, regarding system scalability, the proposed architecture currently employs three CD74HC4067 multiplexers to manage 37 sensing channels through three ADC input pins. Expanding the sensor array beyond the current configuration would require additional multiplexer units and potentially longer scanning cycles, which may violate the condition $T_{signal}>T_{\{scan \}}$ for very short-duration transients. Therefore, future system designs should incorporate scanning speed optimization, parallel acquisition channels, or event-driven triggering mechanisms. In addition, future developments should include direct measurement of channel reading time $T_{\{read\}}$, total scanning cycle $T_{\{scan\}}$, and end-to-end detection latency using dedicated oscilloscope instrumentation. Overall, the identified limitations—including the absence of rapid consecutive impact testing, the use of a fixed detection threshold, and the lack of direct timing measurements—define the scope of the current evaluation and indicate clear directions for future work.
The system also demonstrates multi-sensor activation capability within a single impact event. This phenomenon reflects the propagation of mechanical energy throughout the sensor array, enabling the system not only to detect the primary impact location, but also to identify the surrounding affected areas. This capability confirms that the system can perform spatial sensing, providing more comprehensive information compared to conventional single-point detection systems. Despite its various advantages, several limitations were also identified. The occurrence of ADC saturation during high-energy impacts indicates that the current resolution still limits the system’s capability to distinguish higher impact energy levels. In addition, the use of a sequential scanning method introduces a dependency between the number of sensors and the total acquisition time. As the number of sensors increases, optimization of the scanning speed or the implementation of parallel acquisition methods will be required to maintain real-time performance. Therefore, future developments may focus on improving the acquisition architecture to overcome these limitations.
Overall, the results of this study demonstrate that the proposed system is capable of achieving a balance between hardware simplicity and reliable real-time performance, although opportunities for further improvement still remain.
This study presents a wearable multi-sensor impact detection system based on a 37-channel piezoelectric sensor array and a sequential multiplexed acquisition method. In addition to the hardware implementation, the acquisition process was analytically characterized using the RC time constant and sequential acquisition parameters to examine the temporal behavior of conditioned piezoelectric signals. The analytical considerations were used to support the interpretation of the experimentally observed sensor responses and multi-sensor activation timing.
The experimental results demonstrate that all impact events were successfully detected under the conducted testing conditions. The system was capable of identifying the primary impact location as well as the distribution of impact effects through multi-sensor activation. Furthermore, the measured voltage values remained within the safe operating limits of the ADC, supporting the effectiveness of the implemented signal conditioning circuit.
The calculated RC time constant and the programmed sequential acquisition parameters provide an analytical basis for interpreting the temporal behavior of the acquisition system. The RC time constant describes the persistence of the conditioned transient signal, while the sequential acquisition parameters characterize the temporal burden associated with accessing the 37 sensor channels. These analytical considerations are complemented by the experimentally recorded multi-sensor activation intervals presented in the scanning analysis. Direct hardware-level measurements of complete scan-cycle time and end-to-end detection latency were not performed and therefore remain subjects for future validation. The proposed system exhibited stable performance across various shooting distances, indicating its robustness against variations in testing conditions. The integration of multiplexing techniques and signal conditioning enables efficient acquisition of data from multiple sensors without significantly increasing system complexity.
Future developments will focus on improving ADC resolution, optimizing scanning speed, enhancing system scalability, and further validating the relationship between transient signal duration and multiplexed acquisition timing through direct hardware-level measurements.
The authors would like to express their gratitude to Telkom University for its support in providing research facilities and resources. The authors also sincerely acknowledge the STAS RG Center of Excellence at Telkom University for its technical support, assistance in data collection, and provision of research equipment. Appreciation is also extended to all parties involved in the testing process of this study.
|
ADC |
Analog-to-digital converter |
|
C |
Sensor capacitance, F |
|
d |
Piezoelectric coefficient, C·N⁻¹ |
|
f{scan} |
System scanning frequency, Hz |
|
N |
Total number of sensors |
|
Q |
Electric charge, C |
|
R |
Resistance, Ω |
|
SNR |
Signal-to-noise ratio, dimensionless |
|
T{read} |
Channel reading time, s |
|
T{scan} |
Total scanning time, s |
|
Tsignal |
Transient signal duration, s |
|
V |
Output voltage, V |
|
Vclamp |
Clamped voltage, V |
|
Vn |
Noise voltage amplitude, V |
|
Vref |
Reference voltage, V |
|
Vs |
Signal voltage amplitude, V |
|
Vzener |
Zener breakdown voltage, V |
|
Greek symbols |
|
|
τ |
RC time constant, s |
|
σ |
Standard deviation |
|
Δt |
Time interval between sensor activations, s |
|
Subscripts |
|
|
clamp |
Clamped |
|
detected |
Detected |
|
total |
Total |
|
n |
Noise |
|
scan |
Scanning |
|
s |
Signal |
|
zener |
Zener |
[1] Sun, Y., Li, C., Xu, Z., et al. (2024). High-accuracy recognition triboelectric nanogenerator system for shooting report and ballistic analysis. Advanced Functional Materials, 35(17): 2419100. https://doi.org/10.1002/adfm.202419100
[2] Zotov, V., Kramkowski, E. (2022). Moving-target intelligent tutoring system for marksmanship training. International Journal of Artificial Intelligence in Education, 33(4): 817-842. https://doi.org/10.1007/s40593-022-00308-z
[3] Sarswat, D. (2024). Real-time AI driven shooting posture assessment and correction for professional and military training using machine learning, OpenCV, and MediaPipe. In 2024 4th International Conference on Technological Advancements in Computational Sciences (ICTACS), Tashkent, Uzbekistan, pp. 1192-1198. https://doi.org/10.1109/ICTACS62700.2024.10841101
[4] Biggs, A., Huffman, G., Hamilton, J., et al. (2023). Small arms combat modeling: a superior way to evaluate marksmanship data. Journal of Defense Analytics and Logistics, 7(1): 69-87. https://doi.org/10.1108/jdal-11-2022-0012
[5] Wang, G., Li, Y. (2025). Research and implementation of high-precision impact point localization method using a novel double T-shaped sensor array. Measurement, 262: 120044. https://doi.org/10.1016/j.measurement.2025.120044
[6] Wu, Y., Ma, Y., Zheng, H., Ramakrishna, S. (2021). Piezoelectric materials for flexible and wearable electronics: A review. Materials & Design, 211: 110164. https://doi.org/10.1016/j.matdes.2021.110164
[7] Jung, Y.H., Pham, T.X., Issa, D., et al. (2022). Deep learning-based noise robust flexible piezoelectric acoustic sensors for speech processing. Nano Energy, 101: 107610. https://doi.org/10.1016/j.nanoen.2022.107610
[8] Aabid, A., Parveez, B., Raheman, A., et al. (2021). A review of piezoelectric material-based structural control and health monitoring techniques for engineering structures: Challenges and opportunities. Actuators, 10(5): 101. https://doi.org/10.3390/act10050101
[9] Cho, K.H., Lee, J., Yun, S., et al. (2026). Hyperpacked piezoelectric-powered capacitive sensor array for high-fidelity vibration detection. Nature Sensors, 1(1): 73-84. https://doi.org/10.1038/s44460-025-00003-1
[10] Capineri, L., Bulletti, A. (2021). A versatile analog electronic interface for piezoelectric sensors used for impacts detection and positioning in Structural Health Monitoring (SHM) Systems. Electronics, 10(9): 1047. https://doi.org/10.3390/electronics10091047
[11] Zhen, L., Cui, M., Bai, X., et al. (2024). Thin, flexible hybrid-structured piezoelectric sensor array with enhanced resolution and sensitivity. Nano Energy, 131: 110188. https://doi.org/10.1016/j.nanoen.2024.110188
[12] Mutiara, G.A., Periyadi, P., Agnas, A.D., Darma, V. (2020). Smart vest and monitoring system for airsoft sport-games using vibration sensor. International Journal of Computing, 19(2): 173-180. https://doi.org/10.47839/ijc.19.2.1759
[13] Liu, Z., Kong, J., Qu, M., Zhao, G., Zhang, C. (2022). Progress in data acquisition of wearable sensors. Biosensors, 12(10): 889. https://doi.org/10.3390/bios12100889
[14] Hu, J., Liu, C., Wang, X., et al. (2024). A positioning alarm system for explosive impact debris protective suit based on an accelerometer array. Sensors, 24(14): 4587. https://doi.org/10.3390/s24144587
[15] Fu, R., Zhong, X., Xiao, C., et al. (2023). A stretchable, biocompatible, and self-powered hydrogel multichannel wireless sensor system based on piezoelectric barium titanate nanoparticles for health monitoring. Nano Energy, 114: 108617. https://doi.org/10.1016/j.nanoen.2023.108617
[16] Zhang, Y., Wu, X., Guo, Q., et al. (2025). Advances in sensors technologies for composites structural health monitoring. Composite Structures, 370: 119448. https://doi.org/10.1016/j.compstruct.2025.119448
[17] Wang, Z., Zhong, Y. (2024). Finite element simulation and piezoelectric sensor array-driven two-stage impact location on composite structures. Processes, 12(12): 2675. https://doi.org/10.3390/pr12122675
[18] Liu, J., Hei, C., Luo, M., Yang, D., Sun, C., Feng, A. (2022). A study on impact force detection method based on piezoelectric sensing. Sensors, 22(14): 5167. https://doi.org/10.3390/s22145167
[19] Mangi, M.A., Elahi, H., Ali, A., et al. (2025). Applications of piezoelectric-based sensors, actuators, and energy harvesters. Sensors and Actuators Reports, 9: 100302. https://doi.org/10.1016/j.snr.2025.100302
[20] Ebata, T., Ochi, A., Sakai, I., et al. (2024). A 16-bit SAR ADC with capacitor dielectric relaxation effect canceler in a 22-nm microcontroller for multi-input channel applications. In 2024 IEEE Asian Solid-State Circuits Conference (A-SSCC), Hiroshima, Japan, pp. 1-3. https://doi.org/10.1109/A-SSCC60305.2024.10849003
[21] Karbari, S.R., Mohanram, S., Sriniketh, S., Kumari, M. U., Shireesha, G. (2021). Signal conditioning circuits for low vibration signals using an array of piezoelectric sensors. Materials Today: Proceedings, 46: 2212-2220. https://doi.org/10.1016/j.matpr.2021.03.213
[22] Li, W., Liu, X., Wang, Y., et al. (2024). Research on high sensitivity piezoresistive sensor based on structural design. Discover Nano, 19(1): 1-20. https://doi.org/10.1186/s11671-024-03971-4
[23] Capineri, L., Bulletti, A., Merlo, E.M. (2021). Multichannel real-time electronics platform for the estimation of the error in impact localization with different piezoelectric sensor densities. Applied Sciences, 11(9): 4027. https://doi.org/10.3390/app11094027
[24] Zhao, Z., Wang, Z., He, L., Yokota, H., Okada, Y., Narita, F. (2024). Local impact sensing via flexible piezoelectric composite film based on highly elastic resin. Sensors and Actuators A: Physical, 368: 115089. https://doi.org/10.1016/j.sna.2024.115089
[25] Ku, P., Lu, M.S. (2025). CMOS-integrated flexible piezoelectric sensor arrays for high-resolution spatiotemporal tactile sensing. IEEE Sensors Journal, 25(15): 28156-28163. https://doi.org/10.1109/jsen.2025.3582903
[26] Yue, R., Ramaraj, S.G., Liu, H., et al. (2022). A review of flexible lead-free piezoelectric energy harvester. Journal of Alloys and Compounds, 918: 165653. https://doi.org/10.1016/j.jallcom.2022.165653
[27] Ali, G., Mohd-Yasin, F. (2024). Comprehensive noise modeling of piezoelectric charge accelerometer with signal conditioning circuit. Micromachines, 15(2): 283. https://doi.org/10.3390/mi15020283
[28] Hiremath, S., Kim, T. (2024). Detection of physical signal and time-frequency analysis owing to the impact on rubber material using a piezoelectric sensor. Journal of Mechanical Science and Technology, 38(5): 2455-2463. https://doi.org/10.1007/s12206-024-0424-2
[29] Romanssini, M., Compassi-Severo, L., de Aguirre, P.C.C., Girardi, A.G. (2023). Design of a low-noise signal conditioning circuit for analog MEMS accelerometers. In 2023 7th International Symposium on Instrumentation Systems, Circuits and Transducers (INSCIT), Rio de Janeiro, Brazil, pp. 1-5. https://doi.org/10.1109/INSCIT59673.2023.10258504
[30] Shaw, A., Kumari, A., Kumar, H.P.S., Kar, S.K., Dutta, A., Kundu, S. (2024). Design considerations of signal acquisition circuit development for piezoelectric pressure sensor. In 2024 IEEE 21st India Council International Conference (INDICON), Kharagpur, India, pp. 1-5. https://doi.org/10.1109/INDICON63790.2024.10958356
[31] Wu, N., Bao, B., Wang, Q. (2021). Review on engineering structural designs for efficient piezoelectric energy harvesting to obtain high power output. Engineering Structures, 235: 112068. https://doi.org/10.1016/j.engstruct.2021.112068
[32] Carluccio, V., Fachechi, L., Mastronardi, V.M., et al. (2023). Fabrication, characterization, and signal processing optimization of flexible and wearable piezoelectric tactile sensors. IEEE Sensors Journal, 23(10): 10959-10969. https://doi.org/10.1109/jsen.2023.3265871
[33] Ghemari, Z., Belkhiri, S., Saad, S. (2024). A piezoelectric sensor with high accuracy and reduced measurement error. Journal of Computational Electronics, 23(2): 448-455. https://doi.org/10.1007/s10825-024-02134-z
[34] Kurul, F., Aydoğan, D., Janat, S., Kırlangıc, I.A., Kaya, H.O., Topkaya, S.N. (2025). Wearable sensors for health monitoring: Current applications, trends, and future directions. Biosensors and Bioelectronics: X, 28: 100727. https://doi.org/10.1016/j.biosx.2025.100727
[35] Liu, Y., Lv, Y., Xue, H. (2023). Intelligent wearable wrist pulse detection system based on piezoelectric sensor array. Sensors, 23(2): 835. https://doi.org/10.3390/s23020835
[36] Kusuma, N., Mahalakshmi, S. (2024). Design and development of signal conditioning circuit for MEMS based piezo-resistive pressure sensor for aerospace and defense applications. Manufacturing Technology Today (MTT), 23(1-2): 20-25. https://doi.org/10.58368/mtt.23.1-2.2024.20-25
[37] Wang, H., Xu, D., Kong, M., et al. (2025). A VFM-based crosstalk suppression circuit with minimized control ports for large-scale piezoresistive sensor arrays using analog multiplexers. IEEE Sensors Journal, 25(18): 34440–34447. https://doi.org/10.1109/jsen.2025.3593490
[38] Wassouf, L., Jamshidpour, E., Frick, V. (2023). Optimization of an SSHC-based full active rectifier for piezoelectric energy harvesting. Analog Integrated Circuits and Signal Processing, 116(3): 145-159. https://doi.org/10.1007/s10470-023-02176-6
[39] Arafa, K.I., Ellaithy, D.M., Zekry, A., Abouelatta, M., Shawkey, H. (2023). Successive approximation register analog-to-digital converter (SAR ADC) for biomedical applications. Active and Passive Electronic Components, 2023: 3669255. https://doi.org/10.1155/2023/3669255