Rahul Krishnan![]() | Vanaja Selvaraj
| Vanaja Selvaraj![]() | Nagarajan Pandian
| Nagarajan Pandian![]() | Sheela Sammandhan
| Sheela Sammandhan![]() | Inam Ullah Khan
| Inam Ullah Khan![]() | Sai Kiran Oruganti*
| Sai Kiran Oruganti*![]()
© 2025 The authors. This article is published by IIETA and is licensed under the CC BY 4.0 license (http://creativecommons.org/licenses/by/4.0/).
OPEN ACCESS
One of the major challenges with managing diabetes is non-invasive measurement and accurate reading. Microwave based measurements, especially Dielectric Resonator Antennas (DRAs) are capable to catch up the variation in blood glucose levels with the variation in tissue permittivity and frequency shift. The aim of this research work is to investigate the proof of concept for non-invasive blood glucose monitoring using a Cylindrical Dielectric Resonator Antenna (DRA). The proposed CDRA operates at a frequency of 4.187 GHz, utilizing a high-dielectric permittivity (εr = 9.9) resonator material. The sensing method involves positioning the patient's thumb over the resonator, where fluctuations in blood permittivity caused by glucose concentration modify the input impedance, resulting in a detectable frequency shift. A three-dimensional (3D) electromagnetic model of the human thumb has been designed and simulated in CST Microwave Studio at 4.75 GHz, utilizing the Cole–Cole dispersion model to examine the interaction between the CDRA sensor and biological tissue. The proposed antenna achieved a simulated gain of 6.509 dBi and a directivity of 6.964 dBi which is very good while compared with microstrip antennas. The frequency shifts associated with differences in permittivity proves the potential for non-invasive detection of glucose level changes. The sensor's sensitivity against Cole-Cole model is estimated to be 1.87 kHz/mg/dL and the estimated sensitivity of aqueous glucose solution is approximately 0.7 MHz/mg/dL. The proposed CDRA-based blood glucose sensing system effectively correlates resonant frequency fluctuations with glucose concentration, revealing significant potential for future incorporation into compact, wearable, and real-time glucose monitoring device.
microwave, non-invasive, glucose monitoring, CDRA, electromagnetic waves (EM), Cole–Cole model
Diabetes is a long-term metabolic disorder with an inability to produce sufficient insulin or an inability to use insulin by the body effectively. The International Diabetes Federation (IDF) estimates that 700 million adults will have diabetes worldwide by 2045 [1]. Diabetes is an ever-more serious issue for healthcare systems globally and is ranked among the great health emergencies of the twenty-first century. In India, in particular, the second-largest population of adults in the world, approximately 77 million are suffering from diabetes. Furthermore, diabetes and its complications are the primary cause of death related to diabetes in South-East Asia, resulting in an estimated one million deaths per year [2]. Successful diabetes management, which is usually accomplished through the main objectives of health systems, calls for frequent monitoring of blood glucose. The pain and discomfort of the procedure usually discourage patients from proceeding with monitoring, potentially weakening disease control. Access to good quality diabetes care is one of the main objectives of health systems [3]. Yet, the rise in prevalence of the disease and the substantial expense of long-term care are putting pressure on the healthcare industry. To handle these challenges, the six basic pillars of healthcare systems need to be improved: management, information systems, access to healthcare, human resources, and delivering services. Non-invasive glucose monitoring devices present a strong substitute in this regard. These technologies offer benefits in terms of patient compliance, portability, ease of use, and user comfort when compared to conventional methods [4]. Antenna-based sensing systems, particularly DRAs, have garnered interest among emerging non-invasive technologies due to DRAs, have garnered interest among the new non-invasive technologies because of their high sensitivity and efficiency at millimeter-wave and microwave frequencies [5-8]. Due to these qualities, they are now used in military radar technologies and small wireless communication systems [9]. In this research, we explore a novel application of DRAs for non-invasive glucose monitoring by leveraging their resonance behavior to detect changes in the dielectric properties of biological tissues that correlate with fluctuations in blood glucose levels. Any change, such as modifications in the electrostatic characteristics of adjacent tissue, can cause the resonant frequency of DRAs to shift. DRAs resonate at particular microwave frequencies. Since these changes can be linked to changes in blood glucose levels, this characteristic makes DRAs attractive options for non-invasive glucose sensing.
Table 1. Comparison of non-invasive microwave glucose monitoring sensors
|
Ref. |
Sensor Type |
Freq. (GHz) |
Sensor Type |
Size (mm) |
Sensitivity / Resolution |
Substrate |
Remarks |
|
[10] |
Cylindrical CPW-fed flexible biosensor |
2.4 / 1.55–1.88 |
Cylindrical CPW |
50.66×60.31 |
7.5 MHz/mg/dL |
Pyralux |
Printable, tested with 25 volunteers |
|
[11] |
Circular CSRR in defected ground microstrip line |
3.1 |
Microstrip with DGS |
60×20 |
0.75 MHz/mg/dL |
FR4 |
Simulated using blood-glucose samples in glass container |
|
[12] |
SRR embedded in BLC coupler sensor |
2.395 |
Patch with SRR |
60×45 |
0.72 MHz/mg/dL |
Rogers |
Compact & sensitive with bio-compatible integration |
|
[13] |
Dual-frequency microwave resonator sensor |
2.4, 5.8 |
Planar Dual Resonator |
30×30 |
∼6.1 MHz/mg/dL |
RT/Duroid |
Designed for fingertip-based detection |
|
[14] |
Modified SIW patch antenna sensor |
1.3 |
SIW Patch |
45.25×53.75 |
9 MHz across range |
Arlon |
Sensitive to a wide dielectric range |
|
This Work |
DRA |
4.187 |
Cylindrical DRA |
60×60×11.59 |
1.87 KHz/mg/dL |
Alumina |
Cole–Cole-based model, 6.5 dBi gain, low loss |
Changes in glucose levels can be detected using these designs, which leverage the sensitivity of resonant frequency shifts to changes in tissue permittivity. Table 1 presents a comparative analysis of the sample microwave sensors provided in the literature. Although many of these methods show promise in terms of resolution, they often have drawbacks, such as being bulky, inefficient, or causing significant losses in biologically interactive several advantages, including DRAs have a number of advantages, such as small dimensions, excellent radiation efficiency, minimal dielectric loss, and considerable gain; these features are particularly useful for wearable or portable biosensing applications. Motivated by these advantages, the current study presents a cylindrical DRA developed specifically for non-invasive glucose detection in the microwave range.
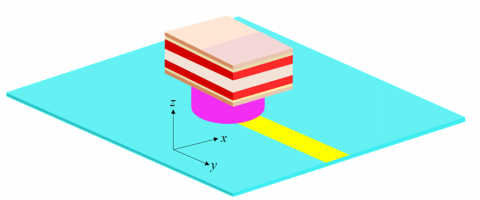
The proposed Cylindrical Dielectric Resonator Antenna (CDRA) structure is composed of four vertically stacked layers, as illustrated in Figure 1 and Figure 2. The bottom-most layer is a ground plane made of annealed copper. Above this lies the dielectric substrate, fabricated from Rogers RT/Duroid 5880 (lossy), known for its low dielectric loss and stable performance at high frequencies. A copper feed patch is positioned on top of the substrate, and the cylindrical dielectric resonator (CDR) is mounted above this, in order to facilitate interaction with a human finger for measurement purposes. As depicted in Figure 3, the overall dimensions of the CDRA are 60 × 60 × 11.59 mm3. The substrate has a dielectric loss tangent of tan $\delta$ = 0.0009 and a relative permittivity of $\varepsilon_r$ = 2.2, and thickness t = 1.52 mm, serves as the mechanical and electrical foundation of the structure. Both the substrate and ground plane have lateral dimensions of 60 × 60 mm, with the ground layer having a thickness of 0.035 mm. The feeding strip, made from annealed copper, is placed on top of the substrate. It measures 4.65 mm in width and 40 mm in length, with the same thickness as the ground layer (0.035 mm). The CDRA is constructed using Alumina (99.5%), a lossy ceramic material has an extremely low loss tangent of tan $\delta$ = 0.0001 and a high relative permittivity of $\varepsilon_r$ = 9.9. It has a radius $a=10 \mathrm{~mm}$ and a height $H=10 \mathrm{~mm}$. The placement of the resonator on the feed structure is shown in Figure 2, and the complete set of physical specifications is summarized in Table 2.
Figure 1. Detailed perspective view of CDRA
Figure 2. Perspective view of CDRA
Figure 3. Front view of CDRA
Table 2. Dimensions of CDRA
|
Parameter |
Width (mm) |
Length (mm) |
Thickness (mm) |
|
Feed Line (Copper) |
40 |
4.65 |
0.035 |
|
Ground Plane |
60 |
60 |
0.035 |
|
Substrate (Rogers RT5880) |
60 |
60 |
1.52 |
|
Resonator (Alumina) |
Cylindrical diameter = 20 |
10 |
|
CST Microwave Studio serves as the platform for the antenna’s design and simulation. The expected resonant frequency of the CDRA operating in the HEM₁₁δ mode can be estimated using the following empirical formula:
$f_{0\left(H E M_{\{11 \delta\}}\right)}=\frac{(c \times 6.324)}{\left(2 \pi a \sqrt{\varepsilon_r+2}\right)} \times\left[0.27+0.36\left(\frac{a}{2 H}\right)+0.02\left(\frac{a}{2 H}\right)^2\right]$ (1)
where:
a – radius of the resonator,
H – height of the resonator,
c – speed of light in vacuum,
$\varepsilon_r$ – relative permittivity of the resonator material.
In order to realistically evaluate the interaction between the proposed antenna and human tissue for non-invasive glucose sensing, a simplified anatomical model of the human thumb was developed and simulated in CST Studio Suite. To evaluate the impact of changes in tissue permittivity, particularly in the blood layer, on the antenna's performance, this EM model is positioned above the dielectric resonator, serving. Nevertheless, the representative biological load. The layered bio-organic materials that comprise human tissue are naturally heterogeneous and exhibit. It employs a layered modeling approach for conceptual clarity and computational efficiency. Despite voxel-based modeling being computationally inefficient, it is frequently used in bio-electromagnetics for high-resolution anatomical simulations. In the context of glucose sensing, the focus is on depicting the pertinent layers that have a major impact on EM wave interaction and propagation. Blood, fat, bone, skin, and nail are the five main layers that comprise the human body model. The estimated average thicknesses found in adult human anatomy are used to model these layers, and that are arranged vertically. The thumb model's overall dimensions of 15 × 25 × 12.3 mm3 provide an accurate scale for near-field antenna interaction.
A key aspect of the simulation is modeling the dielectric response of blood, as its permittivity is known to vary with glucose concentration and frequency. To account for this, the blood layer is represented by means of the Cole-Cole dispersion model, which accurately describes the frequency-dependent behavior of complex permittivity in biological tissues. The remaining layers, skin, fat, bone, and nail, are modeled as homogeneous dielectric materials with fixed permittivity values, based on standard datasets [15, 16]. The structural representation of the 3D EM thumb model is shown in Figure 4, and the detailed EM parameters and thicknesses of each layer are provided in Table 3.
Figure 4. Detailed view of the 3D EM human thumb model created in CST Studio
Table 3. Thickness and dielectric properties of separate layers in the EM model of the human thumb
|
Layer |
Blood |
Nail |
Fat |
Skin |
Bone |
|
Thickness (mm) |
2.5 |
0.3 |
0.5 |
1.0 |
4 |
|
Relative Permittivity ($\varepsilon_r$) |
Cole-Cole |
3 |
5.5 |
30 |
20 |
To accurately simulate the dielectric behavior of biological tissues, particularly blood, across a wide frequency spectrum, the Cole–Cole relaxation model was employed. This model is well established in bio electromagnetics for representing the nonlinear permittivity of heterogeneous biological soft tissue in the microwave and millimeter wave range. In this research, the frequency-dependent dielectric sensitivity of the blood layer in the human thumb model was characterized employing a single-pole Cole–Cole model. This approach is widely supported in the literature due to its simplicity and strong agreement with experimental measurements across tissue types such as skin, fat, bone, liver, and brain [17, 18] The Cole–Cole model proves highly useful in alleviating the complexity of simulating large biological datasets by correlating experimental measured permittivity values with frequency dispersive models. This provides accurate, efficient computation simulation within the CST framework. For fatty tissue layers within the model, a static permittivity value was taken from empirical data.
A number of studies have established that glucose fluctuation causes measurable changes in the dielectric properties of the blood plasma [18, 19]. Although potassium (K), sodium (Na), calcium (Ca), chloride (Cl), magnesium (Mg), and other electrolytes and minerals are found in human blood, their effect on the electrical characteristics of blood is considered insignificant at microwave frequencies, especially when compared to the influence of glucose. Previous studies have shown that variations in these ionic concentrations, which typically fall within narrow physiological ranges, contribute minimally to changes in complex permittivity [20, 21]. Table 4 shows the laboratory test-measured concentrations on ten sample subjects. Table 4 lists the measured concentrations from laboratory tests performed on ten sample subjects. For instance, although being present in substantial quantities in both arterial and venous blood, sodium and chloride had respective levels of 337–372 mg/dL and 310–333 mg/dL. There are additionally lesser amounts of other minerals such as magnesium (1.8–3.4 mg/dL), potassium (13.6–21.4 mg/dL), and calcium (8.5–10.5 mg/dL) [22]. As a result, we can reasonably attribute any significant variation in blood's dielectric characteristics, such as permittivity and conductivity, primarily to fluctuations in glucose concentration. This assumption forms the basis of modeling the blood layer for the EM thumb model. Experimental data obtained from ten separate samples of blood plasma were employed to test the dielectric response for different glucose concentrations. Glucose concentration in each sample was normalized to 0 mg/dL before simulation in order to provide a baseline. Then, each sample was simulated at eight glucose levels: 0, 250, 500, 1000, 2000, 4000, 8000, and 16,000 mg/dL. These levels cover both physiological and extended testing limits in order to adequately assess sensitivity of the suggested sensor. Corresponding Cole–Cole parameters for each level were calculated and applied for definition of the blood layer for CST simulation. A brief overview of the dielectric constants for all levels of glucose is shown in Table 5.
Table 4. Laboratory analyses demonstrating the minerals' concentration in blood plasma [19]
|
Parameter |
1 |
2 |
3 |
4 |
5 |
6 |
7 |
8 |
9 |
10 |
|
Ca (mmol/dl) |
8.8 |
9.2 |
8.9 |
9.0 |
8.8 |
9.1 |
9.2 |
8.2 |
9.1 |
8.7 |
|
K (mmol/dl) |
9.0 |
5.9 |
7.2 |
7.8 |
9.8 |
6.8 |
4.7 |
7.1 |
6.4 |
9.7 |
|
Na (mmol/dl) |
137 |
138 |
139 |
139 |
138 |
138 |
140 |
136 |
139 |
137 |
|
Cl (mmol/dl) |
101 |
101 |
101 |
103 |
101 |
101 |
102 |
100 |
102 |
102 |
Table 5. Parameters for Cole-Cole model at different concentrations [20]
|
Concentration (mg/dL) |
0 |
250 |
500 |
1000 |
2000 |
4000 |
8000 |
16000 |
|
$\varepsilon_{\infty}$ |
138 |
137 |
138 |
139 |
138 |
137 |
139 |
136 |
|
$\Delta \varepsilon$ |
6.8 |
9.0 |
5.9 |
7.8 |
9.8 |
9.7 |
6.4 |
7.1 |
|
$\tau(p s)$ |
101 |
101 |
101 |
103 |
101 |
102 |
102 |
100 |
Table 6. Frequency shift at different glucose concentrations
|
Glucose Concentration |
1000 (mg/dL) |
500 (mg/dL) |
250 (mg/dL) |
0 (mg/dL) |
|
Frequency (GHz) |
4.7803 |
4.7701 |
4.7649 |
4.7500 |
|
Frequency (GHz) |
4.7587 |
4.7571 |
4.7544 |
4.7501 |
|
Glucose Concentration |
16000 mg/dL |
8000 mg/dL |
4000 mg/dL |
2000 mg/dL |
Inside the simulated setup, the 3D EM human thumb model was placed directly on the surface of the CDRA, as shown in Figure 5. The thumb model incorporated the Cole–Cole-defined blood layer that changed according to the glucose concentrations under test. The rest of the structural elements of the antenna were set up as mentioned above: cop- per ground plane, Rogers RT/Duroid 5880 substrate, copper feed, and Alumina dielectric resonator placed in the center on the substrate.
Figure 5. 3D EM model of human thumb placed on CDRA
The simulation was designed to monitor changes in the resonant frequency of the CDRA with changes in dielectric properties of the blood. Simulated antenna performance provided a maximum gain of 6.509 dBi and a directivity of 6.964 dBi under baseline conditions. These parameters of performance were taken as reference values to assess the effect of glucose-induced changes in permittivity.
To validate these findings, theoretical calculations were also conducted based on the hybrid HEM11$\delta$ mode of operation. Wave number, resonant frequency, and quality factor (Q-factor) were calculated using the following equations:
Wave Number
$k_\rho a=\left(\frac{6.324}{\sqrt{\varepsilon_r+2}}\right) *\left(0.27+0.36\left(\frac{a}{2 H}\right)+0.02\left(\frac{a}{2 H}\right)^2\right)$ (2)
Resonant Frequency
$f_{0\left(H E M_{11 \delta}\right)}=\frac{(c \times 6.324)}{\left(2 \pi a \sqrt{\varepsilon_{\mathrm{r}}+2}\right)} \times\left[0.27+0.36\left(\frac{a}{2 H}\right)+0.02\left(\frac{a}{2 H}\right)^2\right]$ (3)
Q-Factor
$Q=0.01007 \varepsilon_r^{\{1.3\}}\left(\frac{a}{H}\right)\left(1+100 e^{-2.05\left(\left(\frac{a}{2 H}\right)-\left(\frac{1}{80}\right)\left(\frac{a}{H}\right)^2\right)}\right)$ (4)
The above analytical formulas supplement the simulation results and provide theoretical justification for the antenna's sensitivity to dielectric disturbances in the sensing area.
To analyze the performance of the proposed CDRA structure for glucose measurement non-invasively, a series of EM simulations were performed using CST Microwave Studio. The simulations were aimed at investigating the impact of the operating frequency of the antenna and the changing levels of glucose in the simulated human blood layer. Under normal conditions (i.e., without the presence of any biological load), the CDRA had a resonant frequency of 4.187 GHz. However, the introduction of the 3D EM human thumb model altered the resonant frequency to around 4.75 GHz. The shift in frequency is illustrated in Figure 6, and it illustrates how the antenna performance is affected by the biological interface. This observation verifies the system's sensitivity to dielectric loading and encourages further research into whether changes in blood permittivity caused by glucose result in measurable and repeatable shifts in resonant frequency.
Figure 6. Graph illustrating the resonant frequency of DRA with and without thumb
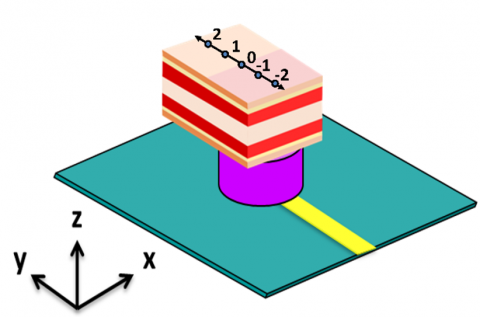
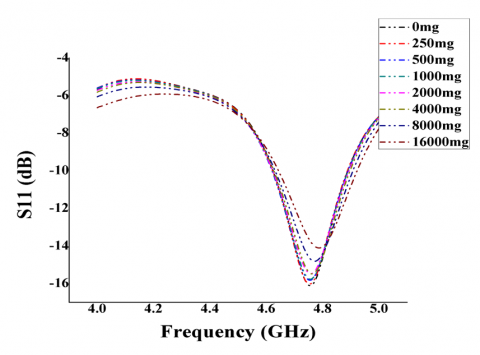
However, in actual use, reliable sensor performance also relies on repeatable and stable thumb placement, which can change between individuals and across trials. To assess this factor, a schematic model of thumb positioning on the x-axis was created and is illustrated in Figure 7. Offsets from the center (0 mm) to ±2 mm replicate real-world variation in user interaction. The effect of these lateral movements on resonant behavior is indicated in Figure 8, which shows the simulated S11 response curves for all displacement cases. Small variations in positioning lead to noticeable oscillations, showing the relevance of precise positioning for reproducible sensing.
Figure 7. Schematic representation of thumb positioning along the x-axis
Table 6 shows the simulated S-Parameter (S11) values (reflection coefficient) for eight different glucose levels, from 0 to 16,000 milligrams per deciliter. The results show a smooth, nearly linear increase in resonant frequency with an increase in glucose concentration, indicating the possibility of the antenna's application as a dielectric glucose sensor. In order to quantify the performance of the sensor, the sensitivity (S) was determined from the rate of change in the resonant frequency with respect to glucose concentration. Sensitivity is given by:
$\mathrm{S}=\frac{\Delta f_r}{\Delta G}$ (5)
where $\Delta f_r$ is the change in resonant frequency (in MHz) and $\Delta G$ is the corresponding change in glucose concentration (in mg/dL). From the data in Table 6, the frequency shifts from 4.750 GHz to 4.780 GHz over a glucose concentration range of 0 to 16,000 mg/dL. According to these data points, the sensor's sensitivity is estimated to be 1.87 kHz/mg/dL. This result highlights the antenna’s capability to detect subtle dielectric changes associated with varying glucose levels, affirming its potential for accurate, non-invasive glucose monitoring. To further investigate the sensitivity of the CDRA to glucose levels, simulations were repeated for various blood layer thicknesses using different Cole–Cole parameter sets. Table 7 shows the resulting resonant frequencies across multiple glucose concentrations and tissue thickness values.
Figure 8. The variations of resonant frequency of DRA when thumb is placed in different positions
Table 7. Resonant frequency obtained for various Cole-Cole materials with respect to the blood layer
|
Thickness (mm) |
0 (mg / dL) |
250 (mg / dL) |
500 (mg / dL) |
1000 (mg / dL) |
2000 (mg / dL) |
4000 (mg / dL) |
16000 (mg / dL) |
|
0.0 |
4.755 |
4.755 |
4.7553 |
4.7575 |
4.7598 |
4.7648 |
4.7819 |
|
0.25 |
4.8279 |
4.8306 |
4.8303 |
4.8319 |
4.8356 |
4.8359 |
4.849 |
|
0.5 |
4.9002 |
4.9001 |
4.9016 |
4.9028 |
4.9045 |
4.907 |
4.9206 |
|
0.75 |
4.9648 |
4.965 |
4.9651 |
4.9649 |
4.967 |
4.9721 |
4.9866 |
|
1.0 |
5.0287 |
5.0322 |
5.031 |
5.0323 |
5.0348 |
5.0374 |
5.0504 |
As expected, increasing the thickness of the blood layer leads to a higher overall shift in resonant frequency, confirming the depth of interaction between the resonator and the target layer. The nearly linear progression of operating frequency with increasing glucose level is further illustrated in Figure 9. This trend supports the hypothesis that the CDRA. can serve as a non-invasive, dielectric-based glucose sensor. Similar frequency-based sensing methods have been investigated in prior research for hydration and tissue monitoring applications [23, 24].
Figure 9. Graph showing the linear variation of glucose level from 0 (mg / dL) - 16000 (mg / dL) versus resonant frequency
Overall, these results confirm that the CDRA responds sensitively and predictably to changes in glucose concentration within biologically relevant limits. This makes the proposed structure a viable candidate for further development in continuous glucose monitoring applications. However, in real-world scenarios, additional physiological factors such as tissue compression and anatomical variation can influence the effective thickness of biological layers, particularly under pressure from the thumb’s placement on the antenna. Blood layer thickness, for instance, can vary naturally between individuals and dynamically due to applied pressure. This variation can subtly influence the resonant response of the sensor. Table 8 presents the simulation results showing how changes in blood thickness affect the resonant frequency of the antenna.
Table 8. Variation in thumb size due to blood layer thickness
|
Thickness (mm) |
250-0 (mg / dL) |
500-250 (mg / dL) |
1000-500 (mg / dL) |
2000-1000 (mg / dL) |
4000-2000 (mg / dL) |
8000-4000 (mg / dL) |
16000-8000 (mg / dL) |
|
0.0 |
0.0 |
0.0003 |
0.0022 |
0.0023 |
0.005 |
0.0051 |
0.012 |
|
0.25 |
0.0027 |
-0.0003 |
0.0016 |
0.0037 |
0.0003 |
0.0062 |
0.0069 |
|
0.5 |
-0.0001 |
0.0015 |
0.0012 |
0.0017 |
0.0025 |
0.0047 |
0.0089 |
|
0.75 |
0.0002 |
0.0001 |
-0.0002 |
0.0021 |
0.0051 |
0.003 |
0.0115 |
|
1.0 |
0.0035 |
-0.0012 |
0.0013 |
-0.0025 |
0.0026 |
0.0035 |
0.0095 |
Additionally, variation in nail thickness was investigated, as this superficial layer may differ across individuals. However, simulation results in Table 9 show negligible impact on the resonant frequency, suggesting that nail variability does not significantly influence sensing accuracy. From the data presented in these tables, it can be concluded that variations in skin, blood, or nail thickness, whether due to effect on the resonant behavior of the CDRA. This indicates strong robustness of the proposed antenna design against real world biological variability. anatomical diversity or finger pressure, have only a marginal effect on the resonant behavior of the CDRA. This indicates strong robustness of the proposed antenna design against real world biological variability.
Table 9. Resonant frequency obtained for various Cole-Cole materials with respect to the skin layer
|
Thickness (mm) |
0 (mg / dL) |
250 (mg / dL) |
500 (mg / dL) |
1000 (mg / dL) |
2000 (mg / dL) |
4000 (mg / dL) |
16000 (mg / dL) |
|
0.5 |
4.9047 |
4.9046 |
4.9048 |
4.9059 |
4.9095 |
4.9128 |
4.94 |
|
0.6 |
4.875 |
4.875 |
4.8747 |
4.8765 |
4.8807 |
4.881 |
4.9082 |
|
0.7 |
4.8449 |
4.865 |
4.845 |
4.8451 |
4.85 |
4.855 |
4.8775 |
|
0.8 |
4.815 |
4.8148 |
4.815 |
4.8176 |
4.82 |
4.8249 |
4.8474 |
|
0.9 |
4.785 |
4.7847 |
4.7852 |
4.7868 |
4.7901 |
4.7949 |
4.816 |
|
1.0 |
4.755 |
4.755 |
4.7553 |
4.7575 |
4.7598 |
4.7648 |
4.7819 |
While the Cole–Cole model used in this study enables comprehensive analysis across a wide range of dielectric conditions, the simulated glucose concentrations up to 16,000 mg/dL exceed physiologically realistic levels. This selection was originally made following earlier work [20], which simulated plasma dielectric response over a wide range to test sensor sensitivity and response behavior under theoretical extremes. To further validate the clinical utility of the proposed system, further simulations were performed employing aqueous glucose solutions within a clinically realistic concentration range from 50–250 mg/dL, based on data reported in the researches.
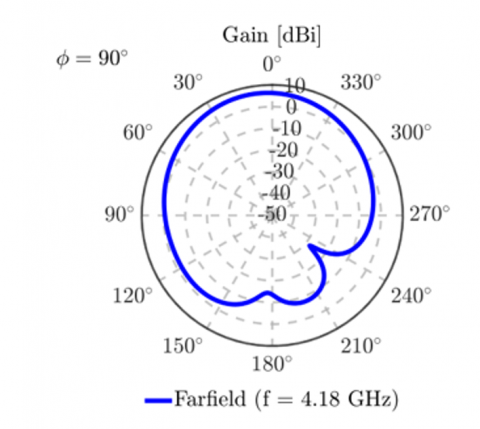
The electric properties of the solutions were derived from experimental data, with the relative permittivity decreasing monotonically and the equivalent conductivity remaining constant with increasing glucose concentration. Table 10 reports the dielectric values employed in this study. Figure 10 illustrates that the S11 demonstrates distinguishable resonant frequency shifts for the various glucose concentrations. These findings further support the sensitivity of the antenna in clinically valuable glucose concentrations and assist in validating the viability of implementing the design in real-world, non-invasive supervision of glucose levels. The estimated sensitivity of aqueous glucose solution is approximately 0.7 MHz/mg/dL. To determine the radiation performance of the CDRA, Fairfield simulations were conducted as well. The proposed antenna has a gain of up to 6.526 dBi and a half-power beamwidth of about 90°, as illustrated in Figure 11 and Figure 12. The excitation of higher-order hybrid modes is responsible for such a performance, generating a directional radiation pattern appropriate for near-field sensing purposes.
Table 10. Electrical properties of aqueous glucose concentrations used for validation
|
Aqueous Glucose Concentration (mg/dL) |
Relative Permittivity ($\varepsilon_r$) |
Equivalent Conductivity ($\sigma_e$) [S/m] |
|
50 |
65.0547 |
1.4895 |
|
100 |
60.6768 |
1.4895 |
|
150 |
56.2990 |
1.4895 |
|
200 |
51.9211 |
1.4895 |
|
250 |
47.5433 |
1.4895 |
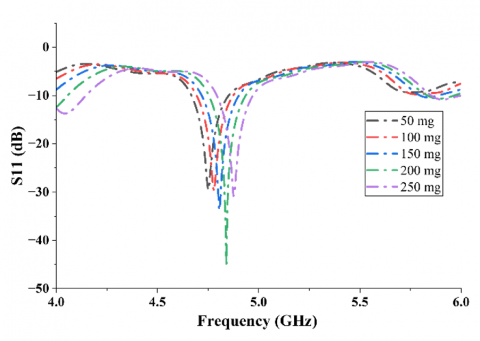
Figure 10. Simulated S11 curves for aqueous solutions of glucose in the 50 (mg / dL) to 250 (mg / dL) range, exhibiting observable frequency shifts with increasing concentration of glucose
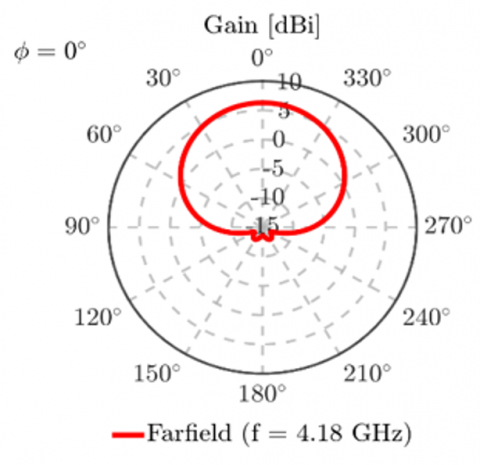
Figure 11. 2D Radiation pattern of the proposed design at $\phi$ = 00
Figure 12. 2D Radiation pattern of the proposed design at $\phi$ = 900
Directivity of the antenna was computed as 6.964 dBi, which is indicative of having a high main lobe. In addition, side-lobe levels were very low, as can be seen in Figure 12, with the aim of causing negligible unwanted radiation and higher sensitivity along the forward direction. Antenna efficiency $\eta$, which is the ratio of gain (G) to directivity (D), was computed by:
$\eta=\frac{G}{D}=\frac{6.526}{6.964} \approx 0.93$ or $93 \%$ (6)
This efficiency is very high, which ensures that most of the power delivered to the antenna is radiated properly, a requirement of high-performance biomedical sensors.
We designed a DRA-based non-invasive blood glucose monitoring system. 3D electromagnetic (EM) model of the human thumb was simulated based on anatomical layers like blood, bone, skin, and fat. The Cole–Cole method was utilized for modeling the blood layer with differing glucose concentrations represented by permittivity values. Simulations were performed using CST Studio, and the S11 parameter was obtained in order to examine resonant frequency behavior. The resonant frequency was plotted against glucose concentration levels, and steady trends were observed. The model was tested under various physiological conditions, including different thumb sizes and varying thicknesses of the blood, skin, and nail layers. In all these cases, only small deviations in resonant frequency were present, which can be calibrated. Upon fabrication, this design will allow diabetic patients to check their glucose levels non-invasively and in real time, providing a useful alternative under circumstances where traditional finger prick procedures are painful or uncomfortable.
[1] Saeedi, P., Petersohn, I., Salpea, P., Malanda, B., et al. (2019). Global and regional diabetes prevalence estimates for 2019 and projections for 2030 and 2045: Results from the International Diabetes Federation Diabetes Atlas. Diabetes Research and Clinical Practice, 157: 107843. https://doi.org/10.1016/j.diabres.2019.107843
[2] Pradeepa, R., Mohan, V. (2021). Epidemiology of type 2 diabetes in India. Indian Journal of Ophthalmology, 69(11): 2932-2938. https://doi.org/10.4103/ijo.IJO_1627_21
[3] Cradock, S., Hawthorn, J. (2002). Pain, distress and blood glucose monitoring. Journal of Diabetes Nursing, 6(6): 188-191. https://diabetesonthenet.com/journal-diabetes-nursing/pain-distress-and-blood-glucose-monitoring/.
[4] Wu, J., Liu, Y., Yin, H., Guo, M. (2023). A new generation of sensors for non-invasive blood glucose monitoring. American Journal of Translational Research, 15(6): 3825-3837. https://pmc.ncbi.nlm.nih.gov/articles/PMC10331674/.
[5] Islam, Z.U., Bermak, A., Wang, B. (2024). A review of microstrip patch antenna-based passive sensors. Sensors, 24(19): 6355. https://doi.org/10.3390/s24196355
[6] Khattak, M.A., Khattak, M.I., Owais, S.M., Khattak, A. A., Sultan, A. (2020). Design and analysis of millimeter wave dielectric resonator antenna for 5G wireless communication systems. Progress In Electromagnetics Research C, 98: 239-255. https://doi.org/10.2528/PIERC19102404
[7] Abdou, T.S., Khamas, S.K. (2023). A multiband millimeter-wave rectangular dielectric resonator antenna with omnidirectional radiation using a planar feed. Micromachines, 14(9): 1774. https://doi.org/10.3390/mi14091774
[8] Zhang, Y., Ogurtsov, S., Vasilev, V., Kishk, A.A., Caratelli, D. (2024). Advanced dielectric resonator antenna technology for 5G and 6G applications. Sensors, 24(5): 1413. https://doi.org/10.3390/s24051413
[9] Keyrouz, S., Caratelli, D. (2016). Dielectric resonator antennas: Basic concepts, design guidelines, and recent developments at millimeter-wave frequencies. International Journal of Antennas and Propagation, 2016(1): 6075680. https://doi.org/10.1155/2016/6075680
[10] Rahayu, Y., Nugraha, W.N., Praludi, T., Alaydrus, M., Anhar, Masdar, H. (2023). Experimental based blood glucose monitoring with a noninvasive cylindrical biosensor. Progress in Electromagnetics Research M, 115: 71-81. https://doi.org/10.2528/PIERM22110409
[11] Krishna, R.R. (2025). A 3.1 ghz defected ground transmission line microwave sensor for blood glucose Estimation. Progress Electromagnet Res Lett, 123: 83-88. https://doi.org/10.2528/PIERL24090302
[12] Mohammadi, P., Mohammadi, A., Demir, S., Kara, A. (2021). Compact size, and highly sensitive, microwave sensor for non-invasive measurement of blood glucose level. IEEE Sensors Journal, 21(14): 16033-16042. https://doi.org/10.1109/JSEN.2021.3075576
[13] Kiani, S., Rezaei, P., Fakhr, M. (2021). Dual-frequency microwave resonant sensor to detect noninvasive glucose-level changes through the fingertip. IEEE Transactions on Instrumentation and Measurement, 70: 1-8. https://doi.org/10.1109/TIM.2021.3052011
[14] Karami, M., Rezaei, P., Kiani, S., Sadeghzadeh, R.A. (2017). Modified planar sensor for measuring dielectric constant of liquid materials. Electronics Letters, 53(19): 1300-1302. https://doi.org/10.1049/el.2017.2481
[15] Gabriel, S., Lau, R.W., Gabriel, C. (1996). The dielectric properties of biological tissues: II. Measurements in the frequency range 10 Hz to 20 GHz. Physics in Medicine & Biology, 41(11): 2251. https://doi.org/10.1088/0031-9155/41/11/002
[16] Baumgartner C, Hasgall, P., Di Gennaro, F., Neufeld, E., Lloyd, B., Gosselin, M., Payne, D., Klingenböck, A., Kuster, N. (2025). IT’IS Database for thermal and electromagnetic parameters of biological tissues. Version 5.0. https://doi.org/10.13099/VIP21000-05-0
[17] Porter, E., La Gioia, A., Santorelli, A., O'Halloran, M. (2017). Modeling of the dielectric properties of biological tissues within the histology region. IEEE Transactions on Dielectrics and Electrical Insulation, 24(5): 3290-3301. https://doi.org/10.1109/TDEI.2017.006690
[18] Farouk, M., El-Hameed, A.S.A., Eldamak, A.R., Elsheakh, D.N. (2025). Noninvasive blood glucose monitoring using a dual band microwave sensor with machine learning. Scientific Reports, 15(1): 16271. https://doi.org/10.1038/s41598-025-94367-6
[19] Nakamura, M., Tajima, T., Seyama, M., Waki, K. (2018). A noninvasive blood glucose measurement by microwave dielectric spectroscopy: Drift correction technique. In 2018 IEEE International Microwave Biomedical Conference (IMBioC), Philadelphia, PA, USA, pp. 85-87. https://doi.org/10.1109/IMBIOC.2018.8428940
[20] Zhang, R., Liu, S., Jin, H., Luo, Y., Zheng, Z., Gao, F., Zheng, Y. (2019). Noninvasive electromagnetic wave sensing of glucose. Sensors, 19(5): 1151. https://doi.org/10.3390/s19051151
[21] Miklavčič, D., Pavšelj, N., Hart, F.X. (2006). Electric properties of tissues. Wiley Encyclopedia of Biomedical Engineering. In Wiley Encyclopedia of Biomedical Engineering. https://doi.org/10.1002/9780471740360.ebs0403
[22] Shcherbakov, V.V., Artemkina, Y.M., Akimova, I.A., Artemkina, I.M. (2021). Dielectric characteristics, electrical conductivity and solvation of ions in electrolyte solutions. Materials, 14(19): 5617. https://doi.org/10.3390/ma14195617
[23] Andreuccetti, D., Fossi, R., Petrucci, C. (2012). An Internet resource for the calculation of the dielectric properties of body tissues in the frequency range 10 Hz - 100 GHz. http://niremf.ifac.cnr.it/tissprop/.
[24] Karacolak, T., Moreland, E.C., Topsakal, E. (2013). Cole-Cole model for glucose-dependent dielectric properties of blood plasma for continuous glucose monitoring. Microwave and Optical Technology Letters, 55(5): 1160-1164. https://doi.org/10.1002/mop.27515