M. Premkumar*![]() | I. Chandra
| I. Chandra![]() | V.N. Senthil Kumaran
| V.N. Senthil Kumaran![]() | S. Rajakumar
| S. Rajakumar![]() | R. Subraja
| R. Subraja![]()
© 2025 The authors. This article is published by IIETA and is licensed under the CC BY 4.0 license (http://creativecommons.org/licenses/by/4.0/).
OPEN ACCESS
Measurement of signal at low frequency and high frequency affected by noise is highly significant for wireless systems applications such as signal transmission and reception. Signal in wireless applications, termed as baseband signal or message signal operates at low and high frequency ranges where its measurement is challenging for obtaining amplitude in time domain at specific instants and magnitude in the frequency domain. Moreover, noise concatenation at any of the stages of wireless systems, either in the transmitter or in the receiver sections, is challenging. This research article provides research objectives to measure low frequency and high frequency signals when affected by noise following Gaussian distribution. To overcome the aforementioned challenges, digital filters are employed to reduce noise in order to recover the signal. Baseband signal at a high frequency of 10 MHz, sampling frequency 200 MHz and low frequency signal of 20 Hz and 1 kHz sampling frequency are considered for simulation in matrix laboratory (MATLAB) software platform. Noise samples get added with the baseband signal and it is removed using digital filters such as infinite impulse response (IIR) filters specified by their transfer function. Signal parameters such as amplitude, time, magnitude, and frequency can be measured based on the digital filter output and can be employed for signal transmission and reception in wireless systems applications for present-day scenarios.
measurement, signal, frequency, Gaussian, noise, transmission, reception, wireless
Signals possess vital information irrespective of their frequency ranges, such as low frequency or high frequency in terms of resolution [1] and their measurement is highly significant. Low frequency ranges of the order of a few Hertz (Hz) to kiloHertz (kHz) can be employed in applications such as commercial radios, sensor control for automation, medical health care, electrical signal transmission, allied measuring and signal processing methodologies [2]. High frequency signals spanning from megaHertz (MHz) to gigaHertz (GHz) ranges and beyond are used in applications pertaining to high speed data transmission technologies like 5G wireless systems, wireless fidelity (WiFi), satellite communication, radio detection and ranging (RADAR) and medical imaging. In aforementioned applications, a signal can be processed either in continuous time or in discrete in time, where amplitude values get corrupted by noise [3], which is undesirable. Noise gets concatenated at any point in time during the system process and its elimination is essential. Noise elimination or denoising [4] leads to signal measurement, where it can be done by using digital filters based on digital signal processing [5] techniques, leading to signal enhancement for device-oriented applications.
Measurement of signal operating in low frequency and high frequency can be realized by using digital filters, which are specified by their transfer function. In the analog domain, it is defined by using Laplace transform and in the digital domain by using Z transform which can also be specified by its input-output difference function. However, when signals transmitted over a channel medium gets combined with noise in the receiving end it can be measured or assessed by using signal to noise ratio (SNR) [6]. SNR is a metric determined as the ratio of signal power to noise power measured in decibels (dB). SNR for correlated signals can be represented by autocorrelation with respect to the input signal and cross correlation in another perspective between input and output. Further, measurement of signal using low pass filters and high pass filters is also a distinct possibility where frequency from 0 to fc is selected by low pass filters and high pass filters from fc to increased frequency ranges. Low pass filtering can denoise [7] low frequency signal from a noisy signal for frequency ranges from baseband, radio frequency (RF) and further up to millimeter wave ranges [8].
Different types of filters can be used in noise affected scenarios based on application requirements. In Power electronics based systems [9], median filters are highly beneficial. For speech signal refinement, customized filters [10] are significant. Kalman filters are used for real-time data denoising when used along with artificial neural networks [11]. However, when images like ultrasound get subjected to noise, it can be handled effectively by hybrid speckle denoising filters [12]. Similarly, Gaussian noise affected digital images can be addressed by iterative minimum mean square error (MMSE) filters [13]. Gaussian phase noise effects in orthogonal frequency division multiplexing (OFDM) systems are presented in the study [14] and a research article [15] investigates phase noise considered in higher order modulation schemes.
Further, performance of new digital filters for electronics-related signal processing is presented in the research literature [16] and phase noise suppression is dealt in the research work [17]. However, digital filters are also represented by their impulse response, such as finite impulse response (FIR) filter and infinite impulse response (IIR) filter [18]. FIR exhibits stability due to the presence of the zeros in the transfer function and poles at the origin. On the other hand, IIR filters' stability is dependent on the poles whenever they are within the unit circle. Research literatures from [5-17] present excellent work done with respect to various signals and its corresponding digital filters. This research article addresses research problem for measurement of low frequency and high frequency signal concatenated with noise where its research goal is to recover the signal using a digital filter. Further, the measured low and high frequency signals can be used for signal transmission and reception using OFDM scheme.
In this research article, Section 1 outlines the introduction for signal measurement and possible filters for signal entities with research works done. Section 2 provides the signal transmission and reception methodology for low frequency signal and high frequency signal. Section 3 presents the noise statistics having Gaussian distribution along with its mean and variance. Section 4 gives the results and discussion for measurement of low frequency signal and high frequency signal and their data transmission using the OFDM modulation scheme. Section 5 pertains to the conclusion of this research work.
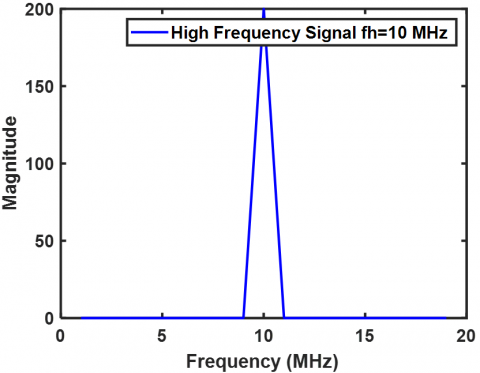
Signal transmission and reception experience noise and it requires measurement for signal detection when used in wireless systems applications. Low frequency and high frequency signals generated from digital sources such as computers, smartphones, and digital cameras are prone to get affected by noise which is undesirable. A high frequency signal fh=10MHz with a sampling frequency of 200 MHz as shown in Figure 1, can be transmitted from a wireless system which is represented as
$y_h(n)=20 \cos \left(2 \pi\left(\frac{f h}{f_s}\right) n+\theta\right) h(n)+g_{n o}(n)$ (1)
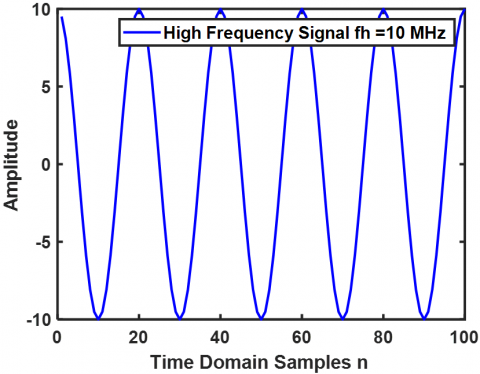
where, h(n) represents the wireless channel which can be flat fading or frequency selective fading [19]. High frequency signals offer very high bandwidth, such as OFDM and are prone to being affected by noise. Distribution of noise is given by its probability distribution function and probability density function where measurement of signal parameters such as amplitude, time, frequency and magnitude gain significance. Figure 2 shows a high frequency signal observed in time domain with a specified number of samples.
Figure 1. High frequency signal at fh=10MHz
Figure 2. High frequency signal for 100 samples
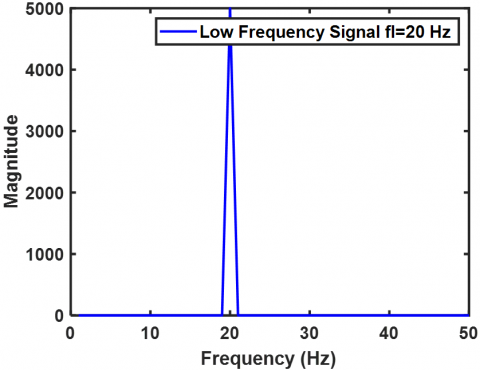
$y_l(n)=20 \cos \left(2 \pi\left(\frac{f l}{f_s}\right) n+\theta\right) h(n)+g_{n o}(n)$ (2)
Figure 3. Low frequency signal at fl=20Hz
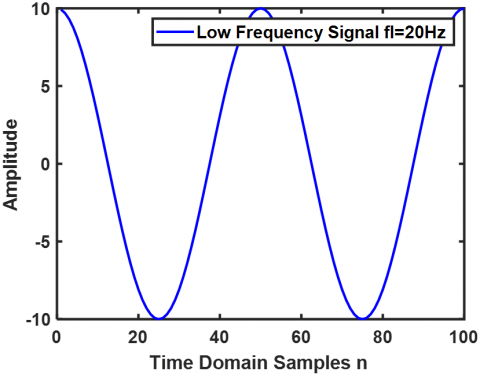
Figure 3 portrays a low frequency signal fl=20Hz transmitted and received with a sampling frequency of 1kHz and Figure 4, shows its time domain representation.
Figure 4. Low frequency signal for 100 samples
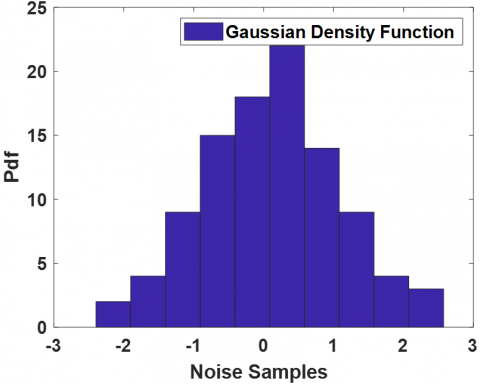
Noise is a random signal defined by its statistical parameters mean and variance which are relevant to the concerned distribution it follows. Noise affects the signal either in the transmitter or in the receiver, and it needs to be assessed for signal detection. Distribution followed by noise can be Gaussian specified by its probability density function (PDF) [19] with mean $\mu_x=0$ and variance $\sigma_x^2=1$. The mean of noise following Gaussian distrubution can be found from
$E\left(g_{n o}(n)\right)=\int_{-\infty}^{\infty} g_{n o}(n) f_{g_{n o}}(n) d g_{n o}(n)$ (3)
Figure 5. Histogram of Gaussian probability density function
Also, variance of the noise with Gaussian distribution can be given as
$\operatorname{Var}\left(g_{n o}(n)\right)=\int_{-\infty}^{\infty} g_{n o}^2 f_{g_{n o}}(n) d g_{n o}(n)$$-\left[\int_{-\infty}^{\infty} g_{n o}(n) f_{g_{n o}}(n) d g_{n o}(n)\right]^2$ (4)
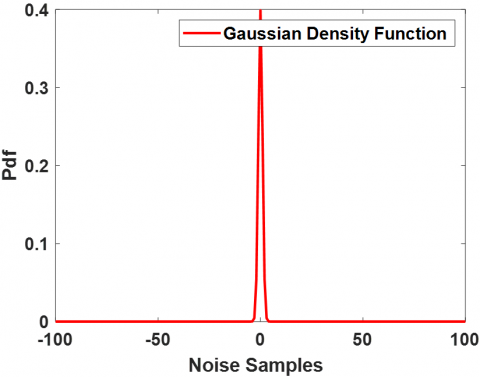
where it is the difference between the second moment and the square of its mean value. Figure 5 shows the histogram of Gaussian probability density function, which is obtained in the form of bins. Figure 6 shows Gaussian density function observed for 100 samples.
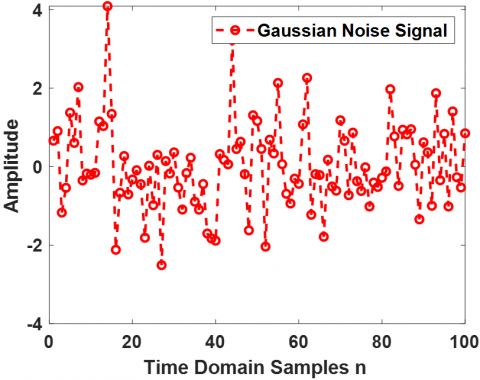
Figure 7 shows a noise signal based on Gaussian distribution where the maximum peak values can determine its mean and variance. Gaussian noise considered in this research article has a potential impact in frequency ranges starting from low frequency range of a few Hz and high frequency ranges from MHz to GHz. However, other noise sources are not deemed significant and are only available at specified frequency ranges.
Figure 6. Gaussian density function observed for 100 samples
Figure 7. Noise signal following Gaussian distribution
Simulation results are done in matrix laboratory (MATLAB) simulation environment for measurement of low frequency and high frequency signals using digital filter in fading channel environment using orthogonal frequency division multiplexing (OFDM) modulation scheme. Low frequency signals in the range of 20 Hz, a direct current (DC) signal and high frequency signal of 10MHz are observed when concatenated by noisy environment. The noise concatenated signals following Gaussian distribution are reconstructed/recovered using digital infinite impulse response (IIR) filter specified by its poles and zeros in the transfer function. The reconstructed signal is transmitted using OFDM modulation scheme [14, 17] which uses inverse fast Fourier transform (IFFT) at the transmitter and fast Fourier transform (FFT) at the receiver. Such OFDM scheme when used for data transmission and reception can be efficient as it uses different subcarriers. To assess OFDM based system performance, the probability of error against signal to noise ratio for different subcarriers is observed.
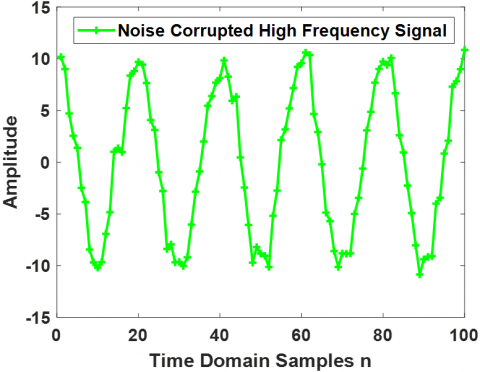
Figure 8. Noise corrupted high frequency signal
Figure 8 shows an affected high frequency signal following Gaussian distribution where the signal gets completely changed in terms of its amplitude, time and frequency range. However, noise concatenated signal needs to be suppressed/removed for noise and the signal needs to be measured for its parameters. To recover the signal and measure its parameters a digital filter [18] with IIR type can be employed having a transfer function $T_{\text {digital}}(Z)$ which is mathematically represented as
$T_{\text {digital}}(Z)=\frac{\operatorname{num}(Z)}{\operatorname{den}(Z)}=\frac{K}{\left[1+p_1 z^{-1}+p_2 z^{-2}\right]}$ (5)
where num(Z) is the numerator of the transfer function and den(Z) is the denominator to represent the digital filter in IIR modality. The digital filter pole values are -1.90 and 1 numerator K parameter value is 0.05 which aid to reconstruct the high frequency signal.
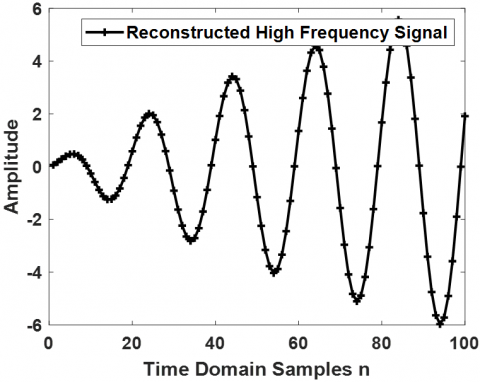
Figure 9. Filtered reconstructed signal at higher frequency ranges
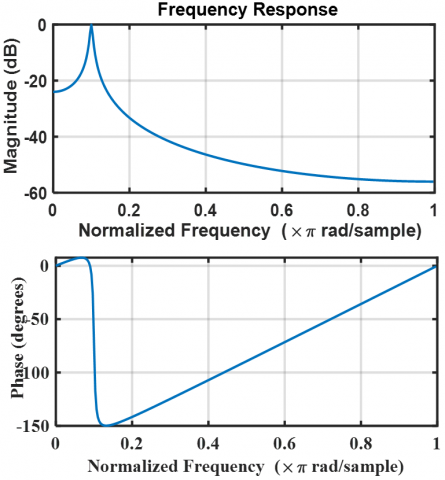
Figure 9 shows the reconstructed signal at higher frequency ranges. The filter used is a digital IIR filter which reconstructs the signal based on the poles and zeros of the transfer function. Initially, the amplitude of the reconstructed/recovered signal is very low and it gradually increases based on the poles of the digital filter [18]. Figure 10 shows the frequency response of digital filter having a magnitude response and a phase response with respect to its normalized frequency.
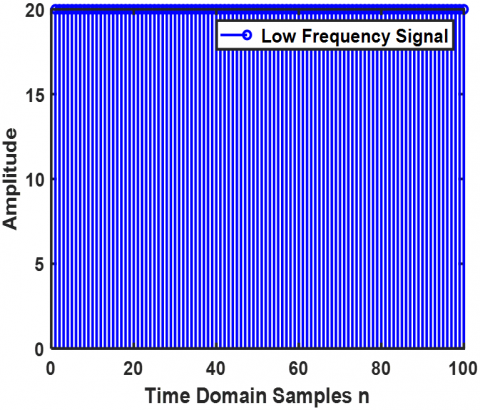
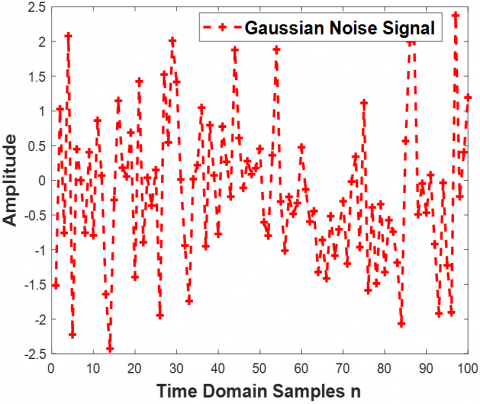
Figure 11 shows a low frequency DC signal with a fixed amplitude observed over a time period of 100 samples. DC signal is considered to have the same amplitude of 20 volts for entire time duration and Figure 12 represents a Gaussian noise signal.
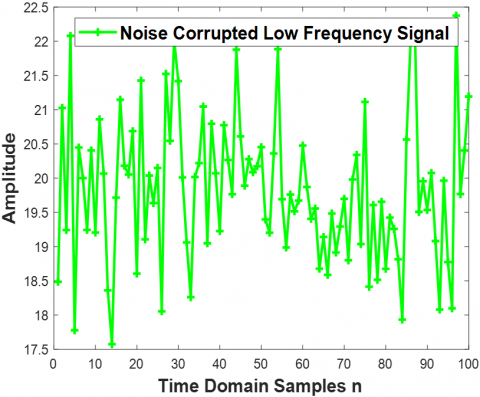
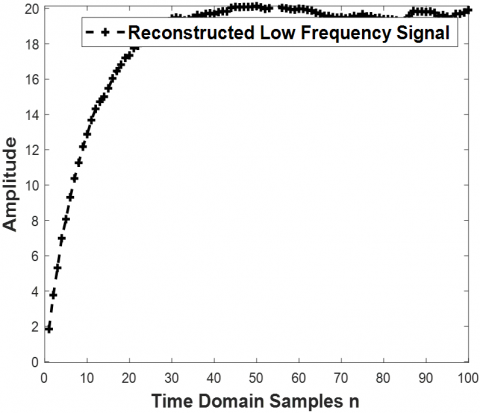
Figure 13 shows noise corrupted/concatenated signal at low frequency ranges which infers that its signal parameters amplitude, time period and frequency cannot be measured. On the other hand, Figure 14 shows the reconstructed signal by using a digital filter. Table 1 provides the simulation values and their associated parameters considered.
Figure 10. Frequency response of digital filter
Figure 11. Low frequency signal DC signal
Figure 12. Gaussian noise signal
Figure 13. Noise corrupted low frequency signal
Figure 14. Filtered recovered signal at lower frequency ranges
Table 1. Simulation parameters and simulation values
|
Simulation Parameters |
Simulation Values |
|
Low Frequency Signal |
20 Hz |
|
High Frequency Signal |
10 MHz |
|
Sampling Signal |
1kHz, 200 MHz |
|
Noise Signal |
Gaussian Distributed Signal Mean $\mu_x=0$ and Variance $\sigma_x^2=1$ |
|
Digital Filter |
Infinite Impulse Response Filter |
|
Modulation for Data Transmission |
Orthogonal Frequency Division Multiplexing |
|
OFDM Subcarriers |
64,128,256,512 |
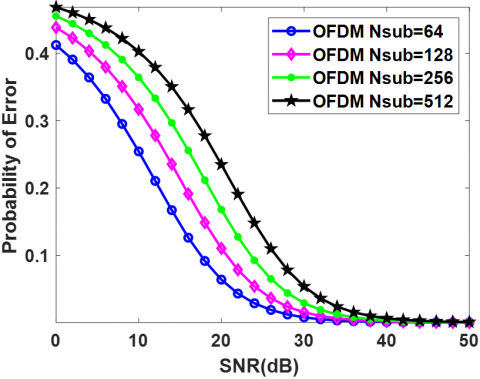
Figure 15 shows the probability of error against signal to noise ratio (SNR) for the orthogonal frequency division multiplexing scheme for the signal considered. The error reduces when the SNR value increases for various subcarrier values. To achieve a probability of error of 0.2, SNR is 11dB, when the subcarrier values are less. Further on increasing the number of subcarriers, it takes more than 20dB to obtain specified probability of error. Signal data is effectively transmitted and received in considered wireless system applications where it can possess a single antenna or multiple antennas employing diversity schemes [20]. Diversity schemes increase system gain, which can provide an enhancement in overall wireless system performance.
Figure 15. Probability of error against signal to noise ratio (SNR) for OFDM modulation scheme
This research article provides measurement of signal at high frequency and low frequency concatenated by Gaussian noise for wireless systems applications pertaining to data transmission and reception. Digital filters can reconstruct signal operating in specified frequency ranges based on its transfer function. Efficient signal reconstruction is obtained via digital filters, from which signal parameters amplitude, time period and frequency are measured. Reconstructed signals are mapped using an orthogonal frequency division multiplexing scheme for data transmission and reception in wireless applications. As an extension of future work, by exploring possible signal processing techniques, digital filters can be considered for the measurement of signal parameters for upcoming present-day wireless technologies.
[1] Yoshizawa, T., Hirobayashi, S., Misawa, T. (2011). Noise reduction for periodic signals using high-resolution frequency analysis. EURASIP Journal on Audio, Speech, and Music Processing, 2011(1): 5. https://doi.org/10.1186/1687-4722-2011-426794
[2] Jaraczewski, M., Mielnik, R., Sulowicz, M. (2016). The low-frequency measuring method and signal processing application in electrical machines and electric devices monitoring. In 2016 13th Selected Issues of Electrical Engineering and Electronics (WZEE), Rzeszow, Poland, pp. 1-6. https://doi.org/10.1109/WZEE.2016.7800242
[3] Magsi, H., Sodhro, A.H., Chachar, F.A., Abro, S.A.K. (2018). Analysis of signal noise reduction by using filters. In 2018 International Conference on Computing, Mathematics and Engineering Technologies (iCoMET), Sukkur, Pakistan, pp. 1-6. https://doi.org/10.1109/ICOMET.2018.8346412
[4] Al-Aboosi, Y.Y., Sha’ameri, A.Z., Sallomi, A.H. (2020). Enhancement signal detection in underwater acoustic noise using level dependent estimation time-frequency de-noising technique. Journal of Marine Engineering & Technology, 19(1): 1-14. https://doi.org/10.1080/20464177.2018.1508810
[5] Zaman, K., Maghdid, S.S., Afridi, H., Ullah, S., Zohaib, M. (2020). Enhancement of speech signals for hearing aid devices using digital signal processing. In 2020 4th International Symposium on Multidisciplinary Studies and Innovative Technologies (ISMSIT), Istanbul, Turkey, pp. 1-7. https://doi.org/10.1109/ISMSIT50672.2020.9255299
[6] Liu, Y., Liu, J., Kennel, R. (2021). Frequency measurement method of signals with low signal-to-noise-ratio using cross-correlation. Machines, 9(6): 123. https://doi.org/10.3390/machines9060123
[7] Yang, T., Yu, H., Wang, Y. (2022). An efficient low-pass-filtering algorithm to de-noise global GRACE data. Remote Sensing of Environment, 283: 113303. https://doi.org/10.1016/j.rse.2022.113303
[8] Michailidis, A., Noulis, T., Siozios, K. (2023). CMOS noise analysis and simulation from low frequency and baseband to RF and millimeter wave. IEEE Access, 11: 39807-39823. https://doi.org/10.1109/ACCESS.2023.3268821
[9] Cvetanovic, R., Petric, I., Mattavelli, P., Buso, S. (2023). Median filters for switching noise mitigation in oversampled power electronics control systems. In 2023 IEEE Energy Conversion Congress and Exposition (ECCE), Nashville, TN, USA, pp. 2725-2731. https://doi.org/10.1109/ECCE53617.2023.10362602
[10] Julius, O., Obagbuwa, I.C., Adebiyi, A.A., Michael, E.B. (2023). Speech refinement using custom filter for developing robust S2S dataset. In 2023 International Conference on Science, Engineering and Business for Sustainable Development Goals (SEB-SDG), Omu-Aran, Nigeria, pp. 1-6. https://doi.org/10.1109/SEB-SDG57117.2023.10124474
[11] Armando, E., Hanyurwimfura, D., Gatera, O., Nduwumuremyi, A. (2023). Kalman filter and artificial neural network for real time sensor denoising. In 2023 International Conference on Information Technology and Computing (ICITCOM), Yogyakarta, Indonesia, pp. 107-112. https://doi.org/10.1109/ICITCOM60176.2023.10441838
[12] Sikhakhane, K., Rimer, S., Gololo, M., Ouahada, K., Abu-Mahfouz, A. (2023). Hybrid speckle de-noising filters for ultrasound images. In 2023 IEEE AFRICON, Nairobi, Kenya, pp. 1-6. https://doi.org/10.1109 /AFRICON55910.2023.10293419
[13] Fatnassi, S., Yahia, M. (2024). Gaussian noise removal from digital image using the iterative MMSE filter. In 2024 IEEE International Multi-Conference on Smart Systems & Green Process (IMC-SSGP), Djerba, Tunisia, pp. 1-3. https://doi.org/10.1109/IMC-SSGP63352.2024.10919793
[14] Bello, Y., Doré, J.B., Demmer, D. (2024). Analysis of gaussian phase noise effects in DFT-s-OFDM systems for sub-THz transmissions. EURASIP Journal on Wireless Communications and Networking, 2024(1): 60. https://doi.org/10.1186/s13638-024-02350-y
[15] Lavrič, A., Batagelj, B. (2024). Phase noise measurement for improving the performance of high-order modulation scheme wireless links. In 2024 7th International Balkan Conference on Communications and Networking (BalkanCom), Ljubljana, Slovenia, pp. 148-152. https://doi.org/10.1109/BalkanCom61808.2024.10557170
[16] Zhang, Z. (2025). Performance analysis of new digital filters in electronic information signal processing. Procedia Computer Science, 262: 648-655. https://doi.org/10.1016/j.procs.2025.05.096
[17] Liu, J., Bian, C., He, W., Yang, X., Wei, Y., Zhang, Y., Yu, J. (2025). W-band photonics-aided OFDM system integrating sensing and communication with phase noise suppression scheme. Optics & Laser Technology, 180: 111432. https://doi.org/10.1016/j.optlastec.2024.111432
[18] Orfanidis, S.J. (1995). Introduction to Signal Processing. Prentice-Hall, Inc.
[19] Proakis, J.G., Salehi, M. (2001). Digital Communications, pp. 593-620. New York: McGraw-Hill.
[20] Tse, D., Viswanath, P. (2005). Fundamentals of Wireless Communication. Cambridge University Press, USA.