Agustan Latif*![]() | Suwarjono
| Suwarjono![]() | Mega A. Yusuf
| Mega A. Yusuf![]() | Jarot Budiasto
| Jarot Budiasto![]()
© 2025 The authors. This article is published by IIETA and is licensed under the CC BY 4.0 license (http://creativecommons.org/licenses/by/4.0/).
OPEN ACCESS
This research develops an Internet of Things (IoT)-based real-time framework for integrated monitoring of load, temperature, and energy consumption performance in grain drying. Although IoT technology has transformed the agricultural sector, implementing low-cost sensors for precision monitoring in grain drying and the relationship between monitoring data and energy optimization still faces various challenges. The study integrated the DHT11 sensor and HX711 load cell with a closed-loop system and a mathematical model for estimating moisture content. The experimental method used comprehensive observation instruments, including continuous load measurement and monitoring at five strategic points of the DHT11 sensor and real-time power measurement. The results showed an increase in energy efficiency of 27.5% and reduced drying time by 20-30% compared to conventional farmers' methods in Merauke. In addition, the system can achieve an optimal humidity level (12-14%). The consistency of product quality reached 96.7%, and seed cracking cases reduced by 15.7%. The system ensures moisture accuracy, achieving an average error percentage of ±1.92% in moisture detection and an overall drying efficiency of 67.1%; using a blower improves on the results of previous studies, which only reached 64.8% using LPG. The framework provides theoretical contributions in the form of empirical validation of drying dynamics correlation models and energy optimization, as well as practical contributions in the form of sustainable drying solutions that are adaptable to various scales of operations and support improving global food security through improved post-harvest efficiency.
energy performance analysis, IoT-based agriculture, load cell integration, real-time monitoring, smart drying technology, sustainable grain drying, temperature sensing system
Food security is a fundamental aspect of sustainable development. Internet of Things (IoT) technology is transforming the agricultural sector towards more effective and productive practices. Digital transformation has opened a new chapter in food supply chain management so farmers can optimize the production process through precision monitoring. The proper drying process of grain increases the shelf life of rice, maintains its nutritional value, and produces better results when cooked. Temperature and moisture content parameters act as the main determinants determining the product's final quality. Energy efficiency is an important component in realizing a sustainable agricultural system. The development of a real-time monitoring system facilitates more responsive and adaptive decision-making in the grain drying process, thereby increasing agricultural productivity.
The challenges in this implementation are closely related to the increasing global demand for food, which poses significant problems, including food loss of up to 1.3 billion tons per year and losses of up to 50% for perishable crops in developing countries [1]. A study outlines the need to integrate food security with monetary policy and export-import regulations [2]. The factors causing these losses include inadequate storage facilities and poor handling practices [3]. Innovative food science approaches can lead to more efficient processing and reduced resource use [4]. As a critical process in post-harvest processing, grain drying systems have evolved from traditional methods to automated systems. Conventional methods that are still used today face various challenges in consistency of quality and energy efficiency due to the limitations of precise monitoring systems.
Theoretically, critical aspects of the grain drying process include temperature control moisture content monitoring and effective energy consumption management. Research shows that uncontrolled variations in drying temperatures can significantly decrease grain quality [5]. In practical applications, inaccuracies in moisture content measurement have the potential to result in products with suboptimal humidity levels. Meanwhile, automated monitoring systems using sensors developed so far show potential to improve operational safety and reduce human error. However, the main challenges that remain are the relatively expensive implementation cost, the complexity of multi-sensor integration, and the need for an integrated monitoring framework that can optimize all critical parameters simultaneously under various operational conditions.
Grain drying is a complex heat and mass transfer process and is an essential step in post-harvest management [6]. This process reduces the moisture content to a level that can prevent decay, fungal growth, and deterioration in quality. This is very important to ensure the shelf life of the grain, especially in areas with high humidity. Reducing moisture content to the optimal range between 12% and 14% leads to a significantly reduced risk of biological activities such as fungal growth and insect infestation. This condition not only maintains the nutritional value and marketability of the grain but also reduces the survival rate of pests [7].
However, in the implementation of drying monitoring technology, although the DHT11 sensor and the HX711 load cell offer a low-cost solution, the effectiveness of their integration has not been comprehensively validated, especially in terms of accuracy, consistency, long-term humidity control, as well as its ability to survive environments with temperature fluctuations. Significant challenges also arise in measuring grain moisture content through load cells due to the complexity of the relationship between weight and moisture content, which is influenced by various environmental variables such as relative humidity of air, atmospheric pressure, and physical characteristics of grain varieties. The relationship between real-time load monitoring data and energy optimization strategies has also not been well characterized, which has the potential to cause energy inefficiency in the drying process. Optimizing energy consumption using real-time load monitoring on grain drying is a growing research, significantly minimizing environmental impact [8].
Conventional grain drying methods face limitations in providing precise control over critical drying parameters, resulting in inconsistent final product quality accompanied by significant energy waste and a long drying process [9-11]. The long-term perspective of system operation raises concerns about the calibration stability of sensor devices due to continuous exposure to high-humidity environments and extreme temperature changes that can lead to reduced accuracy and require repeated recalibration. This emphasizes the importance of modern agricultural drying systems to maintain global food quality and safety, minimize human error, and optimize energy use [12].
Previous studies of the development of IoT technology have opened up significant opportunities for the optimization of grain drying. Laha et al. [13] developed IoT systems for real-time humidity monitoring to monitor humidity temperature and improve water use efficiency. Meanwhile, Qenawy et al. [14] highlighted the importance of controlling drying kinetics for energy efficiency. However, previous studies have focused more on the technical aspects of monitoring systems without examining in depth the relationship between operational parameters and energy efficiency. In addition, the correlation between the variation in drying load and energy consumption in an integrated system still requires a more detailed quantitative analysis. The adaptability of the system to variations in environmental conditions is a critical aspect that requires further investigation, especially the system's performance in dealing with erratic weather fluctuations and the ability to maintain optimal drying efficiency. Previous research has tended to ignore the influence of seasonal variations on the performance of integrated sensors, resulting in a knowledge gap in reliable and sustainable grain drying systems.
IoT technology has revolutionized agriculture by enabling real-time monitoring and automation in decision-making [15, 16]. The IoT sensors offer significant benefits through continuous monitoring of humidity and temperature and ensuring an optimal and efficient drying process [17, 18]. The connected sensors transmit data instantly, providing information when the humidity level reaches the desired threshold and adjusting the heating temperature to prevent over- or under-drying [18]. Studies show that IoT implementations ensure even heat distribution, reducing mold growth and spoilage in grains [19-21], and produce high-quality dry products [21, 22] while minimizing energy consumption and saving costs [22]. As a result, IoT improves efficiency, security, and precision in operations, reducing the risk of product damage and improving grain quality and system flexibility [23, 24].
This research is important because integrated real-time monitoring of load, temperature, and energy in the grain drying process can significantly improve energy efficiency as well as product quality and the sustainability of agricultural systems, which are currently not optimal. This research aims to develop an IoT-based real-time framework to monitor the performance of load, temperature, and energy consumption in an integrated manner in the grain drying process. In addition, the system can measure and analyze the correlation of drying load fluctuations with energy consumption and evaluate the drying quality capability in adapting to variations in environmental conditions. This study hypothesises that an IoT-based integrated real-time monitoring system can reduce energy consumption by 20%-30% while improving product quality and reducing seed cracking cases by 15% compared to conventional systems.
The selection of the DHT11 sensor was chosen for temperature and humidity monitoring due to its advantages in terms of cost efficiency, low power consumption (2.5mA when data captured), and high compatibility with the Arduino microcontroller platform, despite its limitations in relative accuracy (±2℃ for temperature and ±5% for humidity) and a minimum reading interval of 2 seconds [25, 26]. Meanwhile, the HX711 load cell was chosen for its ability to provide high resolution (24-bit ADC) that enables precise load measurement of up to 0.1 grams, good signal stability with low noise, and dynamic measurement capabilities that are essential for monitoring grain weight changes during the drying process. The implementation of the system using a 1000-watt heater equipped with data-driven automatic control aims to achieve an optimal balance between energy efficiency and the quality of drying results. The integration of these components creates a system capable of supporting real-time decision-making for energy optimization and improvement of the final product quality. The system design is a development of the previous model [9, 23] With the innovation of two separate chambers: one for the hot airflow from the blower and the other for placing the grains, with a ventilation method connecting the two to ensure optimal airflow during drying. This system provides a warning when the moisture content of the grain reaches 12-14% [26, 27], allowing drying to be stopped at the optimal time.
System performance validation is carried out through controlled experiments under various environmental conditions. Real-time data analysis using a specially developed algorithm aims to establish a correlation between energy consumption, drying efficiency, and grain quality parameters. This experimental approach provides an in-depth understanding of the relationships between operational parameters and results in an optimization model that can be implemented on a commercial scale. Diverse system testing provides comprehensive validation of the effectiveness of the proposed technology integration while paving the way for developing more efficient and sustainable grain drying systems.
2.1 Research design
This study uses a quantitative approach to developing and validating IoT grain drying systems, which consists of two main phases, namely development and validation. The development phase includes designing an IoT architecture with a DHT11 sensor for temperature/humidity and an HX711 load cell for real-time mass measurement. Implementing a microcontroller-based control system for heating blowers is carried out in conjunction with developing a monitoring interface. The validation phase includes systematic experimental testing, including sensor calibration, accuracy verification, and stability testing under various operational conditions to ensure system performance reliability remotely in real time [28-30].
The system considers critical parameters such as drying temperature (40-75℃) to prevent physical damage to the grain, and relative humidity is monitored every 5 minutes. The measurement of grain mass was carried out continuously by the HX711 load cell with a sensitivity of 0.1g to detect weight changes due to reduced moisture content. Data from the sensor is transmitted via the MQTT protocol to the server every 30 seconds, including the temperature of the drying room and relative humidity, as well as the mass of grain and energy consumption. Energy consumption is calculated from the power of the 1000W blower multiplied by the duration of operation, and then the parameter is displayed on the web dashboard with a notification when the moisture content reaches 12-14%.
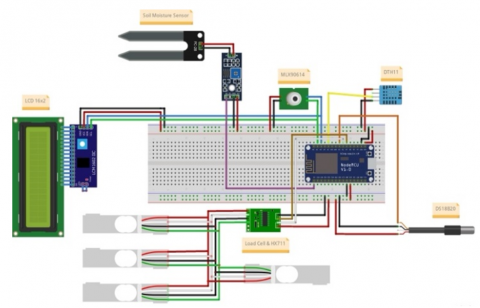
Furthermore, key components such as the heater blower, DHT11 sensor, and load cell are integrated into the system design using Fritzing software to create a circuit diagram (Figure 1). The schematic diagram includes a heating blower, DHT11 sensor, load cell, NodeMCU, and relay module assembled on a circuit board. A 220V socket powers the system and is then converted to 5V using a buck converter to support NodeMCU and other components.
Figure 1. The schematic diagram of the grain drying monitoring device
The NodeMCU functions as a control center positioned on top of the breadcutter board and then processes the signal from the DHT11 sensor. These sensors are placed at five strategic points of the drying room, namely the top and middle, the bottom and two sides, while the HX711 load cell is installed on the foot of the drying table to monitor weight changes. Temperature and humidity data is transmitted to the NodeMCU for processing while the load cell measures the weight of the grain in real time. The components are connected to an IoT platform controlled through a web interface. The Arduino IDE is used to program the microcontroller to monitor and control the automatic drying conditions based on specified parameters. When the moisture content reaches the optimal range of 12-14%, the system sends a signal to turn off the blower through the relay module, thus optimizing the process and ensuring safety and energy efficiency. The web interface presents real-time visualization of temperature, humidity, weight changes, and energy consumption estimates, enabling remote decision-making.
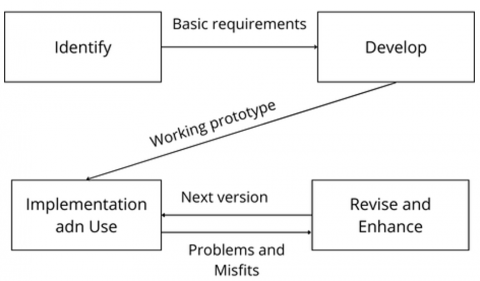
Furthermore, prototype and simulation methods are applied in system development as tools for initial model creation and functionality testing before full-scale implementation. This approach facilitates interaction with users to capture and understand their needs [26]. Feedback from potential users is collected during the development phase and then integrated into the next iteration of the prototype for system refinement [27].
Figure 2. Prototype method
In Figure 2, this system's development uses IoT-based control algorithms to regulate the heating blower's operation. This algorithm processes data from temperature and humidity sensors to adjust the blower speed and drying duration.
2.2 Population and sample
This study uses a purposive sampling technique to consider seasonal variations to ensure data representativeness in various environmental conditions. Grain samples were obtained from transmigration farmers in Merauke, South Papua, Indonesia, which produced an impressive productivity of 4.77 tons/ha in both the rainy and dry seasons [31]. Each sample is processed using standardized drying protocols to guarantee test consistency. Sample inclusion criteria include varietal uniformity, harvesting within 24 hours, and physical conditions that meet testing standards.
The characteristics of the grain samples were taken with a maximum harvest period of 24 hours before the test and then distributed based on the rainy season and summer with normal physical conditions without mechanical damage. This sampling approach allows for a comprehensive evaluation of the drying system's performance in dealing with variations in grain conditions due to seasonal differences.
2.3 Data collection and analysis
Data collection is done through an integrated monitoring system that records operational parameters in real-time based on certain sampling intervals. Each test session lasts for 8 hours with continuous recording of all measured parameters so that the data recording system can minimize data loss while ensuring the accuracy of results. The measurement system integrates several instruments, including temperature and humidity sensors, load cell mass measurement, and energy consumption; while data analysis uses a statistical approach, the measurement results are presented graphically. Furthermore, the observation and documentation system is designed to ensure the validity and reliability of the data and provide a strong foundation for a comprehensive analysis of the performance of the IoT-based drying system developed.
2.4 System setup and configuration
The elements of the IoT-based drying system, from heating blowers to sensors and load cells, are well integrated to achieve optimal results. Table 1 presents the specifications of the grain drying prototype used in this study.
Table 1. Specifications of IoT-based grain drying equipment
|
Component |
Specifications |
|
Component |
1000 Watt |
|
Heating Blower |
DHT11 |
|
Temperature Sensor |
HX711 |
|
Load Cell |
NodeMCU (ESP8266) |
|
Microcontroller |
220V AC to 5V DC |
|
Power Platform IoT |
Web-based monitoring and control |
|
Relay Module |
5V relay to operate the heating blower |
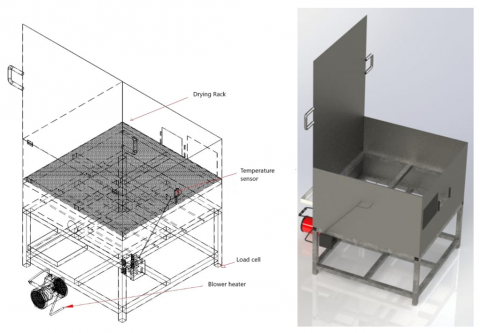
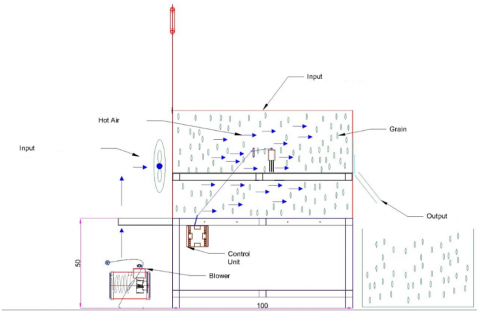
Based on the specifications outlined in Figure 3, the system ensures reliable and efficient drying through accurate monitoring and control, making it suitable for agricultural applications in humid and dry conditions. The blower is strategically designed to prevent direct grain exposure, allowing hot air to circulate through regulated and operated vents at 220V, 1000 watts, and 1350 RPM. This setting helps maintain a consistent temperature in the drying process.
Figure 3. Prototype design
Furthermore, the temperature and humidity are measured in real-time in the drying chamber using a DHT11 sensor positioned at a representative point of the average drying environment, ensuring an accurate reflection of actual conditions. Load cells are integrated to measure the grain's weight automatically during the drying process. These sensors are installed under the grain container and calibrated to detect weight changes due to water evaporation.
The ventilation system is integrated between the blower and the drying chamber to optimize hot air circulation while ensuring efficient and uniform drying throughout the grain. The integration of these components results in a robust solution and improves precision and energy efficiency in the entire drying process.
2.5 Testing and evaluation
The calibration was carried out using a direct comparison method with a standard load previously verified using a high-precision digital scale (Shimadzu ATX224 with an accuracy of ±0.1 mg). The calibration procedure is done through multi-point linear testing using standard 0-5000 grams range standard loads. The calibration factor (K) is calculated using Equation:
$K=\Delta Output\ ADC / \Delta Massa$ (1)
where $\Delta Output$ represents the output value of the ADC while $\Delta Massa$ is a change in the standard mass load given. This short-term results in a linear equation:
${Massa}(g)=( Nilai \ A D C-O f f s e t) / K$ (2)
To calculate total energy requirements ($Q_{ {total }}$) during the process of drying grain, the following equation is used:
$Q_{ {total }}=Q_s+Q_y-Q_r$ (3)
$Q_{ {total }}$ is the heat needed for drying $Q_s$ is the heat required to evaporate the water vapor, $Q_y$ is the heat consumed to warm the grains, and $Q_r$ is the heat that lost through the pipes and walls of the drying chamber. To calculate $Q_s$ and $Q_y$, the following equation is used:
$Q_s=m_1 . \lambda$ (4)
$Q_y=m_2 . c . \Delta T$ (5)
where, $m_1$ is the mass of water that will evaporate from the grain, $\lambda$ is the latent heat of grain evaporation, $m_2$ is the latent heat of grain evaporation, $c$ is is the grain's specific heat capacity, and $\Delta T$ is the change in temperature during the drying process.
The energy consumption test aims to evaluate the power consumption of the heating blower system during the drying process. The following is the basic formula used to calculate energy consumption:
$E=P \times t$ (6)
where, E represents the total energy consumed (in kWh), P is the power used by the heating blower (in watts), and t is the operating time (in hours). This formula makes it possible to assess the heating system's energy efficiency in the drying process. Analyzing energy consumption gives insights into optimizing operational parameters to reduce energy use while maintaining effective drying performance.
The accuracy of moisture detection is calculated by comparing sensor measurements against standard test devices using the error percentage formula:
${Error}(\%)=\frac{|M s-M r|}{M r} \times 100$ (7)
where, $M s$ is the moisture content value measured by the sensor, and $M r$ is the reference moisture content value (standard).
To support the temperature stability data during the rice drying process, the average temperature is calculated by summing all the data at each time interval before dividing it by the total number of time intervals measured:
$T_{ {avg }}=\frac{\sum_{i=1}^n T i}{n}$ (8)
where, $T_{{avg}}$ is the average temperature (℃), $T_1$ is the temperature at the first interval (℃), and $n$ is the total time interval.
Temperature standard deviation is used to measure the difference in temperature from the average.
$\sigma_T=\sqrt{\frac{\sum_{i=1}^n\left(T i-T_{ {avg }}\right)^2}{n}}$ (9)
where, $\sigma_T$ represents the standard deviation of temperature (℃), $T_i$ indicates the temperature at the first interval (℃), $T_{{avg}}$ is the average temperature (℃), and $n$ is the total number of time intervals measured.
The measurement of moisture content by weight is calculated using the following formula:
$M_w(t)=\frac{M_w(t)}{M_t(t)} \times 100$ (10)
where, $M_w(t)$ is the moisture content of the grain at the time of $t$ (%), $M_w(t)$ is the weight of water lost at time $t$ (gram), and $M_t(t)$ is the weight of grain at the time $t$ (gram).
To evaluate the drying efficiency, the following formula is used:
$\eta=\frac{M_w \times L_v}{E_{ {total }}}$ (11)
where, $\eta$ is the thermal drying efficiency, $M_w$ is a mass of evaporated water (kg), $L_v$ is latent heat evaporation, and $E_{ {total }}$ is the total energy used during drying (kWh). This calculation is essential for assessing the performance of the drying system, ensuring efficient operation while effectively reducing moisture content.
3.1 System performance
It presents a detailed analysis of the overall performance of the IoT-based grain drying system that has been tested. Testing includes essential aspects such as load cell calibration, drying rate, temperature stability in the drying process, and measurement accuracy obtained from the sensor.
3.1.1 Load cell calibration
The load cell calibration results are presented in Table 2, which shows the correlation between the standard load and the ADC value and the relative error calculation. Theoretically, the load cell used has an accuracy level of ± 1% [29].
Table 2. Load cell calibration results HX711
|
Standard Load (g) |
ADC Value (raw) |
Measured Value (g) |
Absolute Error (g) |
Relative Error (%) |
|
0 |
8420 |
0 |
0 |
0 |
|
100 |
42650 |
100.3 |
0.3 |
0.3 |
|
200 |
76880 |
200.6 |
0.6 |
0.3 |
|
500 |
179570 |
501.2 |
1.2 |
0.24 |
|
1000 |
353290 |
998.7 |
-1.3 |
-0.13 |
|
2000 |
701730 |
2002.5 |
2.5 |
0.13 |
|
3000 |
1050170 |
2997.8 |
-2.2 |
-0.07 |
|
4000 |
1398610 |
4003.6 |
3.6 |
0.09 |
|
5000 |
1747050 |
4998.9 |
-1.1 |
-0.02 |
Based on the calibration data, a calibration factor (K) of 347.73 was obtained with an offset value of 8,420. Linear regression analysis yields a coefficient of determination (R²) of 0.9998, which indicates an excellent linearity between the ADC value and the measured mass. The maximum relative error obtained is 0.30%, while the overall average relative error is 0.14%.
3.1.2 Drying rate
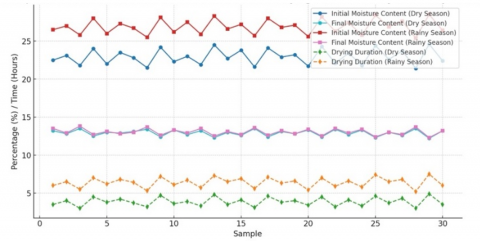
The drying rate is an essential indicator in assessing the system's efficiency. In this study, the system was tested to reduce the moisture content of the grain before it is dried during the rainy and dry seasons. The resulting dataset consists of 30 data points for the rainy and dry seasons. This indicates the initial and final moisture content, drying time, and reduction of moisture content for each season to reach 12-14% by the optimal moisture content standard for grain. The following is the test results data with a sample of 30 samples for each season.
This graph illustrates how the seasons affect the moisture content of the beginning and duration of drying and shows the effectiveness of IoT-based drying systems in achieving stable and compliant final moisture content. This difference in initial moisture content shows that grain harvested in the rainy season has a higher moisture content due to greater air humidity than in the dry season. The difference in drying time is due to environmental conditions, where the rainy season has higher air humidity, thus slowing down the water evaporation process from the grain. Next is Table 3 of the recapitulation of grain drying data using IoT with the number of test sample data, as many as 30 samples for each season.
Table 3. Summary of IoT-based grain drying results in dry and rainy season
|
Sample |
Season |
Initial Moisture Content (%) |
Drying Duration (Hours) |
Final Moisture Content (%) |
|
1 |
Dry Season |
22.5 |
3.5 |
13.2 |
|
2 |
Dry Season |
23.1 |
4 |
12.8 |
|
3 |
Dry Season |
21.8 |
3 |
13.5 |
|
4 |
Dry Season |
24 |
4.5 |
12.5 |
|
5 |
Dry Season |
22 |
3.8 |
13 |
|
6 |
Dry Season |
23.5 |
4.2 |
12.9 |
|
7 |
Dry Season |
22.8 |
3.7 |
13.1 |
|
8 |
Dry Season |
21.5 |
3.2 |
13.4 |
|
9 |
Dry Season |
24.2 |
4,7 |
12.4 |
|
10 |
Dry Season |
22.3 |
3,6 |
13.3 |
|
11 |
Dry Season |
23 |
3,9 |
12.7 |
|
12 |
Dry Season |
21.9 |
3,3 |
13.2 |
|
13 |
Dry Season |
24.5 |
4,8 |
12.3 |
|
14 |
Dry Season |
22.7 |
3,5 |
13 |
|
15 |
Dry Season |
23.8 |
4,1 |
12.6 |
|
16 |
Dry Season |
21.6 |
3,1 |
13.5 |
|
17 |
Dry Season |
24.1 |
4,6 |
12.4 |
|
18 |
Dry Season |
22.9 |
3,8 |
13.1 |
|
19 |
Dry Season |
23.2 |
4,0 |
12.8 |
|
20 |
Dry Season |
21.7 |
3,4 |
13.3 |
|
21 |
Dry Season |
24.3 |
4,5 |
12.4 |
|
22 |
Dry Season |
22.1 |
3,2 |
13.4 |
|
23 |
Dry Season |
23.4 |
4.1 |
12.7 |
|
24 |
Dry Season |
21.8 |
3.3 |
13.3 |
|
25 |
Dry Season |
24.4 |
4.6 |
12.3 |
|
26 |
Dry Season |
22.6 |
3.7 |
13 |
|
27 |
Dry Season |
23.7 |
4.3 |
12.6 |
|
28 |
Dry Season |
21.4 |
3 |
13.5 |
|
29 |
Dry Season |
24.6 |
4.9 |
12.2 |
|
30 |
Dry Season |
22.4 |
3.5 |
13.2 |
|
31 |
Rainy Season |
26.5 |
6 |
13.5 |
|
32 |
Rainy Season |
27 |
6.5 |
12.9 |
|
33 |
Rainy Season |
25.8 |
5.5 |
13.8 |
|
34 |
Rainy Season |
28 |
7 |
12.7 |
|
35 |
Rainy Season |
26 |
6.2 |
13.1 |
|
36 |
Rainy Season |
27.3 |
6.8 |
12.8 |
|
37 |
Rainy Season |
26.7 |
6.4 |
13 |
|
38 |
Rainy Season |
25.5 |
5.3 |
13.7 |
|
39 |
Rainy Season |
28.1 |
7.2 |
12.6 |
|
40 |
Rainy Season |
26.2 |
6.1 |
13.3 |
|
41 |
Rainy Season |
27.5 |
6.7 |
12.9 |
|
42 |
Rainy Season |
25.9 |
5.7 |
13.5 |
|
43 |
Rainy Season |
28.3 |
7.3 |
12.5 |
|
44 |
Rainy Season |
26.6 |
6.5 |
13.1 |
|
45 |
Rainy Season |
27.2 |
6.9 |
12.7 |
|
46 |
Rainy Season |
25.7 |
5.6 |
13.6 |
|
47 |
Rainy Season |
28 |
7.1 |
12.6 |
|
48 |
Rainy Season |
26.8 |
6.3 |
13.2 |
|
49 |
Rainy Season |
27.1 |
6.6 |
12.8 |
|
50 |
Rainy Season |
25.6 |
5.4 |
13.4 |
|
51 |
Rainy Season |
28.2 |
7 |
12.5 |
|
52 |
Rainy Season |
26.3 |
5.9 |
13.5 |
|
53 |
Rainy Season |
27.4 |
6.6 |
12.9 |
|
54 |
Rainy Season |
25.8 |
5.8 |
13.4 |
|
55 |
Rainy Season |
28.4 |
7.4 |
12.4 |
|
56 |
Rainy Season |
26.9 |
6.5 |
13 |
|
57 |
Rainy Season |
27.6 |
6.8 |
12.7 |
|
58 |
Rainy Season |
25.4 |
5.2 |
13.7 |
|
59 |
Rainy Season |
28.5 |
7.5 |
12.3 |
|
60 |
Rainy Season |
26.4 |
6 |
13.2 |
Based on the test results, during the rainy season, the initial moisture content of the grain ranges from 25% to 30%. Meanwhile, in the dry season, the moisture content ranges from 18% to 25%. Both seasons target a final moisture content of 12-14%, ideal for grain storage. The drying time during the rainy season lasts 5 to 7 hours, longer than the dry season, which only takes 3 to 5 hours. This difference is due to higher initial moisture content and drier environmental conditions. This study shows improvements in the grain drying system by optimizing the temperature and reducing the drying time.
Furthermore, Figure 4 presented a comparative graph of the initial and final moisture content for each sample in the dry and rainy seasons, as well as the duration of drying in both seasons.
Figure 4. Comparison of drying times based on seasonal variations
According to a survey conducted by Leal et al. [32], temperature is maintained at 75℃ to preserve the quality of the grain and shorten the drying time. The result is more energy-efficient and has minimal impact on grain quality, making the system more environmentally friendly and efficient.
Table 4 shows that the initial moisture content in the dry season averages 22.9% with a standard deviation (SD) of 1.0%, while in the rainy season, it is higher at 26.9% and 1.0%.
Table 4. Recapitulation of grain drying data using IoT
|
Season |
Initial Moisture Content (%) (Mean ± SD) |
Drying Duration (Hours) (Mean ± SD |
Final Moisture Content (%) (Mean ± SD) |
|
Dry Season |
22.9 ± 1.0 |
3.9 ± 0.6 |
13.0 ± 0.4 |
|
Rainy Season |
26.9 ± 1.0 |
6.5 ± 0.7 |
13.0 ± 0.5 |
Meanwhile, the drying time in the dry season was shorter (3.9 ± 0.6 hours) than in the rainy season (6.5 ± 0.7 hours), showing a difference in drying effectiveness due to different environmental conditions. The final moisture content in both seasons reached the targeted final moisture content with an average of 13.0% and SD around 0.4-0.5%, indicating the consistency of the IoT-based drying system.
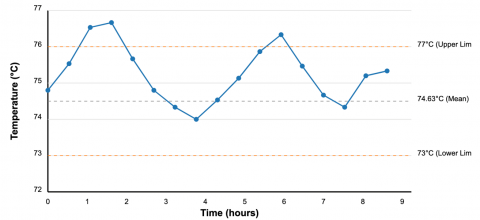
3.1.3 Temperature stability
Temperature stability during the drying process is very important to ensure drying quality and process efficiency, thereby maintaining grain quality. The following is Table 5 presents the temperature stability data during the drying process.
In-depth statistical analysis shows that the IoT-based grain drying system has good temperature stability with an average of 74.63℃ and a standard deviation of 1.49℃ during the 8-hour drying process. The coefficient of variation (CV) of 2.0% indicates high system consistency. The 95% confidence interval for the average temperature is 74.63℃ ± 0.71℃, indicating the system's reliability in maintaining the target temperature.
Table 5. Temperature stability data during grain drying process
|
Time (hours) |
Temperature (℃) |
|
0.0 |
74.2 |
|
0.5 |
75.3 |
|
1.0 |
76.8 |
|
1.5 |
77.0 |
|
2.0 |
75.5 |
|
2.5 |
74.2 |
|
3.0 |
73.5 |
|
3.5 |
73.0 |
|
4.0 |
73.8 |
|
4.5 |
74.7 |
|
5.0 |
75.8 |
|
5.5 |
76.5 |
|
6.0 |
75.2 |
|
6.5 |
74.0 |
|
7.0 |
73.5 |
|
7.5 |
74.8 |
|
8.0 |
75.0 |
Comparisons with industry standards show that this drying system has superior performance. Temperature fluctuations of ±1.49℃ are better than the industry standard, which generally tolerates ±2.5℃. The FAO recommendation for grain drying temperature fluctuations is not to exceed 5℃, and the system successfully maintains a range of 4℃.
The temperature stability graph in Figure 5 shows a regular fluctuation pattern during the 8-hour drying process with 0.5-hour interval measurements. The initial temperature of 74.2℃ gradually increased until it reached a peak of 77.0℃ in the first 1.5 hours, then decreased to a low of 73.0℃ in 3.5 hours. Subsequently, the temperature rises again to 76.5°C at 5.5 hours and decreases again before finally stabilizing at 75.0℃ at the end of the process. The temperature fluctuation range (73-77℃) remains within the recommended limits for optimal grain drying. This graph validates the effectiveness of the controls implemented in IoT-based systems to maintain temperature stability during the drying process.
Figure 5. Temperature stability during the grain drying process
The relationship between temperature stability and drying efficiency is significant in this system. Pearson's correlation analysis showed a strong positive relationship (r=0.78) between temperature stability and drying efficiency. Each 0.5℃ reduction in standard temperature deviation results in a 2.3% increase in drying efficiency. The drying efficiency of 67.1% is obtained because the system is able to maintain the temperature in the optimal range of 73-77℃, which is the best range for water evaporation without causing damage to the grain structure.
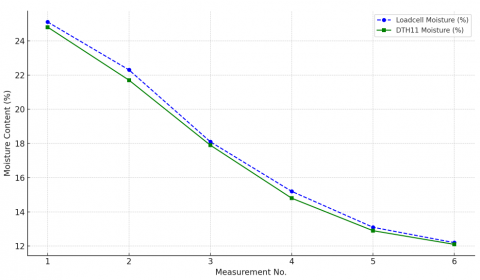
3.1.4 Humidity measurement using a load cell and DHT11 sensor
Moisture measurement based on weight is carried out using the principle of difference in grain weight before and after the drying process. Next, the value is calculated and compared with the measurements obtained from the DHT11 sensor.
The results shown in Figure 6 indicate that both sensors had the same tendency for moisture reduction. Although there are small differences at certain measurement points, the comparison remains within an acceptable range. This indicates that the load cell and DHT11 sensors have sufficient accuracy to monitor moisture content during drying. The average deviation of both methods was ± 1.5%. This shows that the load cell measurement and the DHT11 sensor can complement each other in grain drying. These results also prove the framework and effectiveness of the integration of the DHT11 sensor and HX711 load cell with measurement accuracy and stable long-term control consistency with a 96.7% improvement in product quality.
Figure 6. Comparison of moisture content measurement between the load cell and DHT11 sensor
3.2 Energy consumption
Energy consumption evaluation is a crucial aspect of the performance of IoT-based grain drying systems. Energy consumption and efficiency are evaluated by comparing the energy required to evaporate water and maintain temperature stability [33]. Based on research data, to dry 100 kg of grain from the initial moisture content of 25% to 12%, evaporation of 13 kg of water is required. This process requires an evaporation energy of 8.16 kWh, which is calculated using Eq. (4). The other energy component comes from the operation of the blower for 4 hours, which consumes 4 kWh to maintain the temperature in the drying chamber. The total energy consumption for one drying cycle is 12.16 kWh, with a distribution of 67.1% for evaporation energy and 32.9% for blower energy. Based on the above results, they can be summarized in Table 6.
Table 6. Energy distribution in the IoT-based grain drying system
|
Energy Component |
Energy Consumption (kWh) |
Percentage (%) |
|
Evaporation Energy |
8.16 |
67.1 |
|
Blower Operation (4 hours) |
4 |
32.9 |
|
Total Energy |
12.16 |
100 |
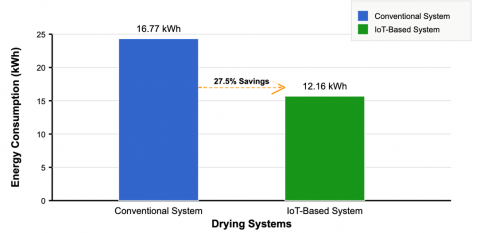
Here is a comparative graph of IoT-based energy efficiency and conventional systems.
The drying system presented in Figure 7 shows a 27.5% improvement in energy efficiency compared to conventional drying systems, which generally require about 16.77 kWh for an equivalent drying process. This efficiency is achieved through a multi-layer IoT control system architecture including a data acquisition layer that collects temperature, humidity, and weight data in real-time with sample intervals every 30 seconds; in addition, the processing layer uses an Arduino microcontroller using the Fuzzy Logic algorithm to analyze sensor data and determine optimal parameters; and an execution layer consisting of a relay and an air circulation control motor. The system makes adaptive decisions based on a modified PID (Proportional-Integral-Derivative) algorithm with parameters Kp=2.5, Ki=0.8, and Kd=0.3, which continuously adjusts the heating power based on the difference between the target and actual temperatures, as well as the rate of change in grain weight. This decision-making process occurs in 5-second intervals, allowing for a quick response to changing conditions. Figure 8 shows the energy distribution from the heating blower to the grain drying chamber.
Figure 7. Energy efficiency comparison: IoT-based v.s. Conventional system
Figure 8. Heater blower energy distribution
3.3 Moisture detection accuracy and drying efficiency results
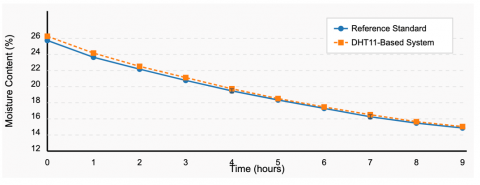
The moisture content monitoring system integrates two main sensing elements: a DHT11 sensor for environmental humidity measurement and a load cell for continuous mass monitoring. To validate the accuracy of the system, use a standard moisture meter calibrated with an accuracy of ±0.5%. Drying efficiency is evaluated based on the system's capacity to lower the moisture content of the grain to the optimal storage range (12-14%) within the operational period. Table 7 presents a comparative analysis between moisture content measurements from DHT11-based systems and reference standard instruments throughout the drying timeline.
Table 7. Comparison of moisture content measurement between IoT systems and reference standards
|
Time (hours) |
Reference Standard (%) |
DHT11 Based System (%) |
Absolute Difference (%) |
Relative Error (%) |
|
0 |
24.8 |
25.3 |
0.5 |
2.02 |
|
1 |
22.6 |
23.1 |
0.5 |
2.21 |
|
2 |
20.9 |
21.3 |
0.4 |
1.91 |
|
3 |
19.4 |
19.8 |
0.4 |
2.06 |
|
4 |
18.1 |
18.4 |
0.3 |
1.06 |
|
5 |
16.7 |
17 |
0.3 |
1.8 |
|
6 |
15.5 |
15.8 |
0.3 |
1.94 |
|
7 |
14.3 |
14.6 |
0.3 |
2.1 |
|
8 |
13.5 |
13.7 |
0.2 |
1.48 |
|
9 |
12.8 |
13 |
0.2 |
1.56 |
|
Average |
- |
- |
0.34 |
1.92 |
The analysis showed an average absolute difference of 0.34 percentage points between the measurements, which correlated with an average relative error of ±1.92%. This relatively low error rate indicates that the DHT11-based system accurately detects moisture content during the drying process. Small differences can be attributed to environmental factors, including fluctuations in ambient humidity, temperature variations, and sensor calibration quality.
The graph in Figure 9 shows the temporal evolution of moisture content measured by the IoT system and the reference standard instrument, indicating a close match between the two measurement methods. The results show an average error percentage of ±1.92%. This relatively low value indicates that the sensor accurately detects the moisture content during the drying process. Slight differences can be attributed to environmental factors such as humidity and temperature fluctuations and the quality of the sensor calibration. Drying efficiency is assessed based on the system's ability to reduce grain moisture content. Based on the calculation results using Eq. (10), the drying efficiency was calculated to be 67.1%. This result represents a significant improvement compared to the previous method, especially the 64.8% efficiency reported for LPG-based systems in previous studies [34].
Figure 9. Comparison of moisture content measurements during drying process
In conclusion, this study successfully developed an integrated IoT-based real-time framework for monitoring the performance of load, temperature, and energy consumption in the grain drying process. Increased drying efficiency of moisture content by 67.1%, energy efficiency yield of 27.5% and consistency of drying quality reached 96.7%, through precision power modulation. From an environmental perspective, the system has a positive impact through a reduction in carbon footprint thanks to the optimization of electricity consumption and the reduction of wasted energy. A 20-30% reduction in drying time compared to traditional methods also means a reduction in household gas emissions. In addition, the use of IoT for process optimization reduces the need for fossil fuels and reduces grain waste due to more consistent drying quality. However, several negative environmental impacts need to be considered, including increased electronic waste from sensor components that have a service life of 2-3 years, additional electricity consumption of 2.4W for IoT network operations, and potential electromagnetic interference with other agricultural systems. The implementation of the system on farmers in Merauke provides sustainable solutions that support food security, with far-reaching implications for various scales of drying operations. Further research is needed to overcome the limitations of the system under extreme conditions, develop more advanced optimization methods, and mitigate the environmental impact of electronic components.
The author is grateful to the Directorate of Research, Technology, and Community Service (DRTPM), Indonesia (based on Decree Number 0459/E5/PG.02.00/2024 and Agreement/ Contract Letter Number 062/ E5/ PG.02.00.PL/ 2024), for supporting this research. The authors also thank Musamus University for its continuous support, which contributed to the successful completion of this research.
|
CV |
koevisien variation |
|
kWh |
electrical Energy Unit |
|
MQTT |
standards-based messaging protocols |
|
NodeMCU |
ESP8266-based microcontroller |
|
PID |
feedback-based control loop mechanism |
|
RPM |
Number of revolutions per minute |
|
K |
calibration factors |
|
Greek symbols |
|
|
$\Delta$ |
change in load mass value |
|
$\lambda$ |
ceat change |
|
$\sigma$ |
deviasi standar suhu (℃) |
|
$\eta$ |
thermal drying efficiency |
|
Subscripts |
|
|
T |
temperature |
|
p |
power used |
|
E |
Energy |
[1] Kansanga, M.M., Mohammed, K., Batung, E., Ansumah Saaka, S., Luginaah, I. (2023). Lost harvest: Examining the association between postharvest food loss and food insecurity in semi-arid Ghana. International Journal of Sustainable Development & World Ecology, 30(7): 776-791. https://doi.org/10.1080/13504509.2023.2198507
[2] Bozsik, N., Cubillos T, J.P., Stalbek, B., Vasa, L., Magda, R. (2022). Food security management in developing countries: Influence of economic factors on their food availability and access. PloS One, 17(7): e0271696. https://doi.org/10.1371/journal.pone.0271696
[3] Yan, H., Song, M.J., Lee, H.Y. (2021). A systematic review of factors affecting food loss and waste and sustainable mitigation strategies: A logistics service providers’ perspective. Sustainability, 13(20): 11374. https://doi.org/10.3390/su132011374
[4] de Vries, H., Axelos, M.A., Sarni-Manchado, P., O'Donohue, M. (2018). Meeting new challenges in food science technology: The development of complex systems approach for food and biobased research. Innovative Food Science & Emerging Technologies, 46: 1-6. https://doi.org/10.1016/j.ifset.2018.04.004
[5] Liu, W., Yin, T., Zhao, Y., Wang, X., Wang, K., Shen, Y., Ding, Y., Tang, S. (2021). Effects of high temperature on rice grain development and quality formation based on proteomics comparative analysis under field warming. Frontiers in Plant Science, 12: 746180. https://doi.org/10.3389/fpls.2021.746180
[6] Liu, Z., Xu, Y., Han, F., Zhang, Y., Wang, G., Wu, Z., Wu, W. (2022). Control method for continuous grain drying based on equivalent accumulated temperature mechanism and artificial intelligence. Foods, 11(6): 834. https://doi.org/10.3390/foods11060834
[7] Zakladnoy, G.A. (2018). Effect of grain infestation with the rice weevil Sitophilus oryzae L.(Coleoptera, Dryophthoridae) on the quality of grain and grain products. Entomological Review, 98(6): 659-662. https://doi.org/10.1134/S0013873818060015
[8] Panigrahi, S.S., Luthra, K., Singh, C.B., Atungulu, G., Corscadden, K. (2023). On-farm grain drying system sustainability: Current energy and carbon footprint assessment with potential reform measures. Sustainable Energy Technologies and Assessments, 60: 103430. https://doi.org/10.1016/j.seta.2023.103430
[9] Situmorang, V., Pratama, Y., Tambunan, I.H., Hutagalung, F.W., Sagala, A. (2022). Internet of Things-based food product drying oven using shallow geothermal heat. In 2022 IEEE International Conference of Computer Science and Information Technology (ICOSNIKOM), Laguboti, North Sumatra, Indonesia, pp. 1-5. https://doi.org/10.1109/ICOSNIKOM56551.2022.10034881
[10] Suherman, S., Djaeni, M., Kumoro, A.C. (2017). Drying Kinetics of paddy in fluidized bed with immersed heating element. Advanced Science Letters, 23(3): 2364-2366. https://doi.org/10.1166/asl.2017.8672
[11] Li, T., Li, C., Li, B., Li, C., Fang, Z., Zeng, Z., Ou, W., Huang, J. (2020). Characteristic analysis of heat loss in multistage counter-flow paddy drying process. Energy Reports, 6: 2153-2166. https://doi.org/10.1016/j.egyr.2020.08.006
[12] Kalandarov, P.I., Mukimov, Z.M., Nigmatov, A.M. (2022). Automatic devices for continuous moisture analysis of industrial automation systems. In Proceedings of the 7th International Conference on Industrial Engineering (ICIE 2021) Volume II 7, pp. 810-817. https://doi.org/10.1007/978-3-030-85230-6_96
[13] Laha, S.R., Pattanayak, B.K., Pattnaik, S., Mishra, D., Nayak, D.S.K., Dash, B.B. (2023). An IOT-based soil moisture management system for precision agriculture: Real-time monitoring and automated irrigation control. In 2023 4th International Conference on Smart Electronics and Communication (ICOSEC), Trichy, India, pp. 451-455. https://doi.org/10.1109/ICOSEC58147.2023.10276266
[14] Qenawy, M., Ali, M., El-Mesery, H.S., Hu, Z. (2024). Analysis and control of hybrid convection-radiation drying systems toward energy saving strategy. Journal of Food Science, 89(12): 9559-9576. https://doi.org/10.1111/1750-3841.17522
[15] Mohamed, S., Hassan, A.M., Aslan, H. K. (2021). IoT modes of operations with different security key management techniques: A survey. International Journal of Safety and Security Engineering, 11(6): 641-651. https://doi.org/10.18280/ijsse.110604
[16] Tzounis, A., Katsoulas, N., Bartzanas, T., Kittas, C. (2017). Internet of Things in agriculture, recent advances and future challenges. Biosystems Engineering, 164: 31-48. https://doi.org/10.1016/j.biosystemseng.2017.09.007
[17] Vedantam, K.S., Jain, S.K., Panwar, N.L., Sunil, J., Wadhawan, N., Kumar, A. (2024). Emergence of Internet of Things technology in food and agricultural sector: A review. Journal of Food Process Engineering, 47(8): e14698. https://doi.org/10.1111/jfpe.14698
[18] Borges, R.C., Beuter, C.H., Dourado, V.C., Bento, M.E. (2024). Internet of things application in an automated irrigation prototype powered by photovoltaic energy. Energies, 17(9): 2219. https://doi.org/10.3390/en17092219
[19] Aggarwal, N., Singh, D. (2021). Technology assisted farming: Implications of IoT and AI. IOP Conference Series: Materials Science and Engineering, 1022(1): 012080. https://doi.org/10.1088/1757-899X/1022/1/012080
[20] Zari, B.B., Samonte, N.P., Mendoza, M.B., Taruc, S.C.M., Evangelista, J.O.C., Tuazon, E.C.D. (2023). Automated IoT-based paddy grain monitoring system for enhanced storage efficiency and quality assurance. In 2023 IEEE 9th International Conference on Smart Instrumentation, Measurement and Applications (ICSIMA), Kuala Lumpur, Malaysia, pp. 220-224. https://doi.org/10.1109/ICSIMA59853.2023.10373499
[21] Viviane, I., Masabo, E., Joseph, H., Rene, M., Bizuru, E. (2023). IoT-based real-time crop drying and storage monitoring system. International Journal of Distributed Sensor Networks, 2023(1): 4803000. https://doi.org/10.1155/2023/4803000
[22] Mishra, N., Jain, S.K., Agrawal, N., Jain, N.K., Wadhawan, N., Panwar, N.L. (2023). Development of drying system by using Internet of Things for food quality. Energy Nexus, 11: 100219. https://doi.org/10.1016/j.nexus.2023.100219
[23] Mahmood, N., Liu, Y., Munir, Z., Zhang, Y., Niazi, B.M.K. (2022). Effects of hot air assisted radio frequency drying on heating uniformity, drying characteristics and quality of paddy. LWT, 158: 113131. https://doi.org/10.1016/j.lwt.2022.113131
[24] Chokphoemphun, S., Chokphoemphun, S. (2018). Moisture content prediction of paddy drying in a fluidized-bed drier with a vortex flow generator using an artificial neural network. Applied Thermal Engineering, 145: 630-636. https://doi.org/10.1016/j.applthermaleng.2018.09.087
[25] Narayana, T.L., Venkatesh, C., Kiran, A., Kumar, A., Khan, S.B., Almusharraf, A., Quasim, M.T. (2024). Advances in real time smart monitoring of environmental parameters using IoT and sensors. Heliyon, 10(7): e28195. https://doi.org/10.1016/j.heliyon.2024.e28195
[26] Anand, A., Sid, S., Shrivastva, M., Rajak, D., Islam, A., Jain, M. (2023). Performance evaluation of low-cost grain dryer. Ecology, Environment and Conservation, 29(May Suppl. Issue): S165-S175. https://doi.org/10.53550/EEC.2023.v29i03s.032
[27] Allameh, A. (2021). Rice seed germination attributes dried by a recirculating dryer. IDESIA (Chile), 39(1): 87-92. https://doi.org/10.4067/S0718-34292021000100087
[28] Khujamatov, H., Davronbekov, D., Khayrullaev, A., Abdullaev, M., Mukhiddinov, M., Cho, J. (2024). ERIRMS evaluation of the reliability of IoT-Aided remote monitoring systems of low-voltage overhead transmission lines. Sensors, 24(18): 5970. https://doi.org/10.3390/s24185970
[29] Susanto, B., Feriadi, K., Virginia, G., Proboyekti, U. (2023). Improving cultural objects portal application usability using user usability evaluation. In 2023 IEEE International Conference on Data and Software Engineering (ICoDSE), Toba, Indonesia, pp. 132-137. https://doi.org/10.1109/ICoDSE59534.2023.10291234
[30] Hekmatpour, S. (1987). Experience with evolutionary prototyping in a large software project. ACM SIGSOFT Software Engineering Notes, 12(1): 38-41. https://doi.org/10.1145/24574.24577
[31] Merauke, B.P.S.K. (2024). Kabupaten Merauke Dalam Angka BPS Kabupaten Merauke.
[32] Leal, A.F., Coradi, P.C., Moraes, R.D.S., Müller, E., Teodoro, P.E., Teodoro, L.P.R., Rodrigues, D.M. (2023). Tempering time and air temperature relationships for real-scale paddy drying and their effects on the physical, physicochemical, and morphological qualities of polished rice. Drying Technology, 41(11): 1878-1892. https://doi.org/10.1080/07373937.2023.2199834
[33] Wang, G., Qiao, F., Yue, Z. (2022). Research on energy saving and environmental protection electric power grain circulation drying system. Journal of Advanced Thermal Science Research, 9: 38-49. https://doi.org/10.15377/2409-5826.2022.09.4
[34] Pramono, E.K., Taufan, A., Putra, S.A., Karim, M.A., Haryanto, A., Kuala, S.I. (2022). Performance tests of loadcell as real-time moisture content sensor: Case study moringa oleifera leaves drying. IOP Conference Series: Earth and Environmental Science, 1024(1): 012018. https://doi.org/10.1088/1755-1315/1024/1/012018