Ali A. Abdul-Sahib*![]() | Thair J. Alfatlawi
| Thair J. Alfatlawi![]()
© 2024 The authors. This article is published by IIETA and is licensed under the CC BY 4.0 license (http://creativecommons.org/licenses/by/4.0/).
OPEN ACCESS
The air is trapped in spillways, pipelines, conduits, and channels which leads to air-water flow and the accumulation of air bubbles that can form large air pockets. These air pockets can cause significant structural failures due to the dynamic consequences they induce. Consequently, this paper investigates the incidents and events that occur due to air pocket formation and measures and strategies to mitigate these issues. The investigation was conducted independently based on a literature review. The literature review focused on interpreting the mechanisms involved in the production of air bubbles and air pockets in pipelines. The research comprehensively examined all occurrences and adverse outcomes associated with the formation of air pockets, including the slug flow phenomena, air entrainment, and air blowout incidents. Moreover, this study reviewed all measures and strategies to mitigate the consequences resulting from air bubbles, such as slug flow management, air management techniques, air pocket explosion, and air entrainment. The results of the literature review showed a lack of predictions of air pocket consequences. Furthermore, the majority of the research conducted relies on prior datasets, observations, and experimental tests. However, these studies are unable to adequately demonstrate the limitations associated with the occurrence of air pockets in hydraulic structures. This is mostly owing to the challenges and constraints in managing the boundary conditions within physical models. Also, all experimental studies addressed the air pocket formation only in pipelines, and there was a lack of studies on the consequences of air pockets in hydraulic structures such as spillways and tunnel systems. Additionally, there was a lack of studies that address CFD techniques using developed software such as ANSYS; these techniques have proven their abilities to predict several consequences caused by air pockets. CFD techniques can simulate any complex problem correlated to air pocket events. This study can address air pocket consequences in any hydraulic structure: Morning Glory spillways, key piano spillways, and drop shaft spillways. Furthermore, this technique can adopt various parameters and extend measures and strategies to mitigate air pocket formation in hydraulic structures. The paper recommends the use of the CFD technique for further studies in the field of air pocket mitigation. Also, as a result of spillway structures, especially Morning Glory spillways, the paper recommends executing further research to predict consequences resulting from air pockets in hydraulic structures and investigate more remedial strategies to mitigate these consequences.
air pocket, air entrainment, air bubbles, spillways, air management, air blow out, slug flow
Spillways are water structures with or without gates utilized to drain water from a reservoir [1]. Spillways are considered the most significant and major structures in the dam's life. The components of spillways comprise three main parts: the inlet component, the transport component, and the outlet component [2]. The competency and well-done performance of these structures demand an accurate and credible design. Spillways can be found in different forms: Free Over-Fall, Side Channel Spillway, Chute Spillway, Shaft Spillway, Siphon Spillway, Cascade Spillway, and Tunnel Spillway. The most popular type is the Morning-Glory spillways, which are standing structures inside the reservoir of the dam that play a significant role in the dam's performance [3]. The Morning Glory spillway can be named as a Shaft spillway, which is a kind of drain flood from the reservoir of the dam. This kind is built in narrow valleys where it is hard to construct another type of spillway, and also in ground or rock fill embankments where the spillway should be built at a distance from the dam shaft to minimize the hazard of exceeding. Despite all the benefits of this kind, caution in design should be taken to avoid any constitution of vortices, cavitation, and air bubbles in the inlet of the spillway [4]. The presence of air pockets in hydraulic systems can cause various problems, such as decreased strength, disruption of flow, reduced cross-section, and damage to conduit and pipeline materials. It can also alter the characteristics of the fluid and raise ecological concerns at the discharge point [5].
This paper addresses the mechanism of air bubble formation in closed pipes, drop shaft spillways, and Morning Glory spillways. Also, this paper discusses the negative effects of air bubble formation that occur during the flow process and the damage that occurs because of this phenomenon and also provides a comprehensive literature review of strategies that have been used academically and practically to mitigate the formation of air pockets and air bubbles.
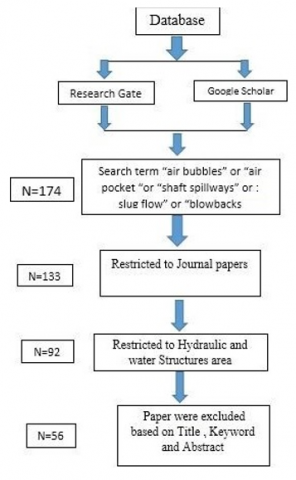
This article has used a methodical study of the literature process. Since "Google scholar" and "Research Gate" index an extensive range of hydraulic and water-related engineering and literature in the form of journals, conferences, and book chapters, we chose these two databases to analyze text mining literature that has been issued in air pockets phenomena in hydraulic structures. Additionally, these scientific websites include a number of alternatives for users to conduct advanced literature searches. As a result, we pulled the research papers for this study from the "Research Gate" and "Google Scholar" databases. First, the study papers were retrieved from the January 2024 database indicated. We selected the search terms "air bubbles," "air pockets," "shaft spillways," "slug flow," "blowbacks," and "Geyser" in order to retrieve the research papers. For integrating the search phrase, we used the Boolean "AND" and "OR" operators in the search field. For the first download of published research material, we used a search on "Article Title" and "Article Keywords." From the query result, we extracted 174 research publications in the first phase. After limiting our study to publications published in journals exclusively in the second phase, the total number of articles was down to 133. The number of research publications dropped to 92 in the third phase when we narrowed our focus to the Hydraulic and Water Structures field. In order to weed out unsuitable publications, we reviewed the abstracts, titles, and keywords of the chosen papers in the last stage. Papers that did not pertain to the goal of the systematic review process—namely, the effects of air pockets on hydraulic structures and strategies for mitigating them—were omitted. In the end, 56 research articles that were perfect for the pertinent subject were received. The procedure of selecting articles for review and the total number of papers (N) in each phase are depicted in Figure 1.
Figure 1. Research framework
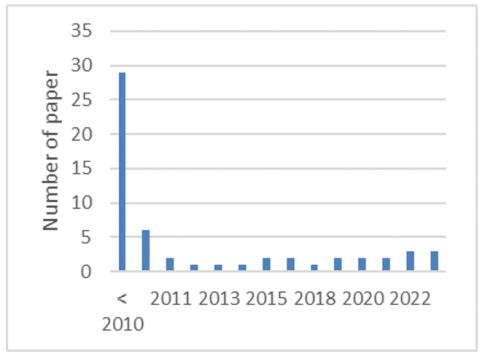
The study's statistical chart, which shows the number of papers published between 2010 and 2023 on the relevant topic, highlights the dearth of scholarly studies that address the effects of air pockets and corrective measures to mitigate their hazards in hydraulic structures. The remaining papers reviewed were published prior to 2010, as shown in Figure 2.
Figure 2. Papers reviewed between 2010 and 2023
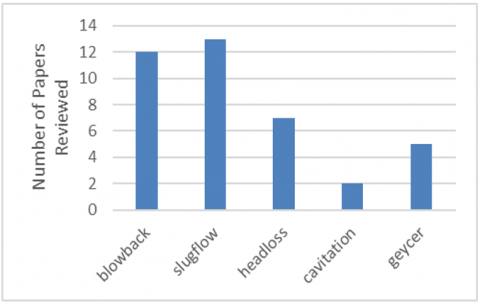
Figure 3 shows that most academic studies and research focused on air management by providing mechanical solutions to remove air bubbles and air pockets from hydraulic installations, followed by research dealing with incidents related to both slug flow and blowback, while a smaller number of studies focused on the issue of geyser. There are significant limitations in addressing the issue of cavitation in pipes and spillways.
Figure 3. Research topics that reviewed
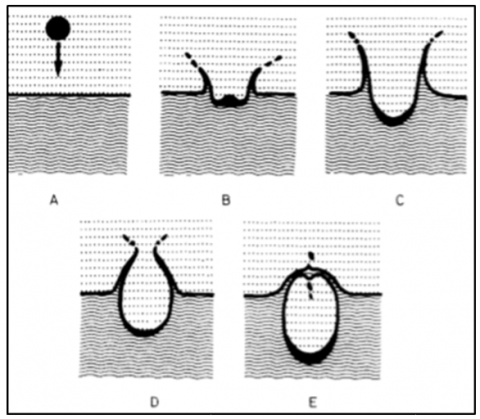
Volkart [6] introduced an explanation of how air bubbles are formed in conduits. The bubble is formed using a water drop. The drop clashes with the surface in the vertical direction. After the drop becomes partially flat, at the same time, a water hole is constituted. Then the drop is moved slowly to a certain depth and a water loop is constituted. As a result of tension that occurs at the surface, the water loop starts to close, and the air bubble is formed when the loop is fully closed. Figure 4 illustrates the air bubble formation mechanism.
Figure 4. Explanation of air bubble formation [6]
The publication by Sato et al. [7] in a closed conduit, water with a free surface leak downstream at a high velocity, causing a significant amount of air to be consumed. This air consumption exceeds the intended flow rate when energy generation needs to be shut down. Failure to discharge trapped air in the conduit results in the separation of the air-water two-phase flux into discrete air bubbles and water slugs. Trapped air bubbles have a tendency to gather at higher points along a wavy section, forming larger air pockets.
(a) Air entrainment in the pump’s basin [8]
(b)Air entrainment by a drop shaft system [9]
Figure 5. Air entrainment in water distribution system
According to Dean [10], small bubbles, known as tiny bubbles, are a significant source of dissolved air in water, accounting for up to 2% of the total air content. These bubbles can be released from a mixture in the form of little air bubbles when there is low pressure or high temperature. Low-pressure areas are likely to occur at higher elevations along a curved passage or within partially open channels. The release of dissolved air from a mixture occurs due to fluctuations and increased temperature. Cooler water can hold less dissolved air when it is saturated, and fluctuations in temperature further facilitate the interchange of gases. Significant volumes of air can accumulate within conduit systems due to several factors. Air can infiltrate tubes and get entrained at higher points during rapid mobilization procedures [11]. Air is intentionally introduced using AVVs (Air Ventilation Valves) to control confined space conditions and reduce atmospheric pressure. Escalating pressures should expel entering air, but premature AVV closure can hinder this. Air enters through cracks and damaged tubes in negative-pressure areas. Downstream check towers, siphons, and pipe bends capture air [12]. Subgraph (a) of Figure 5 shows how jets congregate in the pump basin to let air in. Denny and Young [13] explained that a spinning free surface can allow it to enter pump inlets. In subgraph (b) of Figure 5, diving jets allow air to enter chambers and drop shafts. The air entrainment ratio is determined by various factors including the length, velocity, nozzle design, diameter, slope, and physical qualities of the liquid being used. Yang et al. [14] hypothesized that the creation of air bubbles occurs when a combination of water and air enters a horizontal pipeline, causing the trapped air to rise and adhere to the upper part of the pipeline.
Air rises and adheres to the top of a horizontal conduit when a water-air combination enters. Air pockets form when air bubbles congregate. Geysers form when water flows down a canal under varied hydraulic conditions. The condition that must be met is the preservation of air within the flowing water in the channel. The slope of a straight conduit with a homogeneous cross-section and surrounding pressure and flow velocity affect air pocket movement [11, 15, 16]. Due to increased flow discharge, pockets shift closer to the downstream end and are pushed out into the tailwater. They show backlash by moving against the current.
Vasconcelos and Wright [17] mentioned that air pockets can be created at placements such as drop shafts and air vents where the air outlet can be closed using water over the conduit crown, and air pockets can be developed. Pothof and Clemens [18] stated that air–water flow is an unfavorable case in several systems for the transition of fluid that results in air pockets, in which air in tunnels may get entrapped and form air pockets that can negatively impact the system.
A possible explanation for the production of air pockets in closed sewers, which is not necessarily connected to fast-filling circumstances, is the result of air being trapped in the flow produced by the sudden drop in drop shafts, as explained by Chanson [19]. Even small air bubbles in falling water might be transferred downstream by sewage flow. These bubbles will cluster at the top of filled sewer pipes and produce air pockets [17].
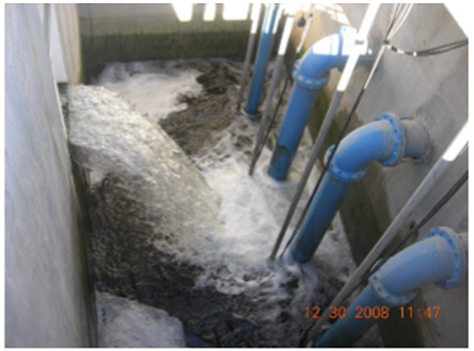
Multiple endeavors and scholarly investigations have been undertaken to assess the detrimental effects arising from the movement of water and air, as well as the creation of air bubbles, in drop shaft spillways, pipelines, and Morning Glory spillways. The presence of air in water conduits or circular spillways might result in detrimental effects on these important transportation systems. Air can be present in water pipelines or spillways in the form of microscopic air bubbles, which can create significant air pockets. The air bubbles have the ability to accumulate and form air pockets of considerable size. Yang et al. [14] indicated that the formation of air bubbles leading to the creation of air pockets can cause either air blowouts or blowbacks. This phenomenon occurs in pipes that are exposed to dynamic hydraulic conditions. The displacement of pockets in the flow direction leads to the positioning of the pockets at the downstream end and their expulsion in the downstream direction. Blowback refers to the phenomenon where pockets of air flow in a direction opposite to the river, causing them to blow out upstream. Figure 6 illustrates the stages of air blow-out in tailwater as a result of the movement of air pockets in a conduit formed from air bubbles.
Figure 6. Air blowouts in the downstream [14]
Additionally, Lauchlan et al. [11] compiled and analyzed the body of information and experience on air quality issues in pipelines. The following are the findings of this literature review: The movement of air pockets or bubbles in pipelines is not well-understood, and the many prediction algorithms differ greatly from one another. The presence of air in a hydraulic system leads to disruptions in the flow, manifesting as blow-outs or blow-backs. Air entrainment in a hydraulic jump causes the prevention of downstream movement and results in blowback through the hydraulic leap [11]. The development of air bubbles in hydraulic structures was the subject of this study; however, the corrective measures to handle blowout or blowback occurrences were not included.
Ramezani et al. [20] reviewed the literature on air in wastewater and water systems, as well as the related effects. They also offered a critical assessment of two air-management techniques. The gaps in the literature that keep management ideas from gaining broader traction and success are examined along with advancements in the field.
Air pocket effects fall into two categories: transient and steady-state. More data is currently available for the latter. Peak pressures caused by trapped air pockets or air escaping from pipes under transient circumstances, as well as pressure oscillation patterns, are of significance. The majority of research focuses on air release into air media, but rarely does it examine air release into water. Therefore, more research is required to examine important factors influencing the harmful effects of air leakage into water and to suggest countermeasures, whether they be in the form of operation procedures or design stages. Few studies have been conducted under steady-state settings to investigate the capacity reduction resulting from entrapped air in wastewater systems running at low pressures. Still, little is known about how air pockets can condense at high places in pipelines, where they are most vulnerable, and lower pipe capacity in pressured water mains. Also, the study found that air pockets, formed by air bubbles during water transmission pipe mobilization or spillway surcharging, could cause transient-induced pressure damage. Trapped air pockets discharge high pressures without warning. High pressure, caused by compressed air pockets being released through the neighboring air vent during transitory situations, causes significant damage. Increased demand usually harms infrastructure. Several studies have shown that air in water conduits can affect system dynamics.
Stephenson [21] discussed the effects of air pockets on water hammer and surge. The risk of water hammer is decreased by emphasizing the significance of piping configuration. Local effects may be disregarded because the study, which is based on a review of theoretical studies, often uses analytical methods to determine water hammer that are based on the entire pipeline. Concerning the pipe itself, these consist of:
Water hammer can occur when air release valves in pipelines are quickly closed under pressure. A standpipe installed with an air valve to reduce shock can be used to dampen this. A design graph serves as an example of the significance of standpipe diameter. Here are some more issues brought on by air in the pipe:
Air is always present in water pipelines, either as a solution or as bubbles. The percentage of air by volume can be as high as 2%, even though it is dependent on pressure. There are issues with air in pipes in the following areas:
Without any real-world or experimental applications to precisely identify the issues that air pockets subject water conduits to, this work was based only on theoretical research. Further research is therefore required to validate these adverse effects and identify the variables that either raise or lower the likelihood of the impact of air pockets.
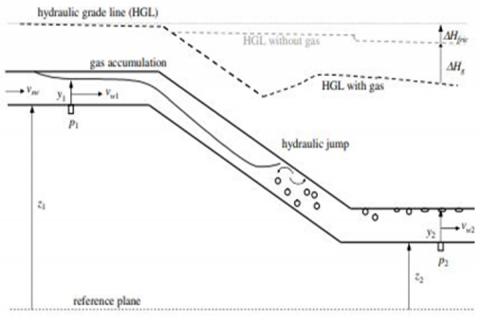
Escarameia [22] affirmed that water pressure loss, called head loss, exposed to air pockets is 25% to 35% higher than in identical tubes free of air. In addition, hydraulic jumps that occur in submergence conditions at the air pocket end can either result in head loss or aid in the removal of air. This phenomenon is influenced by various factors, including the decrease in liquid pressure associated with an air pocket, which can be quantified as Lg sin θ. Here, Lg represents the length of the air pocket, and θ denotes the angle of the conduit with respect to the horizontal axis [23]. Moreover, as mentioned by Pothof et al. [24], who carried out a methodical study of surface tension's impact on air discharge in downward-sloping pipe sections. At the WWTP Nieuwe Waterweg in Hoek van Holland, a sizable experimental facility was built so that, in addition to clean water experiments, co-current air-water flow studies could be conducted with raw wastewater and water that had surfactant added. Figure 7 displays a schematic layout.
Figure 7. Definition sketch with upstream pressure transducer in horizontal section [24]
The facility consists of a rising pipe, a horizontal part that is upstream and has a length-diameter ratio of Lu/D>10, a miter bend that leads into a segment that slopes downhill, another miter bend that leads to a section that is downstream, and either rising or horizontal pipe work that leads back to the reservoir or the WWTP. Nothing that is injected into the system may escape upstream thanks to this layout. Transparent PVC was used as the pipe material for the downward-sloping segment and the two horizontal pieces. The transparent parts have an internal diameter of D=0.192 m. The part that slopes downward is L = 40.1 m long L/D = 209. For inverted siphons built using the horizontal directional drilling technique, the pipe angle is typically θ= 10°. The clean water and surfactant-containing clean water experiments in Series 1 and 2 were conducted by recirculating the water via a separation tank. The presedimentation tank was filled with water extracted from the inflow culvert as part of Experimental Series 3 (wastewater). The water's temperature T and the pressure at the site of the upstream total pressure transducer were used to adjust the mass flow rate to a predetermined volumetric flow rate Qa. In the riser pipe upstream of the horizontal segment, the upstream absolute pressure, or p1, was measured. A minimum of 6D downstream of the miter bend, in the downstream horizontal portion, was where the downstream pressure tapping was situated. An electromagnetic flow meter (EMF) installed in an air-free upstream pipe segment was used to measure the water flow rate Qw. The water flow rate was regulated by a valve that controls flow to a predetermined level. The air and water output as well as the gas pocket head reduction were nondimensionalized in order to contrast the concurrent air-water flow findings with those at different pipe angles and diameters. The ratio of the gas pocket head loss to the elevation variation of the downward sloping stretch L sin θ is a useful way to express the nondimensional gas pocket head loss:
$R=\frac{\Delta H_g}{L \operatorname{SIN} \theta}$
A Froude-scaling was discovered through an analysis of dimensions of the momentum balance, taking into account buoyancy and drag, on elongated bubbles in pipes that slope downward or are inclined. The flow number, or pipe Froude number, is another name for this dimensionless number FX:
$F_X=\frac{Q_X}{A \sqrt{g \cdot D}}$
where, subscript X = gas (g) or liquid/water (w) phase; QX = phase discharge; A = pipe cross-sectional area; D = pipe diameter; g = gravitational acceleration; ρw= water density; and ρg = gas density.
The head loss caused by an air pocket has a reciprocal relationship with the inflow number and Weber number of the pipe, and a direct link with surface tension. It has been shown that the net air discharge by flowing water in a downward sloping reach increases as the surface tension is reduced. Air being entrained in the hydraulic leap and bubble movement downstream following the hydraulic jump are the two physical processes influencing the net air discharge. A definitive conclusion on the impact of surface tension on the entrainment of air into a jump in hydraulic pressure cannot be reached because the conducted studies are unable to distinguish between the two physical processes. Further investigation is advised to fully understand how turbulence affects dynamic surface tension. According to Aghebatie and Hosseini [25], in Morning Glory spillways, for instance, tunnels with slopes can impact the exiting of air bubbles in the structure. Although this procedure contributes to the protection from failure or the constitution of low pressures inside the fluid that flows, it can result in the slug flow phenomenon and its potential attendant destructive detriment. Also, Aghebatie and Hosseini [26] affirmed that Morning Glory spillways were studied in steady state conditions but the studies during flood conditions, by augmenting the depth above the crest of the spillway, the discharge increased to result in air pockets and air bubbles entrapping with disturbances in pressure and velocity. These disturbances affect structure efficiency and serviceability. Falvey [27] found that air blowbacks might blow down the Morning Glory spillway of the Owyhee Dam in the US. The pipe's incoming flow and water levels affect air entrainment. Air bubbles inside the pipe migrate in the opposite direction of the incoming flow and forcefully leave the intake under certain hydraulic conditions, especially as the input discharge decreases. The lower ventilation system of the Berg River Dam in South Africa was evaluated by Bosman et al. [28] for reverse flow. The water flow is regulated by a bulkhead emergency gate at the entering point and a radial gate at the exit point. An air vent is strategically positioned downstream of the emergency gate in the pipeline to optimize airflow and mitigate the negative pressures that arise during gate operation. A significant quantity of air bubbles is ejected from the exit and subsequently burst. According to their investigation, the expulsion of air bubbles is caused by the small size of the radial gate, which results in a sudden release of high-pressure water when the emergency gate is closed. At the emergency gate, the phenomena of air blowback were noticed within a specific gate opening range of 25% to 37%. This phenomenon can be explained by the restriction at the output conduit's downstream end. It was discovered that the radial gate chamber, which is located at the downstream end of the outlet conduit, is where the flow constriction that results from a decrease in the conduit's cross-sectional area causes the blowback phenomena.
Against the intended intent, large volumes of air are pushed out of the vent after being forced into it. The research indicates that a notable reduction in the area of cross-section at the radial gate is responsible for the formation of an air blowout. Upon closing the emergency gate, this reduction causes a pressured flow within the conduit.
Bhatia [15] analyzes real-life situations and assesses the fundamental components that cause air blowouts. Explosions can occur as a result of inadequate design when air accumulates at the inlets. Explosions can induce elevated pressure and induce instability in motion.
7.1 Slug flow caused by air bubbles
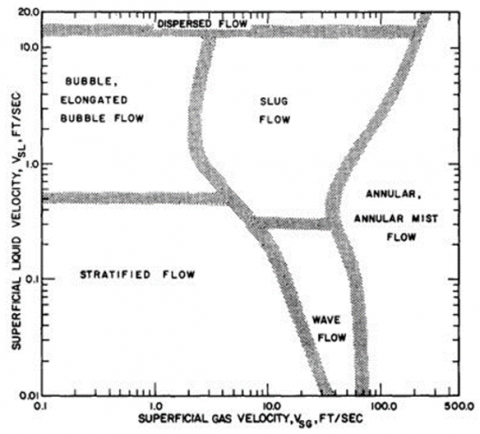
The occurrence of slug flow, characterized by the formation of air bubbles, is widely regarded as a detrimental phenomenon. Multiple studies have been conducted to forecast its happening and devise strategies to alleviate its adverse consequences. Slug flow refers to a fluid input system that is distinguished by the existence of liquid slugs alternating with sizable air bubbles. The formation and entrapment of these air bubbles occur during the slug input event, resulting in flow pauses and disturbances in pressure and velocity. Mandhane et al. [29] identified five distinct inflow types for slug flow: stratified, wavy, plug, slug, and bubbly conduit. The UC Multiphase Pipes Flowing Data Bank contains 5,935 flow pattern observations that are checked against the various flow pattern maps shown in Figure 8 for two-phase gas-liquid flow in horizontal pipes.
Figure 8. Suggested flow pattern map [29]
It is demonstrated that the novel flow regime correlation, which builds upon the research conducted by Aziz and Gorier [30], agrees with the data more closely than the remaining correlations that were examined. Included is a FORTRAN application for this correlation.
It's also noteworthy that not a single one of these maps was able to accurately predict the regime of distributed bubble movement. Actually, there is some evidence to suggest that the data—at least the flow pattern observation—may not be entirely accurate. Plotting all 5,935 points on VSG, VSL coordinates reveals that a significant portion of the observations dubbed "dispersed bubble" are located in the area with high gas rates and low liquid rates.
In a study conducted by Ansari and Arzandi [31], the researchers examined the effects of ribs on the flow characteristics in slug flow under atmospheric pressure. They experimented on the adiabatic two-phase air-water flow in horizontal, ribbed, smooth ducts shown in Figure 9.
Figure 9. Experimental work [31]
This study made a valuable addition to the understanding of how ribs affect the slug flow regime in conduits. Nevertheless, further research is required to ensure the validity of the experimental model. Additionally, more research can look into the impact of ribs at depths greater than 4 meters.
The impact of viscosity on the stratified-to-slug transitions in horizontal conduits between 2.5 cm and 9.5 cm diameters was investigated by Andritsos et al. [32]. With glycerine-water solutions with viscosities of 1, 20, and 100 cP, transitions were seen. At the inlet, the two phases were mixed using a straightforward T-junction entry. The liquid and gas were delivered into the 9.53 cm pipe at two distinct points.
Two parallel-wire conductance sensors that extended vertically throughout the whole pipe cross-section were used to determine the depth of the liquid layer running down the pipe's bottom, or hL, in one test section. The time average of the readings from the conductance probes was used to represent the liquid height in studies involving small-wavelength waves. In a second test segment, the liquid height fluctuation along the pipe circumference was measured using pairs of short parallel 0.51 mm chromel wires spaced 45 degrees apart. The two sections have been divided by 10.2 cm in the 2.52 cm pipe and 26.7 cm in the 9.53 cm pipe. The viscosity increases but does not affect the air-water flow. According to experimental findings, there is a stabilization in this kind of plot when liquid viscosity increases when it comes to the commencement of slugs.
There are certain limitations to the study that warrant further investigation. The mechanism investigated by Lin and Hanratty [33] appears to be supported at first glance by the observed influence of liquid viscosity and the close match of the experimental findings for air-water with the prediction. A more thorough analysis of the data using extremely viscous liquids, however, revealed that the influence of pipe diameter differed from what was anticipated.
Unknown nonlinear processes are responsible for the large-wavelength disturbances' emergence from the normal wave train. The mechanism underlying the initiation of slugs in liquids with viscosities similar to water is difficult to observe because, under a wide range of flow conditions, waves (caused by variations in gas-phase pressure in phase with the wave slope) cover the interface of the stratified flow before slugs appear. This study provided information about the impact of viscosity on slug flow; more research is needed to lessen the influence of viscosity on the slug-flow regime.
Matsubara et al. [34] explored air-water flow systems in a micro-channel to establish their boundaries. The water phase had speeds from 0.033 to 4.94 m/s, whereas the air phase had speeds from 0.025 to 66.3 m/s. Previous conduit inflow research focused only on inflow technique and narrow pipe pressure distribution. In their study, Aghebatie and Hosseini [25] conducted a computational analysis of the slug flux phenomenon across a range of ratios of air intake speed to water intake velocity, spanning from 1.1 to 34. This work uses CFD techniques to numerically explore two-phase flows using the InterFoam solver in OpenFOAM, an open-source software. The majority of earlier troubling research on slug flow was conducted in tiny microchannels where the air bubbles' expansion was barely noticeable. On the other hand, this study looked into systems that experience significant pressure decreases and thus have sudden increases in air phase volume. A culvert's intake could be used to induce the slug flow phenomenon by entering water and air at different speeds, with the air to water velocity ratio ranging from 1.1 to 34. First, the temporal and spatial fluctuations of velocity and pressure along the culvert were the main focus of this investigation. The non-dimensional characteristics impacting the slug flow phenomenon are then isolated and examined using dimensional analysis. The position and form of ribs are among the various tactics for lessening the damaging effects of slug flow that are assessed. Using the InterFoam model, the velocity and pressure fields in a slug flow along a conduit are examined. The flow pattern and turbulence effects are modeled using a two-phase approach with the SST turbulence and InterFoam solver model. The Volume of Fluid (VOF) model is used to monitor the air-water interface. The more practical turbulence and mesh size model are chosen by means of verification testing. Analysis is done on the pressure and velocity fields as well as the presence of slug flow. In a conveyance system, strategies to stop the slug flow and lessen its damaging consequences are examined by using the ribs, their shapes, and their positions. The researchers verified the influence of the ribs on the slug incident. The assessment of slug flow damage mitigation strategies is conducted by evaluating pressures, velocity, and disturbances. According to the study, ribs decrease pipe pressure and velocity by a factor of 4 to 6 for Vair/Vwater values less than 10. The presence of stepped ribs in the stream bed effectively decreased the population of slugs. This research may reduce the incidence of slug-flow in horizontal conduits. To study the rib efficiency in these structures, it is advantageous to use these techniques in hydraulic structures that have more intricate shapes than conduits like spillway structures.
Experimental data are presented by Gualtieri and Chanson [35] from measurements made in a rectangular horizontal flume with slightly developed inflow conditions, as shown in Figure 10.
Figure 10. Test setup [35]
For inflow Froude number Fr1, the vertical ranges of the void fraction and the air bubble count rate were noted in the range of 5.2 to 14.3. Near the jump toe, a rapid detrainment phase was seen, but over longer distances, the air diffusion layer's structure was clearly visible.
These fresh data were contrasted with older data, which were often gathered at lower Froude values. The comparison showed that the greatest void percent Cmax grows with the raising Fr1 at a specified distance from the leap toe. The highest possible void fraction and bubble count rate's vertical placements matched those of earlier research. The researchers discovered air bubble proportions that were at their maximum, which aligned with findings from earlier studies. Furthermore, the higher boundary of the air dispersion layer increases linearly from the leap's start.
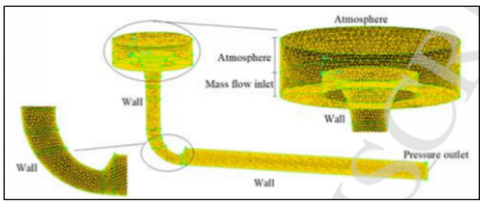
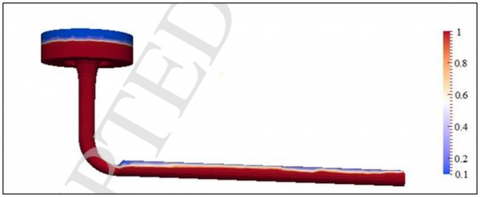
The research spillway and drop shaft slug flow has concentrated on pipe sections, steady-state circumstances, and 2D numerical simulations. Prior studies ignored the effect of inflow mode on spillway slug flow velocity. Previous studies ignored spillway slug flow management. Aghebatie and Hosseini [26] studied Alborz morning glory slug inflow using 3D numerical simulation. Slug flow was reduced in tunnels with different slopes and diameters using various methods. These approaches are evaluated by measuring spillway flow hydrodynamic parameters including pressure and velocity. Aghebatie and Hosseini [26] studied tunnel slug generation, growth, and hydraulic parameter changes. Open FOAM was used to simulate the Albornz spillway in 3D. Figure 11 shows the Alborz dam spillway numerically.
Figure 11. Alborntz Glory spillway 3D numerical simulation [26]
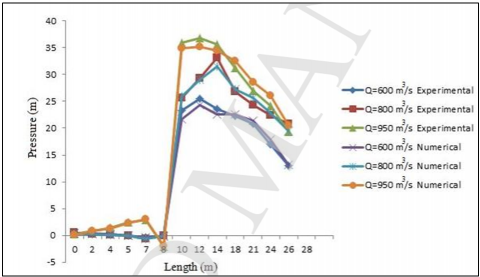
Multiple discharges were simulated numerically. Both modes show symmetry as the inflow ascends to the peak and then lowers into a vertical column. The flow is then accelerated along the column, effectively trapping air bubbles within the liquid. The experimental and numerical discharges were compared in the reservoir for six different water levels. The distribution of pressure along the x-axis was analyzed and depicted in Figure 12 for three discharges in the numerical model. There was a strong agreement between the two methods, as shown in Figure 12.
Figure 12. Investigation of the numerical model [26]
The text refers to a study conducted by Aghebatie and Hosseini [26], which examines Figure 12 of a numerical model.
The presence of many influx zones within the tunnel is determined by elements such as the movement of air, the speed of air and water flow, and the shape of the tunnel. Small discharges in the tunnel create a fluctuating water surface, with the height of the waves increasing in proportion to the discharge rate. When water waves encounter the apex of a tunnel at specific flow rates, their velocity decreases, resulting in disturbances and vibrations throughout the tunnel, perhaps leading to incidents of obstruction. Choking results in a decrease in the tunnel's ability to release fluid, causing the control section to change from a crest to an orifice. During the process of water transitioning from a wavy surface to being filled, many air masses become trapped and form within the tunnel, resulting in pressure disturbances. Figure 13 illustrates a pipe that is blocked at the vent hole and is currently undergoing slug flow mode. This mode is distinguished by a series of liquid slugs alternating with sizable air bubbles. The presence of this unfavorable flow system causes disturbances in both pressure and velocity within the tunnel, leading to increased strain on the tunnel or conduit. Additionally, the liquid creates tiny bubbles that mix to form a tube-wide layer. Curvature angle, diameter, slope, and water discharge affect tunnel slug flow. Aghebatie and Hosseini [26] used several methods to prevent slug flow and promote air evacuation, improving the Morning Glory spillway's efficiency.
Figure 13. Slug flow constitution in slope tunnel [26]
Aghebatie and Hosseini [26] showed that the performance of the Morning Glory spillway can be improved when the diameter of the tunnel is larger than the height of the water above the crest. Also, this study was discussed extensively as a result of its significance in addressing slug flow incidents using the developed 3D CFD technique, which is considered the most advanced model to study any complex problem in general and two-phase flow in drop shafts specifically, comparing to limitations in other methods to address issues related to slug flow incidents. This study could simulate accurately the slug flow incident in Morning Glory spillways. Moreover, this study could address several parameters and their impact on slug flow, and due to its significance, more efforts should be adopted this technique in this field to address more extensive parameters.
7.2 Air management strategies
Previous studies have mentioned various measures to manage air in conduits and spillways for the mitigation of air bubble formation to prevent the detrimental effects of air bubbles that are formed in the Morning Glory spillway due to air entrainment at the intakes of conduits during mobilization. In general, the strategies of air management are classified as follows: air banning, taking into account hydraulically eliminating air bubbles from spillways, and applying of air-emission tools, like air valves or air vents.
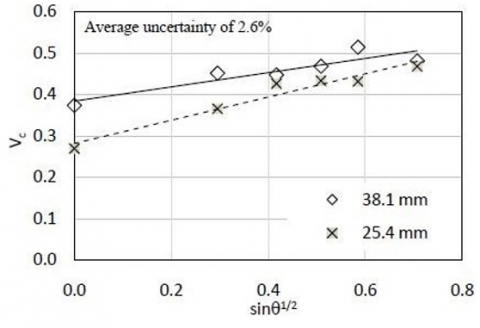
In order to investigate the hydraulic characteristics of air in pipes with small diameters—25.4 mm and 38.1 mm—May et al. [36] carried out laboratory studies. The objective of the study was to examine the relationship between the essential velocity and pipe's slope and diameter, as well as the relationship between the velocity of the air pocket and the head loss it causes. Notable conclusions from this inquiry were as follows:
Although critical velocity is usually represented by the dimensionless critical Froude's number, this confuses the relationship between velocity and diameter. It was discovered that a bigger-diameter pipe requires a larger clearance velocity when critical velocity is applied (Figure 14).
Figure 14. Critical velocity versus conduit inclination [36]
Physically speaking, this makes sense if one assumes that, even with the length held constant, the larger tube would possess a higher volume air pocket. Since the buoyant force in the bigger diameter pipe could be higher than in the smaller pipe in this scenario, moving the pocket would need a higher inertial drag force and, thus, a higher velocity.
As shown in Figure 14, tests conducted in the 38.1 mm diameter pipe across air pocket lengths of 38, 152, and 279 cm reveal that the critical number for Froude was constant with pocket length. This conclusion is unexpected at first because a larger air pocket capacity would be expected to have a larger buoyant force, requiring a larger inertial drag force for moving the pocket. Often, at critical velocity, a pocket of air wouldn't necessarily pass through the structure intact but would instead gradually break into distinct fragments that would then proceed downstream. This theory is supported by data. This would continue until every pocket was removed, often in a short amount of time.
The link between critical velocity and pipe diameter is not indicated in any of the other investigations. Based on two sizes, the study's findings indicate that the bigger diameter pipe needs a higher clearing velocity, as shown in Figure 14. Additional confirmation of this conclusion across a larger range of sizes is required. Without a doubt, surface tension—which this study did not take into account—will become more significant as the diameter drops and eventually take control.
It is arguable that head loss from air in pipes significantly affects a system's hydraulic integrity. This head loss reduces the energy available to drive flow when air builds up, leading to subpar performance or total blockage. The general hypothesis that the vertical height of the pocket can be used to approximate air pocket head loss was validated by laboratory tests.
Less than 10 percent of the mean flow velocity was discovered to be the velocity of an air pocket traveling downstream in the direction of the flow. The inertial drag force is the main force driving the pocket, while buoyancy and friction act as barriers. Because of the increased buoyant force, the pocket velocity falls as pipe slope increases.
The critical velocity for a pipe with a diameter of 25.4 mm and 38.1 mm differs measurably, however, the diameter has no bearing on the speed of an air pocket.
Automated air release valve installation at pipeline's crucial locations is a popular and usually efficient way to remove air through a system. Placing air release valves has several drawbacks, including increased initial and ongoing operating costs, which can be substantial for emerging nations' communities, system complexity, and the need for sporadic maintenance. The fact that such valves are usually unavailable, even in big cities, as well as rural ones, is another issue.
The constitution of the air vortex considers important hydraulic problems that occur at the water conduit inlet which leads to the constitution of air vortex. If there is insufficient submergence at the entrance, such as in the event of a vortex, there is a possibility of a significant amount of air entering the pipes. The crucial submergence must be established at the exact moment that air entrapment begins to avoid inlet entrapment. The critical ratio is affected by the intake pipe diameter, water velocity in the inlet and conduit, and input basin bottom permeability [37, 38].
The phenomenon of air bubble transmission in channels with a downward slope is regarded as an intricate issue. Air bubbles will ascend when the buoyant force surpasses the gravitational force acting in the opposite direction. However, if dominance was established through the application of a pulling force, it may be deduced that pockets of air would be transported in the same direction as the flow [27, 39, 40]. Nevertheless, the complex array of issues related to two-phase flow has restricted the majority of theoretical inquiries on this topic. Therefore, most studies investigating the movement of air bubbles in water quality rely on experimental analyses. Wisner et al. [41] identified two possible techniques for eliminating air bubbles from spillways: sweeping, which entails achieving a critical water velocity to completely remove air bubbles, and generation and drag, which involves utilizing a hydraulic jump to displace the air and eliminate large air bubbles at the end.
Multiple studies have primarily concentrated on conducting experimental experiments to investigate air elimination. These investigations have emphasized the crucial task of determining the optimal flow velocity needed to eliminate air from spills. Extensive research has been conducted on the process by which air pockets transition, resulting in the determination of the critical water velocity at which the transition of air pockets occurs downstream. These criteria can identify and fix spillway air entrainment. The critical velocity is correlated with numerous characteristics, including the Froude number, Reynolds number, surface tension, and spillway tilt, according to dimensional analysis. In spillways 175-200 mm or greater, viscosity and surface tension are less noticeable [18, 42]. Further research is needed to demonstrate the influence of surface tension and viscosity in shaft spillways.
Escarameia [22] evaluated the feasibility of hydraulically clearing accumulated air in pipes by conducting experimental studies for the motion of air pockets in a 150 mm pipeline diameter with varying slopes (0 to 1:200). The test results were used to create a prediction equation that calculated the critical velocity needed to eliminate air from a water-carrying conduit. These results supported certain earlier conclusions and added new, crucial information, including: an equation for estimating the critical mean pipe velocity for air pocket movement was calculated from the experiments, demonstrating the dependency of the critical velocity on the air pocket and slope size. In upward slopes, no flow is required to move the air pocket, and no effect of pipe material is anticipated for pipes with a diameter larger than 20 mm. However, in real applications, the possibility of long air pockets being retained at joints should not be discounted. A large air pocket will require a critical velocity of about 0.8 m/s to be expelled; steeper slopes would necessitate greater critical velocities, of the order of 1.2 m/s for a 1:200 slope pipe. Even though the current study was carried out in pipes with diameters of the order of meters, further research is required to address any potential scaling effects of translating laboratory inquiry results to pipes with diameters on the scale of meters.
To expand on Kent's findings, we suggested the following relationship for the clearance flow number, which accounts for slight downward sloping angles less than 15º:
$F_c=\frac{V_c}{\sqrt{g D}}=0.61+0.56 * \sqrt{\sin \theta}$
These results are subject to the same constraints as those listed in Kent's paragraph. Additionally, a definition for the air-water discharge proportion was derived [22], and it was confirmed at pipe angles up to θ = 16.7º.
$\frac{Q_g}{Q_w}=\frac{F_g}{F_w}=0.0025\left(F_{r 1}-1\right)^{1.8}$
Escarameia [22] took into consideration uncertainties associated with air entrainment in conduits and incorporated a safety factor into these equations. However, Escarameia [22] identified differences in the curves indicated by several research studies, such as whether the curves were convex or concave. Multiple studies have performed experiments in a channel with a consistent diameter and steep inclinations. Nevertheless, they have offered a diverse array of applications for their equations that establish a connection between the crucial velocity of flow and the pipe's diameter, inclination, and gravity.
Nevertheless, the trustworthiness of D remains uncertain because there is not enough empirical evidence to support it. Moreover, the establishment of these databases and standards is derived from studies that especially concentrate on particular cases. To fully comprehend the greater range of applications, it is important to have a thorough grasp of airflow, which includes taking into account the impacts of different scales.
An equation developed by Escarameia [22] can be employed to compute the volumes of air bubbles within the specified range of n (0.0002 to 2). Escarameia [22] also examines flow systems that transition from bubble flow to plug flow with low airflow rates. However, it has been observed that lower air-flow values lead to lower cleaning flow values [18]. Therefore, it is essential to take into account these scale effects in order to effectively extrapolate experimental findings.
7.3 Hydraulic jump technique
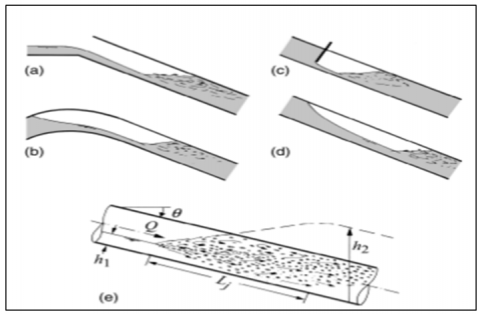
The procedure of air entrainment using hydraulic jumps entails the technique of removing air bubbles from spillways with a downward inclination. This suggests that the hydraulic jump approach induces the fragmentation of substantial air pockets into smaller air bubbles, resulting in the phenomenon of air entrainment. If the flow velocity exceeds the critical velocity for air bubble removal, these tiny bubbles will be transferred downstream. Multiple empirical studies have examined hydraulic jumps in restricted pipes caused by an abrupt bottom slope change after a gradual transition. Figure 15 shows these phenomena at siphons, after a control gate, and in the presence of an air pocket contained at a higher elevation or down a downward slope during pressurized inflow. Furthermore, a hydraulic jump occurs when there is a transition from supercritical flow to subcritical flow. This hydraulic phenomenon causes significant local disturbance, resulting in the dissipation of energy and air entrainment. The entrapped air bubbles might be carried downstream or moved upstream due to their buoyancy, which depends on the flow's transmission capability.
Figure 15. (a) Change in lower inclination; (b) siphon; (c) sluice gate; (d) air pocket; (e) a profile presents hydraulic jump in an inclines profile with downstream pressurized flow [43]
Inflow conditions at the inlet and exit dictate the hydraulic jump location. Wang and Chanson [44] confirmed that physically replicating hydraulic jumps in well-defined flow conditions is accurate. The researchers measured the hydraulic jump roller void ratio, bubble generation, and interface velocity. Air trapped in the system was also measured. Air transition through hydraulic jumps has been studied in horizontal channels with circular cross-sections [45] and conduits with downward and upward inclined circular cross-sections. An air pocket will maintain its integrity and unchanged form while the water discharge is augmented downstream. However, when air is removed from the system, the air bubble shrinks dramatically in a sloped pipe, raising the hydraulic surge. Nevertheless, the spillway entrance air pocket remains constant [22]. Air bubbles and hydraulic jumps are considered when designing air movement regulations. In order to investigate the behavior of air pockets and bubbles downstream of a hydraulic jump situated at the end of a sizable air pocket, Gonzalez et al. [46] suggested a linear equation. To validate the equation's practical use, both theoretical and experimental research was conducted. The formula was developed using research conducted by researchers who came after Kalinske and Bliss [45] as well as by those who did not. The suggested linear relationship is:
$Q^2 w / g D^5=S$
Undefined water flow level, Qwwater flow rate [m3/s], D pipe diameter [m], g acceleration resulting from gravity [m/s2], and S pipe slope [-] are the terms that make up the expression Q2w /gD5.
In order to analyze the air bubbles and pockets, Q2w /gD5 is compared to the pipeline system's downward-sloping pipe sections. Air bubbles and pockets go downstream through the pipe when Q2w /gD5 is higher than the pipe slope. The air pockets and bubbles will go upstream when it is smaller than S. The air behaved as predicted by the linear equation, which was confirmed by measurements and observations made in an experimental device. The experimental study was conducted using a physical model of 101.6 mm diameter acrylic pipes. It is necessary to look at this equation for other pipe diameters.
Aydin and Ulu [47] conducted an inquiry to analyze the aeration of the flow through the aerator holes located on the hood, in order to prevent damage caused by cavitation in a high-head siphon-shaft spillway. A 3D computational fluid dynamics (CFD) methodology, utilizing the finite-volume method, was utilized to solve the Reynolds-averaged Navier-Stokes (RANS) equations. The work focused on analyzing the flow behavior of incompressible viscous and turbulent fluids in full-scale two-phase numerical models. The Volume of Fluid (VOF) approach was employed to model the motion of two phases (water and air) by allocating a volume fraction to each fluid across the whole solution domain. A thorough investigation was performed using reliable CFD models to assess the efficiency of the aerators that were mounted on the siphon hood. These aerators aim to decrease the sub-pressure within the siphon shaft and minimize the occurrence of cavitation. Three distinct aeration diameters were taken into account for three separate working heads. The analysis results indicate that as the pressure in the siphon with the water level lowers, the air entrainment rate increases, while the discharge performance experiences a minor decline. Given that siphon pressures diminish when water levels are low (operating heads), the likelihood of cavitation also increases. In this context, an elevation in air entrainment will effectively mitigate the risk of cavitation. Furthermore, it has been noted that the size of the aeration diameters has a substantial impact on the process of air entrainment, even when the water level remains constant. Excess air entering the siphon can interrupt the flow. Therefore, selecting the right aeration diameter is critical. This study also showed that well-formulated numerical models simplify hydraulic structure design.
The study conducted by Li et al. [48] investigated the flow patterns and air requirements of a hydraulic jump in a closed pipe with different depths of the submerged outlet. Previous research utilized the measurement of outlet depth to establish flow patterns including submerged exits. The experiment utilized a horizontal Perspex pipe measuring 2 meters in length and 0.20 meters in diameter (D). It also involved a control gate with a variable opening (a) and a water tank located downstream of the pipe. The water tank was equipped with an adjustable gate to vary the depth of discharge.
To evaluate air needs, Liu et al. [49] observed bubble motion and size distribution. As shown in the photo, the bubble was ellipsoidal, with the major axis horizontal and the minor vertical. A horizontal third axis perpendicular to the image plane was identical to the primary axis. Liu et al. [49] assumed this because the horizontal axes differed by less than 10%. The study found that free-surface flow without a hydraulic jump has a greater estimated relative air demand (β) than other flow regimes. The Froude number, denoted as F0, has an impact on the relative air demand and hydraulic jumps in free-surface flow at the vena contracta. A hydraulic leap occurs when a pressurized pipe undergoes a shift from high-velocity flow to low-velocity flow. This transition has the potential to produce either an immature or mature surface wave. The air demand, relative to the surrounding air, varies between 3% and 14% and decreases as the length of the roller increases until it achieves its maximum capacity within the pipe. In the scenario of a hydraulic leap where only a part of it is submerged, the amount of air required is significantly reduced to less than 1%. The air demand was measured in a prototype low-level outflow at the Hugh Keenleyside (HLK) Dam in British Columbia, Canada. The outlet showcased a half-submerged hydraulic jump. The observed air demand corresponded to the prediction equation established from experimental observations. Furthermore, several nozzle diameters were tested on the upper part of the air vent to assess the influence of air delivery on the hydraulic jump. The air supply was restricted, resulting in a decrease in pressure below atmospheric levels. The sealing of the air vent led to a substantial increase in the magnitude of this sub-atmospheric pressure. The hydraulic jump moved in the opposite direction of the flow as the air demand decreased, caused by the lower air pressure within the enclosed conduit. The study revealed a negative association between air supplementation and complications in the test. Thus, this investigation necessitates the validation of the obtained outcomes.
7.4 Mitigation strategies blowback event
The blowback action of the bottom overflow of the Berg River Dam in South Africa was studied using numerical and physical model studies by Bosman et al. [28]. Behind the emergency gate, in the conduit, is an air vent. On June 12, 2008, blowback observations were recorded during the emergency gate's commissioning test shutdown. A possible option is to use numerical simulation techniques (RNG $k-\varepsilon$ & VOF) to address the problem of excessive airflow. A 1:14.066 scale was used in the construction of the model.
Using a large enough scale is essential when implementing the Froude law in order to reduce the scale effects that result from not adhering to the Weber and Reynolds laws.
Eight distinct points inside the model were used to gather static pressure data throughout the physical model tests. Furthermore, the airshaft's highest point was used to measure both the velocity and direction of the air.
There was a striking similarity between the flow patterns in the physical model and the computational fluid dynamics (CFD) model. It should be mentioned, nevertheless, that the CFD model's discharge rate was discovered to be larger than the physical model's.
When the pressure results from the CFD model were compared to those from the physical model, it was found that the latter had significantly underestimated the amount of energy lost. As a result, the airshaft expulsions seen during the commissioning tests could not be explained by the CFD model. Therefore, in order to accurately investigate and comprehend this phenomenon and discover strategies to reduce it, a deeper analysis of the rebound occurrence using a CFD model is required.
Marks et al. [50] asserted that the primary purpose of the Waller Creek Tunnel Project was to efficiently discharge significant quantities of accumulated air that is produced at the main inflow. Poorly ventilated systems can create explosive situations due to the accumulation of air, which also hinders the tunnel's ability to discharge. Air blowback is a process that can cause explosions when confined air is transformed into sizable air bubbles, resulting in slugs that accumulate substantial air pockets. The geometry of the pipe and/or an uneven hydrodynamic equilibrium prevent these air pockets from escaping unless an unexpected force is applied. As a consequence, an aerial detonation occurs, usually involving the release of pollutants into the atmosphere, which poses risks and causes harm to workers. The Waller Creek Tunnel Project utilized entrapped air management techniques, as outlined in US Department of Interior Engineering Monograph No. 41, to address the issue at hand. These techniques were employed to evaluate the dynamics of two-phase flow and specifically determine the water discharge rate in pipes at which entrapped air begins to flow in a manner that opposes the water flow, leading to blowback. The utilization of a physical hydraulic scale simulation proved advantageous in assessing the intake and designs of tunnel hydraulics, as well as qualitatively evaluating the potential for air entrainment. However, the ability of physical models to accurately measure and evaluate the flow characteristics of trapped air dynamics is limited due to the inability to measure air pockets at the same scale as the model. While EM41 (1980) may not be able to directly measure the magnitude of blowback, it may still be used to measure the airflow at the inlet upstream, which can indicate the formation of air pockets that are a precursor to blowback. In EM41 (1980), the concept of a design foundation is presented as a means to prevent blowback. Additionally, it offers design principles for the safe implementation of air venting systems. Webby [51] proposed a number of measures to effectively reduce blowback accidents. These processes include regular monitoring of the inlet screens and, in the blockage condition, conducting cleaning.
Although these procedures do not provide complete protection against further blowback accidents, they can help mitigate the risks of occurrence. The researcher also recommended introducing more comprehensive protection against blowback accidents, such as the construction of an air trap and vent column directly downstream of the curvature at the bottom of the vertical drop shaft. Improvements to the air trap and vent shaft for the power plant inlet can be supported by a physical hydraulic model.
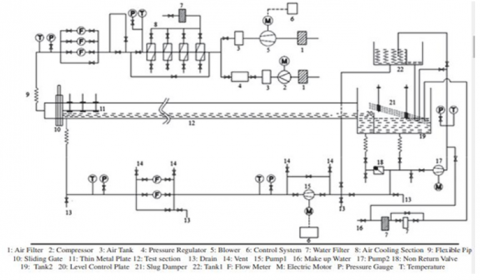
Chan [52] carried out a study comprising several tests on a discharge system, including inflow in a drop shaft. The work is based on introducing an air pocket into the tunnel and measuring its movements in the drop shaft with a high-speed camera and pressure sensors. The heuristic study shows that when the drop shaft inflow exceeds a diameter-dependent threshold, compression stresses increase, causing the air pocket to implode and release air-water flow. Although this study provided an explanation of the air blowback mechanism, further investigation is necessary to identify the factors that either promote or decrease air blowback. Yang et al. [14] used a three-dimensional CFD model to simulate two-phase fluid flow through bottom outlets beneath a Swedish embankment dam. The outlet has a bulkhead gate, a gate shaft, a horizontal conduit, and an exit. This study used prototypes to measure air entrainment and addressed the blowback incidence in the shaft's bottom exit, which provided useful practical solutions. The bottom exit has not been widely used in recent decades, mostly due to safety concerns about the entrainment of air and flow variations. There's even the possibility of floods and scouring downstream roads. An alternating current (AC) motor and a wire rope hoist are used to operate the gate. The hoisting capacity limits how slowly the gate can be operated, often requiring several prolonged pauses.
In autumn 2018, the latest field testing was conducted. At $Z_1 \approx+346.00 \mathrm{~m}$, the reservoir's water level was 3.00 m below the FRWL. The tailwater level, $Z_2 \approx+330.00 \mathrm{~m}$, was submerged, along with the conduit and its outlet. The primary goal was to record and assess air blowouts at the conduit exit as well as flow pulsations in the shaft. The gate hoisting mechanism was tested, and the dynamic water pressures acting on the conduit were also observed.
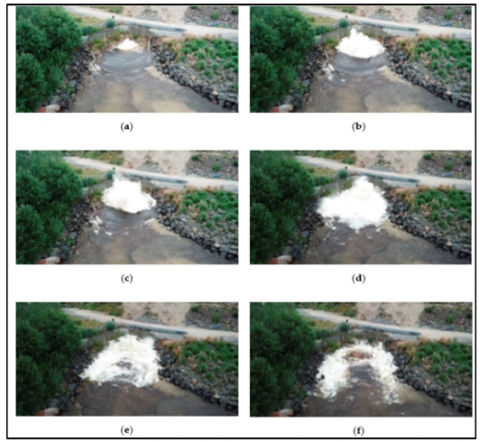
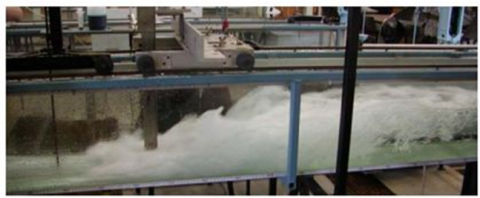
Let Q (m³/s) and ℎ (m) represent the water discharge and gate-opening height, respectively. Initially, the bulkhead gate was opened and maintained at ℎ=0.30 m or approximately 10 m³/s. At the tunnel's exit, there were intermittent blowouts of a distinct mixture of water and air. The blowout events lasted 8–10 s, and the frequency was determined to be T=30–35 s. Its sequence during the blowouts is depicted in Figure 3. Although it was not tested during the tests, the blowout height was thought to reach as high as 4.0–5.0 meters. The event was most likely caused by air that was entrained in the gate shaft and entered the horizontal conduit—which lacked a de-aeration structure—into the space. This was in line with earlier findings for this gate opening.
Subsequently, the gate was opened to ℎ=0.40 m. Q≈14 m³/s was the expected discharge rate. It was noted that this opening caused greater, more pronounced blowout surges and more entrained air to be drawn into the conduit from the shaft. It appeared that the blowouts became nearly continuous and had significantly longer durations at ℎ=0.50 m and Q≈16 m³/s. The subsequent surges that followed became significantly larger, although they occurred less frequently. The gate was then raised to Q≈25 m³/s and h=0.80 m. The blowouts were less frequent below h≈0.30 m. There were no significant blowouts, and the air was discharged almost continuously with a few minor variations. At this point, the field testing was halted. Additional discharges were restricted due to safety concerns over the downstream channel's discharge capacity and gate operation. The study used CFD modeling to overcome the limitation in illustrating the level of air entrainment with geysers at larger gate openings because there were no records available regarding its operation at larger gate openings.
Additionally, the study aims to validate the accuracy of computational fluid dynamics (CFD) modeling in reproducing the hydraulic phenomena observed in real-world tests. It also seeks to identify significant flow scenarios based on gate openings, estimate the volume of trapped air that is challenging to measure using alternative methods, establish a basis for implementing countermeasures and structural adjustments, and serve as a reference for understanding air entrainment in similar outlet configurations. Field observations involve testing multiple consecutive gate openings. The outflow exhibits distinct geysers in the moving water, characterized by a gradually increasing height ranging from 0.30 to 0.50 meters. The air discharge at an opening of 0.80 m remains rather consistent. Simulation focuses on gate openings ranging from less than 1 meter to larger than half of the total opening. The findings indicate that the air within the shaft enters the conduit and, as a result of fragmentation and merging, creates pockets of air that move along the tunnel's ceiling in coordination with the flow, until being released into the tailwater. Apertures smaller than 1 meter can exhibit either periodic blowouts with a regular pattern or a continuous release of air to mimic the movement of air and water. The concordance between field observations and computational simulations of geyser properties, such as their frequency, is substantial. When the apertures are of considerable size, the gate is completely immersed in water, and the discharge occurs without the introduction of any air or the occurrence of blowouts. Further research is required to address the reflux phenomenon, which can be illustrated by the setup of the control of flow channel cross-section and velocity. This study was restricted to examining one parameter, which is the ideal opening height of the gate for minimizing flow.
Yang and Yang [53] examined the malfunctions in deep tunnel discharge systems caused by occurrences that induce the geyser phenomenon. This phenomenon is characterized by the significant impact loads generated when high-pressure entrained air masses are released, leading to potential damage to shafts and spillways. The study utilized an atmospheric scale model to validate the relationship between the occurrence of a geyser and its influencing factors, such as water depth, intake pressure, and intake size. The findings revealed that the disruptions of water and air pressure in a baffle-drop shaft, which lead to the geyser phenomena, are caused either by a high-pressure release of trapped air or by local disturbances in air pressure that result in the swift movement of the combination of air and water.
The definition of a spillway geyser event has been updated by the analysis of recorded occurrences, firsthand observations, and the identification of potential risks. Regression analysis was employed to find a correlation between the greatest height of a geyser and its assessment. The link between explosion strength, water depth, air pressure, and air volume during geyser phenomena was studied to propose a dominant formula for a baffle-drop shaft geyser. Comparing and validating these two models revealed that they can reliably estimate geyser height and occurrence. The data also showed that increasing the barrier's resistance and stiffness at the shaft base prevents baffle structural failure. Yang and Yang [53] found several things, but there are limitations. Specifically, the model test of the geyser was conducted under standard atmospheric pressure conditions, which restricts the ability to accurately replicate the air pressure in real-world scenarios. Furthermore, another limitation is the measurement and assessment of the fluid dynamics of water entrainment in this physical prototype. Therefore, it is crucial to create standard mathematical models and conduct experiments at low atmospheric pressure to study the characteristics of drop shaft geysers. Moreover, considering the impact of regular discharge operation on the hydrodynamic load of the barrier is also necessary. Although this study provides valuable insights into assessing geyser height, it fails to incorporate approaches aimed at minimizing or preventing geyser occurrences. Additionally, it does not establish a connection between evaluating geyser incidents and their causes.
The literature review executed showed extensive knowledge of the consequences resulting from air pockets and air bubbles formed due to air-water flow in hydraulic structures such as conduits, pipes, shafts, and spillways. The review reveals that the most negative consequences caused by the formation of air pockets in hydraulic structures are slug flow, cavitation, head loss, geyser, and blowbacks. These consequences can cause significant damage to hydraulic structures.
Several studies offer beneficial contributions to explain the mechanism of occurrence of blowback incidents in hydraulic structures due to air-water flow [11, 14, 27], but there is a lack of predictive or analytical solutions to evaluate the critical pressure required to cause damage as a result of blowback. There is also a need to address the parameters that have positive or negative effects on blowback phenomena. Several parameters can be investigated, such as conduit cross-sections, vent holes, structure geometry, slope, and the intensity of velocity and fluid flow.
As for the slug flow incident that occurs due to a mixture of slugs and air bubbles, which results in the inability to vent the trapped air in conduits and challenges in separating slugs and air bubbles, consequently, slug flow takes place in conduits and causes damage. Several studies have investigated slug flow and its detrimental effects in conduits, morning glory spillways, and drop shafts. Mandhane et al. [29] executed an analytical study based on academic research and concluded with a flow pattern map to predict the slug flow system, but this solution was not accurate due to incorrect data usage. Also, Andritsos et al. [32] investigated the influence of viscosity on slug flow using experimental tests and revealed that the relationship between slug flow and viscosity is complex and requires further investigation. Despite limitations in the evaluation and prediction of slug flow in hydraulic structures, Aghebatie and Hosseini [26] achieved beneficial knowledge through computational analysis of the slug flux phenomenon across a range of air-to-water intake velocity ratios, studying numerically two-phase flows using CFD techniques. However, the constraints of this study include the use of conduits with small diameters, and it should be applied to structures with more complex geometries, such as various types of spillways.
Aghebatie and Hosseini [26] studied slug generation, growth, and changes in hydraulic parameters in morning glory spillways. This study adopted CFD techniques using a 3D model and could address slug flow formation in morning glory spillways. The evaluation of slug flow was based on dynamic parameters, including pressure and velocity. This study could determine the slug flow location inside the tunnel and explain the mechanism of slug flow generation as follows: the presence of multiple influx zones within the tunnel is determined by factors such as air movement, airflow and water flow speed, and the shape of the tunnel. Small discharges in the tunnel create a fluctuating water surface, with wave heights increasing in proportion to the discharge rate. When water waves encounter the apex of the tunnel at specific flow rates, their speed decreases, resulting in disturbances and vibrations throughout the tunnel, potentially leading to obstruction incidents. Choking results in a decrease in the tunnel's discharge capacity, causing the control section to change from a crest to an orifice. During the transition from a wavy surface to full, many air masses become trapped within the tunnel, resulting in pressure disturbances. This study addressed several parameters and their impact on slug flow, and due to its significance, more effort should be made to adopt this technique to explore more extensive parameters. However, this study focused only on morning glory spillways. Although the evaluation of slug flow generation in morning glory spillways is significant, more efforts should be made to discuss this phenomenon in other hydraulic structures.
Regarding the geyser phenomenon, Yang and Yang [53] utilized an atmospheric scale model to validate the relationship between the occurrence of a geyser and its influencing factors, such as water depth, intake pressure, and intake size. The relationship between explosion strength, water depth, air pressure, and air volume during geyser phenomena was studied to propose a dominant formula for a baffle-drop shaft geyser, and this relation was reliable for estimating geyser height and occurrence. However, Yang and Yang [53] identified limitations in their research. Specifically, the model test of the geyser was conducted under standard atmospheric pressure conditions, which restricts the ability to accurately replicate the air pressure in real-world scenarios. Moreover, another limitation is the measurement and assessment of the fluid dynamics of water entrainment in this physical prototype. Consequently, it is crucial to create standard mathematical models and conduct experiments at low atmospheric pressure to study the characteristics of drop shaft geysers. Additionally, the impact of regular discharge operation on the hydrodynamic load of the barrier should be considered. Although this study provides valuable insights into assessing geyser height, it does not incorporate approaches aimed at minimizing or preventing geyser occurrences, nor does it establish a correlation between evaluating geyser incidents and their causes.
In regard to problems related to head loss, numerous studies have addressed how head loss occurs as a result of air pocket accumulation in hydraulic structures. However, these studies failed to find formulas to assess head loss in these structures. Stephenson [21] illustrated that air in pipes during operation increases head losses without providing any predictions to assess head loss. Escarameia [22] determined that the percentage increase of head loss in pipes is approximately 25% to 35% higher than in identical tubes free of air. Escarameia [22] also revealed that hydraulic jumps that occur in submergence conditions at the air pocket's end can either result in head loss or aid in the removal of air. Although the study addressed several factors affecting the reduction of head loss, such as the length of the air pocket and the angle of the conduit with respect to the horizontal axis, it couldn’t predict head loss accurately or conclude with formulas in this regard. Therefore, more research should be conducted using experimental studies, practical applications, and numerical simulations to address and determine extensive factors affecting head loss accurately.
Pothof et al. [24] erected a large-scale experimental facility at the WWTP Nieuwe Waterweg in Hoek van Holland to perform air-water flow experiments with raw wastewater and with surfactant-added water, in addition to the experiments with clean water. This study offered an actual practical application to evaluate head loss, addressing several conditions in addition to several parameters. The study showed that the head loss caused by an air pocket has a reciprocal relationship with the inflow number and the Weber number of the pipe, and a direct link with surface tension. The outcomes obtained can benefit further investigations into more parameters that can influence head loss caused by air pockets. Also, the study neglected the influence of turbulence on the dynamic surface tension and thereby should be investigated further.
Several studies introduce remedial strategies to mitigate the consequences caused by air pockets. An air vent is strategically positioned downstream of the emergency gate in the pipeline to optimize airflow and mitigate the negative pressures that arise during gate operation. A significant quantity of air bubbles is ejected from the exit and subsequently burst. Bosman et al. [28] introduced a remedial strategy for the lower ventilation system of the Berg River Dam in South Africa. According to their investigation, the expulsion of air bubbles is caused by the small size of the radial gate. However, these strategies should be investigated for other radial gate sizes to measure their efficiency. The comparison between the pressure results obtained from the physical model and those obtained from the Computational Fluid Dynamics (CFD) model revealed a significant underestimation of energy losses by the latter. Therefore, there is a need for more in-depth studies using a CFD model to interpret this phenomenon accurately and find solutions to mitigate blowbacks.
Marks et al. [50] showed that the Waller Creek Tunnel Project utilized entrapped air management techniques. These techniques were employed to evaluate the dynamics of two-phase flow and specifically determine the water discharge rate in pipes at which entrapped air begins to flow in a manner that opposes the water flow, leading to blowback. The utilization of a physical hydraulic scale simulation proved advantageous in assessing the intake and designs of tunnel hydraulics, as well as qualitatively evaluating the potential for air entrainment. However, the ability of physical models to accurately measure and evaluate the flow characteristics of trapped air dynamics is limited due to the inability to measure air pockets at the same scale as the model.
Webby [51] proposed a number of measures to effectively reduce blowback accidents. These measures include:
Although these procedures would not introduce entire protection against further blowback accidents, they would assist in mitigating the risks of occurrence. The researcher also recommended introducing more comprehensive protection against further blowback accidents, such as the build of an air trap and vent column directly downstream of the curvature at the lower of the vertical drop shaft. Air trap and vent shaft for the power plant inlet can be improved by supporting a physical hydraulic model. Although these strategies can be efficient to reduce air blowout, they can result in high costs in addition to being temporary solutions. Yang et al. [14] contributed a beneficial practical solution in a Swedish embankment dam by addressing a blowback incident in the bottom's outlet in the shaft. This study was limited to studying one parameter, which is the optimal height of the gate openings to reduce the flow, and therefore there is a need to conduct other investigations to address the phenomenon of reflux, represented by the introduction of the channel inclination angle, flow control, speed, and channel cross-section. Although these studies provided beneficial contributions to eliminate blowbacks, these strategies require more investigations to guarantee their efficiency. Several strategies used ribs as a remedial solution to mitigate slug flow damage in hydraulic structures. Ansari and Arzandi [31] demonstrated the efficiency of the ribs on the flow characteristics in slug flow under atmospheric pressure in horizontal smooth and ribbed ducts where the study adopted two parameters: rib location and rib height. This study added a beneficial contribution in addressing the effect of ribs to control the slug flow regime in conduits. However, there is a need to investigate the outcomes obtained to ensure the reliability of this experimental model. Also, further studies can investigate the influence of ribs at depths higher than 4m.
Aghebatie and Hosseini [25] investigated different strategies for reducing the destructive effects of slug flow, including the shape and location of ribs. According to the study, ribs decrease pipe pressure and velocity by a factor of 4 to 6 for Vair/Vwater values less than 10. The presence of stepped ribs in the stream bed effectively decreased the population of slugs. This study could decrease slug-flow incidents in horizontal conduits. However, it is beneficial to employ these strategies in hydraulic structures more complex in shape than conduits, such as spillway structures, to investigate the ribs' efficiency in these structures. Aghebatie and Hosseini [26] showed that the performance of the Morning Glory spillway can be improved by mitigating slug flow when the diameter of the tunnel is larger than the height of the water above the crest. Also, this study was discussed extensively as a result of its significance in addressing slug flow incidents using the developed 3D CFD technique, which is considered the most advanced model to study any complex problem in general and two-phase flow in drop shafts specifically, compared to limitations in other methods to address issues related to slug flow incidents.
Cavitation mitigation strategies have also been discussed. Aydin and Ulu [47] used aerator holes located on the hood to prevent damage caused by cavitation in a high-head siphon-shaft spillway. It has been noted that the size of the aeration diameters has a substantial impact on the process of air entrainment. Asadsangabi et al. [54] discussed the optimum inlet shape of morning-glory spillways and investigated the effect of some parameters, including maximum discharge coefficient and minimum possibility of cavitation (cavitation index), and showed that Computational Fluid Dynamics (CFD) is a suitable method to investigate the head versus discharge and cavitation index for various inlet shapes of morning glory in comparison to physical models.
The strategies of air management are classified as follows: air banning, which takes into account hydraulically eliminating air bubbles from spillways, and the application of air-emission tools, like air valves or air vents. The installation of automatic air release valves at critical points in a pipeline is a common, and frequently effective, method for removing air from a system. The downsides to installing air release valves are that they complicate the system, require periodic maintenance, and increase both the initial and ongoing operational costs, which, for a developing community, can be significant. Another problem is that these valves are frequently not available, even in large cities, let alone rural areas. Techniques for eliminating air bubbles from spillways have been mentioned: sweeping, which entails achieving a critical water velocity to completely remove air bubbles, and generation and drag, which involves utilizing a hydraulic jump to displace the air and eliminate large air bubbles at the end. These mechanical strategies should be investigated using experimental studies to achieve optimum air elimination in hydraulic structures.
According to the papers reviewed in the field of air pockets, their consequences, and mitigation strategies, this study found a lack of recent studies in this field, where numerous studies reviewed were prior to 2010, and that indicated the lack of academic research on this significant topic. Although this literature review shows a limitation to ensure the reliability of the findings obtained due to the lack of relationships in the literature review to conduct a comparison between findings, in addition to addressing hydraulic structures in general without concentrating on specific structures.
This paper aims to comprehensively examine all relevant findings pertaining to the process underlying the production of air bubbles and air pockets in spillways and pipelines. This research comprehensively examined all studies pertaining to the adverse outcomes and incidents arising from the occurrence of air pockets in hydraulic systems. Furthermore, it presented the tactics and techniques employed to alleviate or eradicate air pockets and air bubbles. The paper's conclusions can be summarized as follows:
The literature review conducted showed limitations in introducing formulas that can predict the consequences resulting from the formation of air pockets in hydraulic structures. Consequently:
[1] Coleman, H.W., Wei, C.Y., Lindell, J.E. (2004). Hydraulic design of spillways. Hydraulic Design Handbook, 17-41.
[2] Schleiss, A.J., Erpicum, S., Matos, J. (2023). Advances in spillway hydraulics: From theory to practice. Water, 15(12): 2161. https://doi.org/10.3390/w15122161
[3] Mirabi, M.H., Akbari, H., Alembagheri, M. (2021). Detailed vibrational analysis of unbalanced morning glory spillways using coupled finite volume-finite element method. SN Applied Sciences, 3: 88. https://doi.org/10.1007/s42452-020-04006-0
[4] Chitsazan, M., Ghafouri, H.R. (2022). Optimization of anti-vortex blades geometry in morning glory spillways by numerical simulation. https://doi.org/10.21203/rs.3.rs-1685709/v1
[5] Bucur, D.M., Isbăşoiu, E.C. (2008). Air pockets in pipeline systems. UPB Scientific Bulletin, Series D: Mechanical Engineering, 70(4): 35-44. https://www.researchgate.net/publication/25619723.
[6] Volkart, P. (1980). The mechanism of air bubble entrainment in self-aerated flow. International Journal of Multiphase Flow, 6(5): 411-423. https://doi.org/10.1016/0301-9322(80)90003-8
[7] Sato, T., Ota, K., Nakagawa, H. (2022). Numerical investigation of elongated bubble characteristics and pressure fluctuations in horizontal air-water two-phase slug flow. Journal of JSCE, 10(1): 479-486. https://doi.org/10.2208/journalofjsce.10.1_479
[8] Chanson, H., Qiao, G.L. (1994). Air bubble entrainment and gas transfer at hydraulic jumps. Research Report No. CE149, Department of Civil Engineering, University of Queensland, Australia. https://doi.org/10.14264/9043
[9] Zloczower, N. (2010). Reduction of damage and hindrance to wastewater transmission systems caused by air pockets by deployment of air valves. In Pipelines 2010: Climbing New Peaks to Infrastructure Reliability: Renew, Rehab, and Reinvest, pp. 449-462. https://doi.org/10.1061/41138(386)44
[10] Dean, J.A. (1999). Lange’s Handbook of Chemistry. McGraw-Hill, Inc., New York.
[11] Lauchlan, C., Escarameia, M., May, R., Burrows, R., Gahan, C. (2005). Air in pipelines-A literature review. http://eprints.hrwallingford.com/id/eprint/551.
[12] Colgate, D. (1966). Hydraulic model studies of the flow characteristics and air entrainment in the check towers of the main aqueduct, Canadian river project Texas. Report No. Hyd-555, US Department of the Bureau of Reclamation, Denver.
[13] Denny, D.F., Young, G.H.J. (1957). The Prevention of Vortices and Swirl at Intakes. British Hydrodynamics Research Association, London, England.
[14] Yang, J., Teng, P.H., Nan, J.H., Li, S.C., Ansell, A. (2020). Assessment and prediction of air entrainment and geyser formation in a bottom outlet: Field observations and CFD simulation. Fluids, 5(4): 203. https://doi.org/10.3390/fluids5040203
[15] Bhatia, H.C. (1978). Field Experiences, Literature—Review and Probable Theoretical Explanations on Air Explosions from Intakes. Norwegian Institute of Technology (NTH): Trondheim, Norway.
[16] Little, M.J. (2002). Air transport in water and effluent pipelines. In Proceedings of the 2nd International Conference on Marine Waste Water Discharges, Istanbul.
[17] Vasconcelos, J.G., Wright, S.J. (2006). Mechanisms for air pocket entrapment in stormwater storage tunnels. In World Environmental and Water Resource Congress 2006: Examining the Confluence of Environmental and Water Concerns, pp. 1-10. https://doi.org/10.1061/40856(200)9
[18] Pothof, I., Clemens, F. (2010). On elongated air pockets in downward sloping pipes. Journal of Hydraulic Research, 48(4): 499-503. https://doi.org/10.1080/00221686.2010.491651
[19] Chanson, H. (2002). An experimental study of Roman dropshaft hydraulics. Journal of Hydraulic Research, 40(1): 3-12. https://doi.org/10.1080/00221680209499868
[20] Ramezani, L., Karney, B., Malekpour, A. (2016). Encouraging effective air management in water pipelines: A critical review. Journal of Water Resources Planning and Management, 142(12): 04016055. https://doi.org/10.1061/(ASCE)WR.1943-5452.0000695
[21] Stephenson, D. (1997). Effects of air valves and pipework on water hammer pressures. Journal of Transportation Engineering, 123(2): 101-106. https://doi.org/10.1061/(ASCE)0733-947X(1997)123:2(101)
[22] Escarameia, M. (2007). Investigating hydraulic removal of air from water pipelines. Proceedings of the Institution of Civil Engineers-Water Management, 160(1): 25-34. https://doi.org/10.1680/wama.2007.160.1.25
[23] Lubbers, C.L. (2007). On gas pockets in wastewater pressure mains and their effect on hydraulic performance. Ph.D. dissertation. Delft University of Technology, Delft, Netherlands.
[24] Pothof, I.W.M., Schuit, A.D., Clemens, F.H.L.R. (2013). Influence of surface tension on air-water flows. Journal of Hydraulic Engineering, 139(1): 44-50. https://doi.org/10.1061/(ASCE)HY.1943-7900.0000637.
[25] Aghebatie, B., Hosseini, K. (2019). Computational investigation on the effects of rib on the slug flow phenomenon; using OpenFOAM. International Journal of Modern Physics C, 30(06): 1950051. https://doi.org/10.1142/S0129183119500517
[26] Aghebatie, B., Hosseini, K. (2020). Investigation on slug flow phenomenon in Alborz morning glory spillway and preventing its destructive effects. International Journal of Modern Physics C, 31(06): 2050084. https://doi.org/10.1142/S0129183120500849
[27] Falvey, H.T. (1980). Air-water flow in hydraulic structures. NASA STI/Recon Technical Report N, 81: 26429. https://doi.org/10.1007/978-1-62703-595-8_1
[28] Bosman, A., Basson, G.R., Bosman, D.E. (2016). Hydraulic model study of the blowback behavior of the bottom outlet of the Berg River Dam, South Africa. Journal of the South African Institution of Civil Engineering, 58(1): 43-52. http://doi.org/10.17159/2309-8775/2016/v58n1a5
[29] Mandhane, J.M., Gregory, G.A., Aziz, K. (1974). A flow pattern map for gas—liquid flow in horizontal pipe. International Journal of Multiphase Flow, 1(4): 537- 553. https://doi.org/10.1016/0301-9322(74)90006-8
[30] Aziz, K., Govier, G.W. (1972). Pressure drop in wells producing oil and gas. Journal of Canadian Petroleum Technology, 11(03). https://doi.org/10.2118/72-03-04
[31] Ansari, M.R., Arzandi, B. (2012). Two-phase gas–liquid flow regimes for smooth and ribbed rectangular ducts. International Journal of Multiphase Flow, 38(1): 118-125. https://doi.org/10.1016/j.ijmultiphaseflow.2011.08.008
[32] Andritsos, N., Williams, L., Hanratty, T.J. (1989). Effect of liquid viscosity on the stratified-slug transition in horizontal pipe flow. International Journal of Multiphase Flow, 15(6): 877-892. https://doi.org/10.1016/0301-9322(89)90017-7
[33] Lin, P.Y., Hanratty, T.J. (1987). Detection of slug flow from pressure measurements. International Journal Multiphase Flow 13(1): 13-21. https://doi.org/10.1016/0301-9322(87)90003-6
[34] Matsubara, H., Naito, K., (2011) Effect of liquid viscosity on flow patterns of gas-liquid two phase flow in a horizontal pipe. International Journal of Multiphase Flow, 37(10): 1277-1281 https://doi.org/10.1016/j.ijmultiphaseflow.2011.08.001
[35] Gualtieri, C., Chanson, H. (2007). Experimental analysis of Froude number effect on air entrainment in the hydraulic jump. Environmental Fluid Mechanics, 7: 217-238. https://doi.org/10.1007/s10652-006-9016-1
[36] May, D., Allen, J., Nelson, D. (2018). Hydraulic investigation of air in small diameter pipes. International Journal of Hydraulic Engineering, 7(3): 51-57. https://doi.org/10.5923/j.ijhe.20180703.02
[37] Kocabas, F., Unal, S., Unal, B. (2008). A neural network approach for prediction of critical submergence of an intake in still water and open channel flow for permeable and impermeable bottom. Computers & Fluids, 37(8): 1040-1046. https://doi.org/10.1016/j.compfluid.2007.11.002
[38] Kocabas, F., Unal, S. (2010). Compared techniques for the critical submergence of an intake in water flow. Advances in Engineering Software, 41(5): 802-809. https://doi.org/10.1016/j.advengsoft.2009.12.021
[39] Lubbers, C.L., Clemens, F.H.L.R. (2005). Capacity reduction caused by air intake at wastewater pumping stations. In 3rd International Conference on Water and Wastewater Pumping Stations, Bedfordshire, United Kingdom, pp. 119-131.
[40] Lubbers, C., Clemens, F. (2007). Detection of gas pockets in pressurized waste water mains using dynamic system response analysis. Water Science and Technology, 55(4): 31-38. https://doi.org/10.2166/wst.2007.092
[41] Wisner, P.E., Mohsen, F.N., Kouwen, N. (1975). Removal of air from water lines by hydraulic means. Journal of the Hydraulics Division, 101(2): 243-257. https://doi.org/10.1061/JYCEAJ.0004201
[42] Viana, F., Pardo, R., Yanez, R., Trallero, J.L., Joseph, D. D. (2003). Universal correlation for the rise velocity of long gas bubbles in round pipes. Journal of Fluid Mechanics, 494: 379-398. https://doi.org/10.1017/S0022112003006165
[43] Hager, W.H. (2010). Wastewater Hydraulics: Theory and Practice. Springer Science & Business Media. Springer Berlin, Heidelberg.
[44] Wang, H., Chanson, H. (2015). Air entrainment and turbulent fluctuations in hydraulic jump. Urban Water Journal, 12(6): 502-518. https://doi.org/10.1080/1573062X.2013.847464
[45] Kalinske, A.A., Bliss, P.H. (1943). Removal of air from pipelines by flowing water. Proceedings of the American Society of Civil Engineers (ASCE), 13(10): 3.
[46] Gonzalez, C.A., Pozos, O. (2000). Análisis experimental del ingreso de aire en un acueducto. Doctoral dissertation. Univesidad Nacional Autónoma de México, México.
[47] Aydin, M.C., Ulu, A.E. (2021). Aeration performance of high-head siphon-shaft spillways by CFD models. Applied Water Science, 11(10): 165. https://doi.org/10.1061/(ASCE)HY.1943-7900.0001963
[48] Li, P.C., Zhu, D.Z., Xu, T.Y., Zhang, J. (2022). Air demand of a hydraulic jump in a closed conduit. Journal of Hydraulic Engineering, 148(2): 04021058. https://doi.org/10.1061/(ASCE)HY.1943-900.00019
[49] Liu, L., Yan, H.J., Zhao, G.J. (2015). Experimental studies on the shape and motion of air bubbles in viscous liquids. Experimental Thermal and Fluid Science, 62: 109-121. https://doi.org/10.1016/j.expthermflusci.2014.11.018
[50] Marks, A.R., Reis, B.K., Hughes, G. (2011). Waller creek tunnel design and elimination of entrained air blow back conditions. In World Environmental and Water Resources Congress 2011: Bearing Knowledge for Sustainability, pp. 4605-4614. https://doi.org/10.1061/41173(414)480
[51] Webby, M.G. (2003). Investigation of Blowback Incidents at Rangipo Power Station. Opus International Consultants, Wellington, New Zealand.
[52] Chan, S.N. (2023). Air pocket expulsion from a submerged dropshaft with inflow. Journal of Irrigation and Drainage Engineering, 149(3): 06022010. https://doi.org/10.1061/JIDEDH.IRENG-9708
[53] Yang, Q.H., Yang, Q. (2023). Experimental investigation on the hazard of geyser created by an entrapped air release in baffle-drop shafts. Scientific Reports, 13(1): 7953. https://doi.org/10.1038/s41598-023-34253-1
[54] Asadsangabi, F., Talebbeydokhti, N., Rahnavard, M. (2014). Two phase flow modeling in shaft-spillways using volume of fluid (VOF) method. Iranian Journal of Science and Technology. Transactions of Civil Engineering, 38(C1): 99.