El Houssaine Ouacha | Redouane Leghrib | Nabil Khatib*![]() | Bouazza Faiz | Hicham Banouni | Ali Moudden | Idriss Aboudaoud
| Bouazza Faiz | Hicham Banouni | Ali Moudden | Idriss Aboudaoud
© 2023 IIETA. This article is published by IIETA and is licensed under the CC BY 4.0 license (http://creativecommons.org/licenses/by/4.0/).
OPEN ACCESS
Presently, the quantification of water content in ultra high temperature (UHT) processed milk predominantly relies on destructive methods such as pH and conductivity measurements. These methodologies, while effective, are time-consuming and necessitate specific experiential knowledge. This study delineates a non-destructive alternative employing ultrasound technology for monitoring water content in UHT milk. The interplay between electrical conductivity and water content in UHT milk was scrutinized and juxtaposed with ultrasound measurements. Ultrasound parameters, specifically pulse velocity and attenuation coefficient, were scrutinized as functions of water content at varying test temperatures. This approach elucidated the evolution of the physicochemical attributes of UHT milk with unprecedented clarity. The findings underscore the feasibility of determining water content via temperature-dependent ultrasound readings of velocity and attenuation. Importantly, this study substantiates the potential of ultrasound technology as a practical, non-destructive replacement for conventional methodologies in the dairy industry.
non-destructive testing, ultrasound, milk quality monitoring, electrical conductivity
For generations, milk has been hailed as a nutritious food that promotes good health. It is rich in essential nutrients like calcium and protein, which our bodies need in various forms. Different types of milk are uniquely suited to meet the specific needs of the animals they come from, making them complete and natural sources of nourishment.
In light of the research conducted by the authors of the referenced article [1], milk emerges as a pivotal dietary component, offering a remarkable protein profile replete with indispensable amino acids, notably lysine-an essential amino acid crucial for growth. Notably, milk lipids exhibit a distinct composition, characterized by a substantial abundance of shot-chain fatty acids that surpass the levels of unsaturated fatty acids, rendering them distinct from other dietary fats. Moreover, milk encapsulates notable quantities of cholesterol, vitamin A, and modest amounts of vitamin D and E. It is imperative to underscore the principal constituents and their average compositions in cow’s milk, as outlined in the study [2-4]:
Water=87.5%, Fatty matter=3.9%, Protein=3.4%, Lactose=4.8%, Minerals=0.4%.
So, water plays a crucial role in milk, as evidenced by its proportion values outlined in the study [5]. Due to its polar nature, with a dipole and free electron doublets, water can form true solutions with polar substances like carbohydrates and minerals. It also forms colloidal solutions with the hydrophilic proteins found in the milk serum. Consequently, accurately determining the percentage of water in milk is challenging without employing precise control methods to ensure accurate measurements.
The quality of UHT milk can be examined from different aspects using different methods allowing the analysis of its chemical, physical, microbiological and nutritional characteristics [2]. Traditionally, the percentage of water in UHT milk has been traditionally estimated through the measurement of electrical conductivity. This requires using a conductivity meter, which needs to be cleaned after each measurement. In assessing water content in UHT milk, conventional methods prove impractical due to the challenging task of accessing the probe’s interior. As an alternative, the implementation of ultrasound techniques emerges as a rapid, non-invasive, and efficient solution. While ultrasound techniques are well-established in analyzing various processes [6-10], their potential in biochemistry and microbiology instruments remains underutilized. This article emphasizes the significance of these techniques, offering readers a fresh perspective on enhancing biochemical processes with their unique attributes.
The measurement of ultrasonic parameters such as velocity and attenuation of ultrasonic waves in a given medium can provide information on the components and variations taking place as a function of time. Namely the monitoring of the adulteration of automotive fuel in order to minimize the rate of pollution induced to the use of the car [11], monitoring and characterization of a mortar during its evolution [6, 12].
The ultrasonic technique has recently made a remarkable breakthrough in the control of liquid food products. In this context, we mention the following published work: Nagata and his team, patented an ultrasonic testing method for liquid food products by measuring the ultrasonic parameters of the ultrasonic pulse passing through an immersed bottle [13]. It has also been shown that the microbiological quality of aseptic dairy products can be revealed nondestructively using ultrasonic imaging [14]. Khatib et al. [6] showed that the early age behaviour of cement based materials can be determined by following the time-domain evolution of attenuation coefficient and modulus of reflection coefficient. Izbaim et al. [15] conducted a study for the determination of milk coagulation time by ultrasound compared with pH meter measurements. Hamine et al. [16] have developed a new ultrasound signal amplification method for the analysis of bacterial suspensions of different concentrations by ultrasound. Elvira et al. [17] analyzed the performance of their ultrasonic device to perform non-destructive and rapid detection of microbial contamination in UHT milk packages. Ouacha et al. [18] have developed a device for the detection of the presence of a trace of air inside the package of UHT milk. Rapid, non-destructive analysis for comparison of liquid dairy products and shows promise in detecting dilution [19]. This progress allows this technique to compete with other modern rapid methods.
The main objective of this work is to monitor the percentage of water in UHT milk produced locally in Morocco, based on measurements of ultrasonic parameters. The main characteristics of this ultrasonic device are analyzed and some measurements preliminary results are shown. Our technique shows the sensitivity to the detection of this common type of adulteration. Thus, the study aims to show the feasibility and importance of the ultrasonic technique, in order to replace the destructive techniques currently used in the dairy industry, so to control the percentage of water in milk.
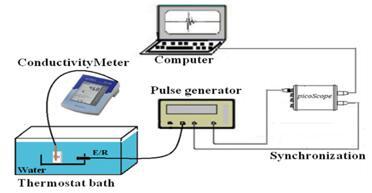
In this setup, measurements are performed by an ultrasonic immersing transducer with a centeral frequency of 5 MHz. The transducer used works alternately as a transmitter and a receiver. The pulse generator excites the transducer electrically. The transducer excites, under normal incidence, the container enclosing the UHT. The transducer and the samples are immersed in the thermostat (Fisher Bioblock Scientific, USA) containing water. This programmable thermostat allows maintaining and homogenizing the water temperature during the experiment. The backscattered signal is picked up by the same transducer. The signal travels through the same cable as the transmission signal and arrives at the T/R connector from which the transmission signal was sent. Thanks to a gate and a delay system integrated in the pulse generator, the received signal is visualized by connecting by a coaxial cable the output signal connector to the input A of a picoscope (350 MHz). This last one is synchronized by the generator thanks to a coaxial cable linking its connector (EXTERNAL TRINGER) and the input (AUX IN Connector) of the picoscope. The ultrasonic signal is finally visualized on a laptop computer linked to the picoscope by a USB cable. In addition, we have also followed the evolution of conductivity in UHT milk using the conductivity meter (Conductivity Meter CON 1500). The Figure 1 below shows the diagram of the experimental setup developed during this work in order to follow the evolution of the ultrasonic parameters.
Figure 1. Diagram of the monostatic method
3.1 Sample preparation
The UHT milk studied is the most dominant milk in the dairy industry in Morocco. These samples are studied for different temperatures (25℃, 30℃, 35℃, 40℃) for different percentages of water (0% to 60%) in UHT milk. The mixture undergoes stirring for a duration of 4 minutes to achieve homogenization and reach the desired thermostat temperature, which is set as the experiment's operating temperature. Subsequently, the mixture is carefully transferred into a container. This container is immersed in a water-filled thermostat to maintain a constant temperature throughout the experiment. Finally, the container is excited by a 5 MHz central frequency immersing transducer. Table 1 presents the ultrasonic characteristics of the water and the plates constituting the faces of the container [20].
Table 1. Acoustic characteristics of water and Plexiglas
|
|
Velocity Longitudinal (m/s) |
Density (Kg/m3) |
Acoustic Impedance 106 Kg/m2. s |
|
Water |
1480 |
1000 |
1.48 |
|
Plexiglas |
2680 |
1200 |
3.216 |
3.2 Ultrasonic measurement method
The method implemented consists in measuring the viscoelastic parameters of UHT milk. It consists in measuring the phase velocity and the attenuation of ultrasounds in the milk.
Consider a product enclosed in a container between two PMMA (Polymethacrylate) Plates, immersed in water, the geometry of the problem is shown in Figure 2.
Figure 2. Problem geometry
Figure 3. Incident beam path schematic
Figure 4. Backscatter signal from the UHT milk container
The experiments are performed by the monostatic technique (normal incidence testing method).
The container is inserted normally to its plane by a transducer of central frequency 5 MHz. The incident signal (A0) follows the path represented by the diagram in Figure 3.
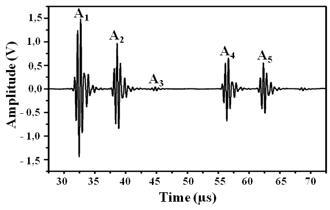
Figure 4 represents the signal reflected by the container of UHT milk, obtained with a platform on LabVIEW.
This signal includes a first part composed of 3 echoes:
The echo A1, related to the specular reflection of the incident beam at the interface between water and the first face of the Plexiglas plate.
The second echo A2 corresponding to the reflection on the interface between the second face of the Plexiglas plate and enclosed UHT milk.
The third echo A3 corresponding to the second round trip in the Plexiglas plate.
The second part also includes 3 echoes, all having crossed the enclosed UHT milk in round trip:
The first echo A4 corresponds to the reflection at the interface between UHT milk and the second Plexiglas plate.
The echo A5 represents the echo corresponding to a round trip in the second Plexiglas plate, in addition to the round trip in UHT milk.
3.2.1 Propagation velocity
Mak [21] and Kline [22] used similar methods to measure the propagation velocity in a plate using a contact transducer, in which the coupling between the plate and the transducer is made with a thin layer of acoustic gel. In our study, the coupling between the transducer and the container was made with water. Our parallelepipedic container is equivalent to a liquid (water or milk) enclosed between two plates. For the measurement of the velocity in the liquid, we introduce the factors containing the phase. The Fourier transforms of the two echoes A2 and A4 will have the expression:
$\begin{aligned} & A_2^r=A_0(f) T_{12} R_{23} T_{21} \exp \left(-2 \alpha_{\mathrm{pg}}(f) d\right) \exp j\left(\frac{\omega}{V_{\mathrm{pg}}} 2 d+\phi_0\right)\end{aligned}$ (1)
$\begin{aligned} & A_4^r=A_0(f) T_{12} T_{23} R_{34} T_{32} T_{21} \exp \left(-2 \alpha_{\mathrm{pg}}(f) d\right) \exp (-2 \alpha(f) L) \exp j\left(\frac{\omega}{V_{\mathrm{pg}}} 2 d+\frac{\omega}{V_{\text {LHT mitk }}} 2 L+\phi_0\right)\end{aligned}$ (2)
where, $V_{p g}$ and $V_{U H T \text { milk }}$ are respectively the phase velocities in Plexiglas and in UHT milk.
$R_{i j}=\frac{Z_j-Z_i}{Z_j+Z_i}, T_{i j}=\frac{2 Z_i}{Z_j+Z_i}$ (3)
and $\phi_0$ is the phase of the incident wave.
The phase velocity is given by the following equation [20]:
$V_{\mathrm{UHT}_{\text {milk }}}\,\,(f)=\frac{\omega 2 L}{\phi_{\mathrm{UHT}_\,\,\,{\text {milk } /\mathrm{pg}}}\,\,\,\,\,\,-\phi_{\mathrm{pg} / \mathrm{UHT \text {milk }}}}$ (4)
with
$\phi_{\mathrm{pg} / \text { UHTmilk }}$ : The phase of the echo A2
$\phi_{U H T \text { milk } / \mathrm{pg}}$ : The phase of the echo A4
The FOURRIER transform of the echo A2 isolated by means of the temporal filtering program, gives the real $R_2(\omega)$ and imaginary $I_2(\omega)$ parts which allows calculating the phase $\phi_{\mathrm{pg} / U H T m i l k}$ according to the classical relation:
$\phi_{\mathrm{pg} / \mathrm{UHImilk}}\,\,=\operatorname{arctg}\left(\frac{I_2(\omega)}{R_2(\omega)}\right)$ (5)
While the FOURRIER transform of the isolated echo $A_4$ gives the real $R_4(\omega)$ and $I_4(\omega)$ imaginary parts allowing calculating the phase $\phi_{\text {UHTmilk } / \mathrm{pg}}$ :
$\phi_{U H T \text { milk } / \mathrm{p g}}\,\,=\operatorname{arctg}\left(\frac{I_4(\omega)}{R_4(\omega)}\right)$ (6)
3.2.2 Attenuation
Let us take for example the case of the reflection on the first interface, that is the interface between the medium noted M1 and the medium noted M2 (Figure 3). The emitted signal has the amplitude $A_0(f)$ at frequency $f$. The solution of the propagation equation of the wave in the medium 1 has the expression:
$\int_{-\infty}^{+\infty} \,\,A_0(f) \exp \left(-j 2 \pi f\left(t-\frac{x}{V}\right)\right) \mathrm{d} f$ (7)
V is the velocity of propagation in the medium 1.
The wave reflected on the first interface has the expression:
$\int_{-\infty}^{+\infty} A_0(f) R_{12} \exp \left(-j 2 \pi f\left(t-\frac{x}{V}\right)\right) \mathrm{d} f$ (8)
with
$R_{12}=\frac{Z_2-Z_1}{Z_2+Z_1}$ (9)
Z1 and Z2 are respectively the acoustic impedances of media M1 and M2.
The FOURRIER transform of this response is equal to:
$A_0(f) R_{12} \exp \left(-j \frac{2 \pi f}{V} x\right)$ (10)
whose amplitude is $A_0(f) R_{12}$, and noted A1.
The signal transmitted after this interface has the expression:
$\int_{-\infty}^{+\infty} \,\,A_0(f) T_{12} \exp \left(-j 2 \pi f\left(t-\frac{x}{V_{\mathrm{pg}}}\right)\right) \mathrm{d} f$ (11)
with
$T_{12}=\frac{2 Z_1}{Z_2+Z_1}$ (12)
And $V_{p g}$ is the propagation velocity in the Plexiglas.
At the plate1-milk interface, the monochromatic solution of the propagation equation has the expression:
$A_0(f) T_{12} \exp \left(-\alpha_{\mathrm{pg}}(f) x\right) \exp \left(-j 2 \pi f\left(t-\frac{x}{V_{\mathrm{pg}}}\right)\right)$ (13)
where, $\alpha_{\mathrm{pg}}$ is the attenuation in the Plexiglas plate.
The amplitude of the FOURRIER transform of the polychromatic wave is given by:
$B_1=A_0(f) T_{12} \exp \left(-\alpha_{\mathrm{pg}}(f) d\right)$ (14)
where, d is the thickness of the Plexiglas plate.
We repeat the same process at each level and at each interface, and we obtain:
$A_2=A_0(f) T_{12} R_{23} T_{21} \exp \left(-2 \alpha_{\mathrm{pg}}(f) d\right)$ (15)
and
$\begin{aligned} & A_4=A_0(f) T_{12} T_{23} R_{34} T_{32} T_{21} \exp \left(-2 \alpha_{\mathrm{pg}}(f) d\right) \exp (-2 \alpha(f) L)\end{aligned}$ (16)
where, $\alpha(f)$ is the attenuation in UHT milk [23, 24].
$\alpha(f)=-\frac{1}{2 L} \ln \left(\frac{A_4}{A_2} \xi_{\mathrm{ref}}\right)$ (17)
with
$R_{i j}=\frac{Z_j-Z_i}{Z_j+Z_i}, T_{i j}=\frac{2 Z_i}{Z_j+Z_i}$ (18)
and
$\xi_{\text {ref }}=\left|\frac{\left(Z_{\text {Lait }}\,\,-Z_{P g}\,\,\right)\left(Z_{\text {Lait }}\,\,+Z_{P g}\,\,\right)^2}{4 Z_{\text {Lait }} \,\,Z_{P g}\,\,\left(Z_{p g}-Z_{\text {Lait }}\,\,\right)}\right|$ (19)
The measurement of attenuation in UHT milk is dependent on the measurement of the acoustic impedance of UHT milk.
$Z_{\text {lait }}$ is the acoustic impedance in UHT milk.
$Z_{\text {pg}}$ is the acoustic impedance in Plexiglas.
The echoes A2 and A2 are isolated separately by means of the temporal filtering program implemented on the microcomputer. We note $A_2(f)$ and $A_4(f)$ the corresponding amplitude spectra.
3.3 Electrical conductivity
Electrical conductivity refers to a material's ability to conduct electric current, and is generally quantified in milliSiemens per centimeter (mS/cm). This property results mainly from the presence of ions, such as chlorides, phosphates, citrates, carbonates, potassium, sodium, calcium and magnesium [25]. In particular, a direct correlation has been established between electrical conductivity (measured in mS/cm) and chloride ion concentration (expressed in mg per 100 ml of milk) [26].
To monitor the electrical conductivity of the UHT milk sample throughout the experiments, the CyberComm Pro program [Bench CON1500] was used. This program records the conductivity measurements acquired by the ConductivityMeter CON 1500 (Figure 5).
Figure 5. Image of the assembly for measuring the electrical conductivity of UHT milk
4.1 Propagation velocity
We measured the ultrasonic velocity as a function of the percentage of water in UHT milk for different temperatures. The measurements are performed over a range of water percentage between 0% and 60%.
Figure 6. The evolution of the ultrasonic velocity as a function of the percentage of water in UHT milk for different temperatures
Figure 6 shows the variation of the ultrasonic velocity as a function of the percentage of water in UHT milk. For all temperatures we note that the trend of the speed is almost linear and that the speed decreases when the percentage of water in UHT milk increases. The knowledge of the ultrasonic velocity in UHT milk is therefore sufficient to deduce the percentage of water in the milk. The ultrasonic velocity is a good indicator to control the UHT milk, i.e., to measure the percentage of water in the UHT milk after having made a chart before.
4.2 Attenuation
Figure 7. The evolution of the attenuation in UHT milk as a function of the percentage of water for different temperatures
Attenuation is also influenced by temperature, although it is not widely cited in the literature. The analysis of curves obtained, for temperatures (25℃, 30℃, 35℃, 40℃) showed that the attenuation decreases when the percentage of water increases for each given temperature due to changes in the physicochemical properties of milk (Figure 7). We noticed that the evolution of the attenuation makes abnormal variations with the fluctuation of the signal. We also observed that the temperature 40℃ is not adequate for the control of the water effect on UHT milk.
4.3 Electrical conductivity
Figure 8. The evolution of conductivity in UHT milk as a function of water percentage for different temperatures
Figure 8 represents the influence of water on the conductivity in UHT milk for different temperatures. We observe that the evolution of conductivity keeps the same shape for the different temperatures. Indeed, this evolution has a decreasing trend according to the percentage of water in the UHT milk. At the beginning we report that there was a slight dependence between conductivity and temperature, the more we increase the temperature the more the conductivity increases. This result appears in particular at the initial moment of the experiments carried out. But as soon as we go beyond this initial moment, we notice that the conductivity takes a fast decreasing almost linear trend according to the percentage of water added for the different temperatures. This change in conductivity is explained by an increase in the concentration of lactose and K+ ion in UHT milk and a decrease in its concentration of Na+ and Cl- ion [25]. The relationship between conductivity and chloride ion concentration is as follows [26]:
Conductivity $=0.685+0.1039\left[\mathrm{Cl}^{-}\right]$ (20)
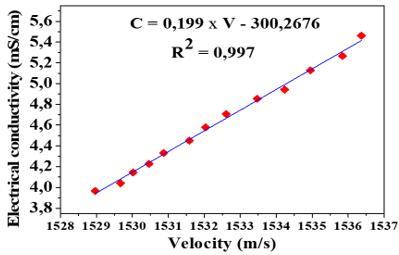
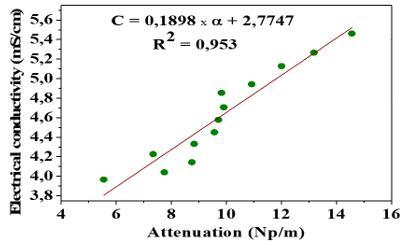
The Figure 9 and Figure 10 show the conductivity as a function of the ultrasonic parameters in order to show the correlation between the conductivity with the ultrasonic parameters. We observed a great linear correlation between the ultrasonic parameters: attenuation and velocity with the electrical conductivity shown in Figure 9 and Figure 10 respectively. We have noticed, clearly, a very good correlation between the conductivity and the velocity with respect to the attenuation; these ultrasonic parameters evolve in the same directions with the conductivity. From these correlations between these experimental measurements, we can conclude that the conductivity measurements could be replaced by the ultrasonic measurements.
Figure 9. Conductivity as a function of velocity
Figure 10. Conductivity as a function of attenuation
The strong linear correlation observed between ultrasonic parameters (attenuation and velocity) and electrical conductivity in UHT milk, as shown in Figure 9 and Figure 10, indicates the feasibility of using ultrasonic techniques as an effective alternative to conventional methods for water content analysis. This correlation highlights the potential for non-destructive and real-time measurements, making ultrasonic technology a promising tool for rapidly and accurately assessing water content in UHT milk. Implementing ultrasonic techniques could lead to improved quality control and greater efficiency in the food industry while also opening up possibilities for broader applications in dairy product analysis and research.
In this study, we explored ultrasonic wave behavior in UHT milk comprehensively, measuring phase velocity, attenuation, and conductivity. Our findings demonstrate ultrasonic techniques as a credible substitute for conductivity meters in the dairy industry. Particularly, ultrasonic velocity proves efficient in detecting UHT milk adulteration with higher accuracy than conductivity. This advancement holds significant potential for refining water content analysis and uncovering various milk adulteration types. By bridging laboratory insights with practical applications, our research introduces a game-changing approach for enhancing milk quality assessment and adulteration detection, promising widespread industry benefits.
[1] Norazmir, M.N., Norazlanshah, H., Naqieyah, N., Anuar, M.K. (2012). Understanding and use of food package nutrition label among educated young adults. Pakistan Journal of Nutrition, 11(10): 836-842.
[2] Robinson, R.K. (2014). Encyclopedia of Food Microbiology. Academic Press.
[3] Haug, A., Høstmark, A.T., Harstad, O.M. (2007). Bovine milk in human nutrition-A review. Lipids in Health and Disease, 6(1): 1-16.
[4] Lindmark-Månsson, H., Fondén, R., Pettersson, H.E. (2003). Composition of Swedish dairy milk. International Dairy Journal, 13(6): 409-425. https://doi.org/10.1016/S0958-6946(03)00032-3
[5] Amiot, J., Fournier, S., Lebeuf, Y., Paquin, P., Simpson, R., Turgeon, H. (2002). Composition, propriétés physicochimiques, valeur nutritive, qualité technologique et techniques d’analyse du lait. Science et Technologie du Lait, 1-74.
[6] Khatib, N., Hitar, M.E.H., Ouacha, E.H., Banouni, H., Faiz, B., Décultot, D., Ousbih, M. (2021). Monitoring early age behavior of mortar by ultrasound technique for environmental issues: Effects of sand grading and salinity of mixing water. Construction and Building Materials, 306: 124852. https://doi.org/10.1016/j.conbuildmat.2021.124852
[7] McClements, D.J., Gunasekaran, S. (1997). Ultrasonic characterization of foods and drinks: Principles, methods, and applications. Critical Reviews in Food Science & Nutrition, 37(1): 1-46. https://doi.org/10.1080/10408399709527766
[8] Khatib, N., Ouacha, E., Faiz, B., Ezzaidi, M., Banouni, H. (2019). Analysis of the attenuative behaviour of accelerated cement based materials through a series of ultrasound pulse echo measurements. Engineering Solid Mechanics, 7(2): 109-120. http://dx.doi.org/10.5267/j.esm.2019.4.002
[9] Benedito, J., Mulet, A., Velasco, J., Dobarganes, M.C. (2002). Ultrasonic assessment of oil quality during frying. Journal of Agricultural and Food Chemistry, 50(16): 4531-4536. https://doi.org/10.1021/jf020230s
[10] Khatib, N., Ouacha, H., Faiz, B., Ezzaidi, M., Banouni, H. (2018). Ultrasound study of setting and hardening behaviour of mortar using portland composite cements CPJ45 and CPJ35 and different dosages of an alkalifree setting accelerator for Shotcrete. Journal of Engineering and Applied Sciences, 13: 7150-7155.
[11] Leghrib, R., Ouacha, E., Zouida, A., Faiz, B., Amghar, A. (2020). Monitoring automobile fuel adulteration using ultrasound technique for environmental issues. Measurement, 150: 107004. https://doi.org/10.1016/j.measurement.2019.107004
[12] Bita, H., Faiz, B., Moudden, A., Lotfi, H., Ouacha, E.H., Banouni, H. (2017). Ultrasound monitoring of a mortar hydration using argand diagram: The effect of sand grain size and temperature. Construction and Building Materials, 155: 1003-1012. https://doi.org/10.1016/j.conbuildmat.2017.08.115
[13] Nagata, M., Kaneoka, T., Imano, S., Matumoto, H. (1989). Ultrasonic method of inspecting contents of a package and apparatus thereof. U.S. Patent No. 4,821,573. Washington, DC: U.S. Patent and Trademark Office.
[14] Wirtanen, G., Ahvenainen, R., Mattila-Sandholm, T. (1992). Non-destructive detection of the spoilage of aseptically-packed milk products: The effect of frequency and imaging parameters on the sensitivity of ultrasound imaging. LWT-Food Science and Technology, 25(2): 126-132.
[15] Izbaim, D., Faiz, B., Moudden, A., Malainine, M., Aboudaoud, I. (2012). Ultrasonic characterization of yogurt fermentation process. In Proceddings of the Acoustics 2012 Nantes Conference, Nantes, France, pp. 455-459.
[16] Hamine, A., Faiz, B., Moudden, A., Faghire, M., Ouacha, E.H., El Abassi, D. (2018). Analysis of bacterial suspensions of different concentrations and shapes by measuring ultrasonic velocity. In International Conference of Computer Science and Renewable Energies.
[17] Elvira, L., Sampedro, L., Matesanz, J., Gómez-Ullate, Y., Resa, P., Iglesias, J.R., Echevarría, F.J., De Espinosa, F.M. (2005). Non-invasive and non-destructive ultrasonic technique for the detection of microbial contamination in packed UHT milk. Food Research International, 38(6): 631-638. https://doi.org/10.1016/j.foodres.2004.12.001
[18] Ouacha, E., Faiz, B., Moudden, A., Aboudaoud, I., Banouni, H., Boutaib, M. (2015). Non-destructive detection of air traces inside UHT milk package by using ultrasonic through transmission method. International Review of Mechanical Engineering (I.RE.M.E.), 9(6): 589-599.
[19] Yang, Y., Wright, W.M., Hettinga, K.A., van Ruth, S.M. (2021). Exploration of an ultrasonic pulse echo system for comparison of milks, creams, and their dilutions. LWT, 136: 110616. https://doi.org/10.1016/j.lwt.2020.110616
[20] Sapriel, J. (1994). Ultrason. technique de l’ingénieur, traite électronique, E1910: 5.
[21] Mak, D.K. (1993). Ultrasonic phase velocity measurement incorporating couplant correction. British Journal of Non-Destructive Testing, 35(8): 443-449.
[22] Kline, R.A. (1984). Measurement of attenuation and dispersion using an ultrasonic spectroscopy technique. The Journal of the Acoustical Society of America, 76(2): 498-504. https://doi.org/10.1121/1.391591
[23] Faiz, B., Maze, G., Decultot, D., Moudden, A., Aassif, E.H., Ezzaidi, M. (1999). Ultrasonic characterization of the quality of an epoxy resin polymerization. IEEE Transactions on Ultrasonics, Ferroelectrics, and Frequency Control, 46(1): 188-196. https://doi.org/10.1109/58.741532
[24] Hamine, A., Faiz, B., Izbaim, D., Moudden, A. (2008). Ultrasonic technique for the quality control of water containing clay. Journal of the Acoustical Society of America, 123(5): 3233.
[25] Mabrook, M.F., Petty, M.C. (2003). Effect of composition on the electrical conductance of milk. Journal of Food Engineering, 60(3): 321-325. https://doi.org/10.1016/S0260-8774(03)00054-2
[26] KrrcHEN, B.J. (1981). Review of the progress of dairy science: Bovine mastitis milk compositional changes and related diagnostic test. J. Dairy Res, 48: 167-188.