Lendra Lendra*![]() | Mochamad Agung Wibowo
| Mochamad Agung Wibowo![]() | Jati Utomo Dwi Hatmoko
| Jati Utomo Dwi Hatmoko![]()
© 2023 IIETA. This article is published by IIETA and is licensed under the CC BY 4.0 license (http://creativecommons.org/licenses/by/4.0/).
OPEN ACCESS
The International Roughness Index (IRI) is a widely used measure of pavement roughness that has important implications for vehicle safety, ride quality, and road maintenance. Over the years, many research studies have been conducted on IRI, but the literature is dispersed and lacks an overall research mapping. To address this issue, a Systematic Literature Network Analysis (SLNA) method to review the topic of IRI from scientific publications from 2000-2021 to obtain state-of-the-art mapping, trending topics, and future work projection. The results show a significant increase in scientific document publications. Network visualization contains 189 keywords divided into six clusters. The biggest cluster is focuses on measuring road surface conditions to obtain the IRI value as part of monitoring road surface conditions using a mechanical method and vibration response. The keywords featured on the word cloud are pavements, surface roughness, road and street, pavement performance, asphalt pavement, and concrete pavement. Top trend topics are predictive analytics, decision trees, machine learning, and roughness prediction. The keywords machine learning and learning algorithms are up-to-date topics and closely related to forecasting and the international roughness index. The IRI prediction model is still feasible for further research by using a machine learning prediction model.
international roughness index, road engineering, systematic literature network analysis, trend analysis
Road pavements inevitably experience a decline in condition, carrying capacity, and serviceability as they age, face increased traffic volume, endure heavy loads, and are influenced by factors such as pavement type and environmental conditions [1-3]. This reduced serviceability is attributed to both structural and functional damages. Structural damage refers to deterioration caused by the inability of road pavements to withstand traffic loads and environmental conditions, while functional damage relates to the pavement's failure to provide an adequate level of comfort [4, 5]. The quality of road surface smoothness plays a crucial role in both the comfort experienced by road users and the overall performance and safety of driving [6-8].
The International Roughness Index (IRI) has emerged as a widely used benchmark for evaluating road surface unevenness [9-11]. Its transportability, excellent correlation, and proven validity have made it the preferred method for various countries and road authorities, including Australia, Canada, the Philippines, Indonesia, Austria, Belarus, Czech Republic, Ireland, Poland, Russia, Uruguay, and the United States, as recognized by organizations such as the Federal Highway Administration (FHWA), the American Association of State Highway and Transportation Officials (AASHTO), and US State Departments of Transportation (DOTs) [12-16], Existing IRI standards are defined by organizations such as AASHTO, ASTM, CEN, and the Czech Office for Standards, Metrology, and Testing [17].
Initially introduced by the National Cooperative Highway Research Program (NCHRP) and later developed by the World Bank in the 1980s [18-21], the measurement of IRI values has traditionally relied on a manual method, which presents several drawbacks such as time-consuming procedures, traffic disruption, and relatively high costs [22]. However, currently, there are multiple ways to obtain IRI values, including the use of predictive or correlation models between parameters influencing IRI [23-25]. In a recent study, sensors installed on smartphones were utilized to measure IRI for public road pavements, allowing for real-time monitoring of movement and vibrations on vehicles traveling at a certain speed [26]. The primary purpose of measuring IRI is to assess road surface roughness and facilitate the planning and execution of periodic preventive maintenance, ensuring the road remains comfortable and safe to traverse [27].
Despite the extensive use and significance of IRI, there is a notable gap in published research articles within international journals. Specifically, no literature reviews on IRI have explicitly employed a combined method of Systematic Literature Review (SLR) and Bibliometric Analysis (BA). The combination of these methods offers complementary strengths: SLR provides qualitative content analysis but requires substantial time for analysis, while BA offers quantitative analysis with shorter turnaround times [28]. This study aims to bridge this gap by conducting a comprehensive Systematic Literature Network Analysis (SLNA) focused on IRI. By leveraging a combined approach of SLR and BA, this study aims to map the relationships between concepts, identify the state of the art, determine research trends and directions, and generate insights for potential areas of future investigation [29].
To address this gap in the literature, the primary aim of this study is to conduct a Systematic Literature Network Analysis (SLNA) focusing on the International Roughness Index (IRI). By utilizing a combined method of Systematic Literature Review (SLR) and Bibliometric Analysis (BA), this study aims to comprehensively examine the existing body of research on IRI, its applications, limitations, and trends. The SLNA will provide state-of-the-art mapping, identify trending topics, and project future areas of work within the field of IRI analysis. Furthermore, this study seeks to offer valuable insights and contributions by mapping the relationships between concepts, identifying the state of the art in IRI research, determining research trends and directions, and generating knowledge that can inform further investigations in the field. The results of this study are expected to enhance the understanding of IRI, its measurement techniques, and its implications for road maintenance and safety.
2.1 International roughness index
The level of road surface roughness is an essential indicator of road performance and a crucial pavement design criterion [30]. In MEPDG, the level of road roughness is indicated by IRI [24]. IRI, the International Roughness Index, is commonly used to measure road roughness, calculated as the accumulated vertical suspension movement divided by the distance traveled by a simulated quarter-car at a measuring profile [17, 18, 31-33]. In general, road roughness characterization indicators are categorized into two classes: profile-based index and response-based index [12]. In this section, we will explore various aspects related to IRI, including measurement methodologies, influencing factors, pavement types, and the significance of IRI in road maintenance.
a) Measurement methodologies
To measure the IRI value, different methodologies have been employed. Manual methods involve tools such as Maymester, NAASRA Roughness Meter, Bump Integrator, BPR roughmeter, Rod and Level Survey, TRRL beam, APL trailer, GMR Profilometer [34], and RMD [35]. Additionally, deflection data collected using the Falling Weight Deflectometer (FWD) or Heavy Weight Deflectometer (HWD) tools are utilized for IRI measurement [36].
b) Factors influencing IRI
The IRI value is influenced by various factors, including traffic load, environmental impact, pavement roughness, and materials used for pavement construction [37]. Globally, asphalt is commonly used for flexible pavements, while cement concrete is preferred for rigid pavements [38, 39]. Flexible pavements consist of layers such as subgrade, subbase course, base course, and surface course, which support and distribute traffic loads. In contrast, rigid pavements rely on a layer of concrete to channel the traffic load to the subgrade soil [9].
c) Studies on IRI
Numerous studies have been conducted to explore different aspects of IRI. Here are some noteworthy findings:
· Prediction Models:
- A study in Brazil developed a mechanistic methodology to predict IRI using fatigue damage parameters calculated with FlexPAVETM software [40].
- Several studies have investigated the relationship between IRI and Pavement Condition Index (PCI). The findings indicate that the relationship can vary based on location, functional class, and slope [41]. Exponential regression was identified as the best model for connecting IRI and PCI in rural roads in Iran [42].
- Machine learning algorithms have been utilized to develop prediction models for IRI and PCI. Simpler algorithms, such as linear regression and decision trees, demonstrated higher accuracy in predicting IRI values [43].
- Creative fuzzy time series analysis was employed to build an IRI prediction technique with improved accuracy compared to existing methods such as polynomial fitting, autoregressive integrated moving average, and backpropagation neural network [44].
· Practical Applications:
- Studies have focused on practical applications of IRI thresholds for road rehabilitation. For example, a study in Taipei recommended an appropriate IRI threshold of 4.50 m/km for road rehabilitation [9].
- Another study in southern Italy examined the relationship between carrying capacity (dynamic modulus-HWD) and IRI on airport pavements [45].
- A survey of IRI-based specifications from several nations provided insights into national standards, variances, factors influencing specifications, and methodology discrepancies [17].
· Machine Learning and IRI:
- Systematic literature reviews have explored the use of machine learning for predicting IRI values. Artificial Neural Networks (ANN) and regression emerged as the dominant methods used by researchers worldwide, with the LTPP databases being the primary data sources. However, various countries also utilize their own national datasets [46].
· Spatial Data Forecasting:
- In the context of toll roads in Indonesia, studies have examined the estimation of IRI. Grey forecasting and the Spatial Statistical Dynamic (SSD) model were found to increase accuracy in forecasting spatial data, particularly for the Pondok Aren-Serpong toll road [47].
In this section, we will delve deeper into the literature to explore various studies on IRI, critically analyzing their strengths, limitations, and gaps, and examining how they collectively contribute to our understanding of IRI.
· Strengths:
- IRI is the most widely used index for indicating road surface roughness [48].
- State transportation departments use the mean IRI (MIRI) to monitor the roughness of their pavement network [49].
· While IRI is a widely used index for indicating road surface roughness, there are some limitations:
- Manual methods, such as Maymester, NAASRA Roughness Meter, and Bump Integrator, may offer cost-effective solutions but can be time-consuming and subject to user bias [34]. On the other hand, using FWD or HWD tools provides objective deflection data but requires specialized equipment and may cause disruptions in traffic flow [36].
- IRI values are sensitive to different factors, such as vehicle speed, wheelbase, and suspension [50].
- Inaccuracy between the number of vehicles' wheels can affect the accuracy of IRI values [50].
- The relationship between IRI and other measures of roughness and riding quality is not always clear [9].
· Gaps in the studies related to IRI, are:
- There is a need to address the sensitivity of IRI values, inaccuracy between the number of vehicles' wheels, and the characteristics of Android-based apps for measuring IRI [50].
- More research is needed on the effects of specific subgrade, climate, traffic, and design factors on pavement performance and their impact on IRI [49].
- There is a need to establish appropriate IRI thresholds for road rehabilitation in metropolitan areas [9].
2.2 Systematic literature network analysis
SLNA, which has been widely utilized by researchers from various fields and countries, has been employed in several studies. For instance, in a literature review focusing on the role of information systems in sustainable business development, SLNA with citation network analysis was used to identify research areas and development directions [51]. Another study used SLNA to analyze the development of supply chain risk management research over time, mapping influential studies and identifying future research directions [52]. Similarly, a previous SLNA study explored the evolution of the body of knowledge in the field of circular economy using citation network analysis, co-occurrence keyword network analysis, and global citation score analysis [29]. Safety climate knowledge was examined using SLNA with bibliometrics and citation network analysis, identifying influential authors and research works [53]. In the supply chain field, SLNA was employed to identify critical research areas on information sharing and associated risks, emphasizing current issues and guiding future research [54]. Additionally, a study combined SLNA with systematic literature review and citation network analysis to investigate the role of artificial intelligence in innovative city sectors and uncover the dynamics of the research field [55]. Another SLNA study analyzed the literature landscape on the concept of "Smart Factory," identifying research directions and essential areas of development [56].
SLNA is a quantitative research method that builds upon systematic literature reviews and bibliographic network analyses conducted by previous researchers [54]. Its quantitative approach enables a broader view of the knowledge domain and facilitates the identification of key pathways and critical issues in a more rigorous manner [56]. By using objective measures and algorithms, SLNA provides a comprehensive understanding of a specific field through the analysis of published literature [53]. Bibliometric analysis, as part of SLNA, extracts metadata from literature databases to evaluate and monitor research, contributing to a systematic and transparent review process that enhances the quality of the review [57]. The quantitative approach of bibliometric analysis is particularly helpful in guiding researchers to influential publications and objectively mapping the study topic before delving into detailed reading [58]. With the exponential growth of scientific publications, bibliometric analysis serves as a valuable tool for filtering and accessing fundamental previous research findings efficiently. Unfortunately, there are no search results that directly answer the question of whether there are systematic literature reviews or bibliometric analyses specifically focused on IRI.
3.1 Data collection method
This research used a dynamic literature review technique called systematic literature network analysis, which combines a systematic literature review with bibliographic network analysis, depending on objective measurements and algorithms to conduct quantitative literature-based topic discovery. Data collection was carried out on January 12, 2022, with the following steps:
· The document database used to search for literature related to the topic of IRI was Scopus. This database was chosen because it has a broad scope and is more comprehensive when compared to the Web of Science [59-61].
· The keyword/search string used was the international roughness index, because: first, IRI is more commonly used as a keyword in previous studies where the Mean Roughness Index (MRI) and Half-car Roughness Index (HRI) have been included in this term. The second IRI keyword was chosen to directly address the research questions by focusing on specific aspects or domains of interest. This approach utilizes more keywords to narrow down the search string, resulting in fewer documents retrieved compared to a search with fewer keywords. It is particularly beneficial when research questions require specific information or a particular context [62, 63]. The third IRI is the most commonly used worldwide index characterizing longitudinal road roughness for managing road systems [17]. It was applied to selecting article titles, abstracts, and keywords, resulting in 1,149 documents.
· The period in this study was determined using the Scopus database, limited from 2000 to 2021, resulting in 1,079 documents. Publication date range from 2000 until January 12, 2022. For the start date, there are no records available that show when the first article in 2000 was published.
· Subject areas were limited to Engineering, Social Sciences, Computer Sciences, Materials Science, Physics and Astronomy, Environmental Science, Earth, and Planetary Sciences, Mathematics, and Energy, resulting in 1,050 documents.
· Document types were limited to Article, Conference Paper, Conference Review, Review, and Book Chapter, yielding 1,046 documents.
· Language restricted to English, generated 999 documents.
· Filtering documents that are not related to IRI, manually by reading the title, abstract, keywords and content sequentially, so that the remaining documents related to IRI are 873 documents.
· The number of documents of the search results for SLNA was 873; descriptive information can be seen in Appendix.
· VOSviewer and Biblioshiny software were used in the visualization stage to process bibliometric data downloaded from the Scopus database. Here is a brief explanation of the two software:
- VOSviewer, developed by Nees Jan van Eck and Ludo Waltman from Leiden University, is a software tool designed for constructing and visualizing bibliometric networks [64]. Introduced in 2010, VOSviewer offers a user-friendly button-and-window interface with predefined functions and options. It provides simplicity, flexibility, and responsiveness to user needs, along with improved graphic quality. However, it has limitations when it comes to extending beyond its predefined functions and requires repeated analysis when combining data from different sources [65]. With VOSviewer, users can create, visualize, and explore maps of bibliometric networks. While its primary purpose is the analysis of bibliometric networks, it can also be utilized for analyzing other types of networks [64]. VOSviewer supports loading and exporting information from various sources [66].
- Biblioshiny is a software tool specifically developed for performing bibliometric analysis. When utilizing two different databases, particularly merging WoS and Scopus, using Biblioshiny can be somewhat challenging and time-consuming. Alternatively, Bibliometrix offers a more extensive range of techniques and is suitable for practitioners through Biblioshiny. As a web-based application, Biblioshiny provides a user-friendly interface that facilitates bibliometric analysis. It is designed to be used in conjunction with the R programming language. Biblioshiny encompasses a broad range of bibliometric indicators and enables the analysis of publication and citation data from diverse sources. Users can generate various visualizations, including co-authorship networks, bibliographic coupling networks, and citation networks. While it is recommended for researchers with some experience in bibliometric analysis and familiarity with R, Biblioshiny caters to their needs effectively [66].
· Research questions: RQ1: what is the state-of-the-art mapping of international roughness index research? RQ2: What are the emerging and trending topics in international roughness index research? RQ3: What future work could be done in international roughness index research?
3.2 Analysis method
Bibliometric analysis was performed on the dataset using a programming language called R; the special package used was the Bibliometrix package [67]. RStudio and Biblioshiny software are web-based and open to users to make them easier to use. Bibliometric analysis helps provide top-cited authors, publication sources, affiliations, geographic/country contributions, and more. There are three methods used to perform the analysis, including:
· To determine the state-of-the-art mapping, Biblioshiny software was used, producing the following visualizations: annual scientific production, most relevant sources, most relevant authors, corresponding authors by country, and word clouds; co-occurrence analysis was performed using VOSviewer software to generate a network visualization of keyword clusters. The minimum occurrence threshold was set to 10 by default in VOSviewer, which works well for large datasets. VOSviewer uses a combination of minimum cluster size, non-overlapping clusters, minimum occurrence threshold, and clustering techniques to determine keyword clusters and cluster overlap. Relevant terms are identified by VOSviewer to reduce clutter in the resulting map. The minimum occurrence threshold considers the total number of terms in the dataset. This approach was used to map a network in which each node represents a term, and the connections between those nodes reflect the simultaneous occurrence of those keywords. The method works by normalizing the number of co-occurrences to assess the strength of each [68], where the distance between circles indicates the keyword's significance, and the node's size indicates the keyword's frequency of occurrence [69]. Moreover, node overlap indicates the number of times the keywords appear together in the keyword network [70].
· Biblioshiny software was utilized to discover emerging or trending topics by conducting trend analysis. This involved identifying the frequency of selected keywords over time and generating thematic maps as visualizations to pinpoint emerging topics. To identify emerging topics, the authors of the study began by analyzing authors’ keywords and their frequency of occurrences and then carried out an analysis of keywords dynamics, trending topics, co-occurrence network, and thematic areas of the field [71]. Analysis of keywords used by authors in publications is an essential tool for investigating trending topics and scholars.
· While co-occurrence analysis was performed using VOSviewer software to produce an overlay of keyword cluster visualization from 2000 to 2021. This analysis will determine the link between ideas in the titles, keywords, or abstracts of documents [58]. The keyword co-occurrence network helps identify essential keywords used in publications in the knowledge domain and provides insight into the main domains of research themes. Two types of keyword matching networks have been created, firstly, a matching keyword network from the title, and secondly, a collaborative keyword network provided by the authors [72].
· Biblioshiny software was used to determine future work, which generated the trend topics. Meanwhile, collaborative analysis was carried out using VOSviewer software, showing overlapping clusters of keywords generated between 2000 and 2021, with the most yellow cluster indicating the minor node. The keyword co-occurrence network helps identify essential keywords used in publications in the knowledge domain and provides insight into the main research domain themes [73]. How were future research directions identified from keyword and cluster analyses? Keyword and cluster analyses can be used to identify future research directions by:
How were future research directions identified from keyword and cluster analyses using Biblioshiny software and VOSviewer software?
Here are some ways that future research directions can be identified from keyword and cluster analyses using Biblioshiny software and VOSviewer software, based on the search results:
Using VOSviewer software:
Using Biblioshiny software:
Overall, both Biblioshiny and VOSviewer software can be used to identify future research directions from keyword and cluster analyses. By using these tools, researchers can understand the intellectual and conceptual structure of a field, identify research fronts, and prioritize research efforts [66].
4.1 State-of-the-art international roughness index research
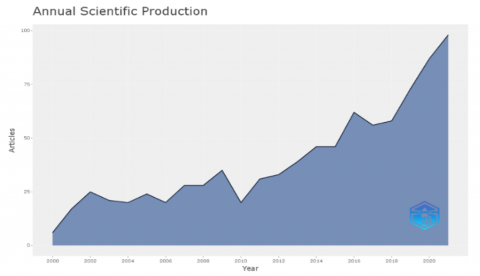
Figure 1. Annual scientific production
Based on the annual scientific production graph in Figure 1, during 2000-2021, there was a significant increase in the number of publications on the topic of IRI with annual growth rate: 14.23%. This result shows that research in this area remains very productive and in demand, with 73, 87 and 98 documents published in the last three years, namely in 2019, 2020, and 2021, respectively in the form of articles in journals, book chapters, conference papers, and conference reviews.
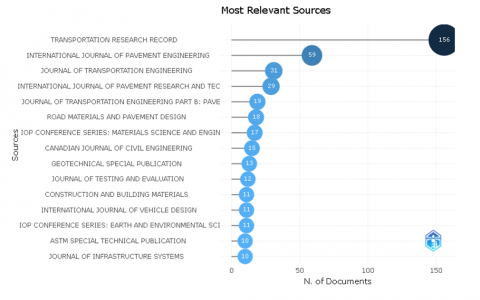
The graph of the most relevant sources in Figure 2 shows three outlets during 2000-2021 that have published the most scientific writings, including Transportation Research Record journal with 156 documents, International Journal of Pavement Engineering with 59 documents, and Journal of Transportation Engineering with 31 documents. These journals are the primary outlets for civil and structural engineering scientific publications, especially in the transportation and pavement categories with H-index, quartiles, and SJR 2020 each of 119-Q2-0.62; 46-Q1-0.92; and 75-Q2-0.57, respectively.
Figure 2. Most relevant sources
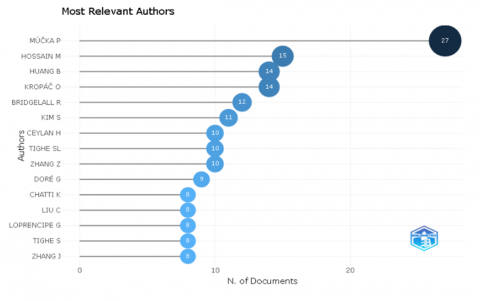
Identifying the most prolific writers in a field will be beneficial in identifying individual researchers/scholars who have made a significant contribution to the growth and evolution of that research field. Knowing the predecessors who pioneered studies in a particular domain will be helpful for future researchers to decide who might be approached for research policy formulation and who can be asked for their assistance in overcoming problems experienced by the organization [60].
The chart in Figure 3 presents the top four most relevant authors and the number of published articles, including Peter Múčka (27 articles), Mohammad Hossain (15 articles), Baoshan Huang (14 articles), and Oldrich Kropáč (14 articles). The three articles with the highest number of citations were written by Baoshan Huang et al. with 129 citations on the research topics asphalt mixtures, rutting, and textures, followed by Gong et al. with 80 citations on the research topics pavement, road maintenance, and life cycle costs, and Kropáč and Múčka with 55 citations on the research topics pavement roughness and unevenness.
Figure 3. Most relevant authors
These authors have contributed significantly to the field of IRI research, as evident from the number of citations their publications have received. Their work covers a range of topics such as limit values, spectral characteristics, vibration-based measurements, road roughness evaluation, forecast models, pavement performance, crumb rubber applications, predictive modeling, and statistical analysis. Their contributions have advanced the understanding and application of IRI in various aspects of road engineering and maintenance. The following are some of the publications by the top four authors as first authors and/or as corresponding authors related to the topic of IRI and pavement as can be seen in Table 1.
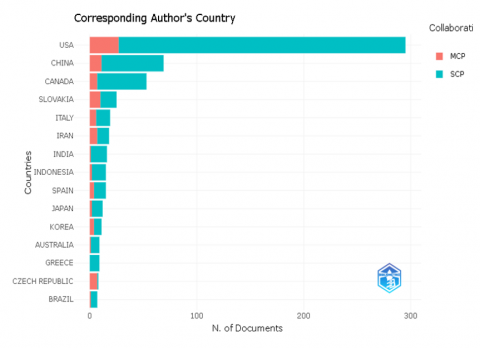
The graph in Figure 4 presents the corresponding author's countries and the number of documents published, with the top three countries including the USA (268 documents), followed by China (58 documents), and Canada (46 documents). These three countries also have the most research conducted in collaboration with other countries, as shown by the red section in Figure 4.
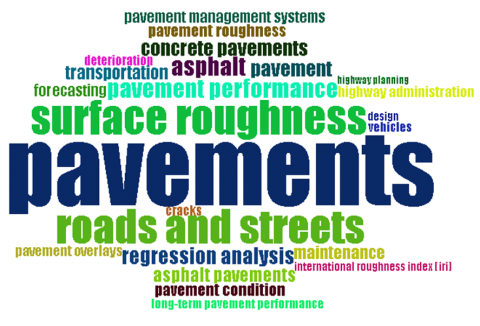
The word cloud displayed in Figure 5 shows that of the 25 keywords, the seven most extensive keywords are pavements, surface roughness, road and street, pavement performance, asphalt, regression analysis, pavement, and concrete pavement.
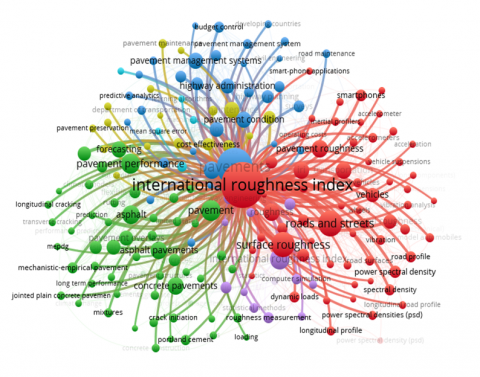
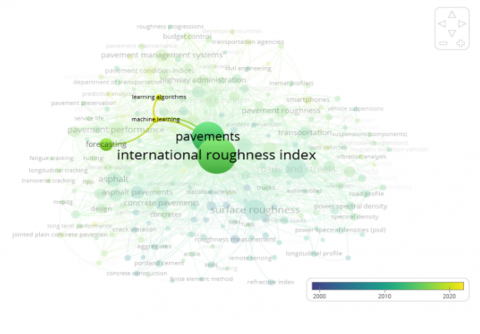
The mapping of the keyword network using VOSviewer was performed using the analysis type of co-occurrence, full counting method, all keywords as a unit of analysis, minimum number of occurrences of a keyword of 10. As a result, the network visualization presents 189 keywords and six clusters as shown in Figure 6.
Figure 4. Corresponding author's country
Figure 5. The word clouds
Table 1. Top author scientific publications and the number of citations
|
Author Name |
Scope of Research |
Number of citations |
|
Peter Múčka |
An overview of the IRI limit values for newly constructed, rebuilt, or repaired routes, operating (accessible) highways, and road categorization techniques used worldwide [17]. |
52 |
|
Contrast the spectral characteristics of actual roads with the ISO 8608 road classifications used in a sample of 27 research publications [78]. |
43 |
|
|
Determine the longitudinal roughness limitations of the road based on the vibrations caused by the driver-driver interaction system [79]. |
31 |
|
|
The article detailed the most current suggestions for evaluating road roughness published during the previous decade [80]. |
30 |
|
|
The paper summarized recent suggestions for road roughness assessment that have been published during the previous decade [81]. |
29 |
|
|
Mohammad Hossain |
Develops IRI and ANN forecast model for a flexible road in wet frost, dry frost, wet frost and dry frost climate zones [11]. |
28 |
|
Provide IRI for rigid pavements with the ANN model with climatic and traffic parameters as input [82]. |
12 |
|
|
Utilize ANN to predict the IRI for flexible pavements using climate and traffic data [83]. |
7 |
|
|
Baoshan Huang |
Compare the performance of asphalt pavements made with eight different crumb rubber-modified applications to those constructed with typical hot-mix asphalt pavement mixes [84]. |
129 |
|
Constructed a random forest regression model utilizing distress measures, traffic, climate, maintenance, and structural data to predict the IRI of flexible pavements [85]. |
80 |
|
|
Utilize the LTPP database to assess the efficacy and cost-effectiveness of various asphalt pavement repair processes and to find key influencing factors using multiple regression analysis [86]. |
43 |
|
|
Oldrich Kropáč |
The purpose of this study is to demonstrate the possible error if using only IRI to measure road unevenness by simulating seven homogeneous road profiles with different undulating values in the range of 1.5 to 3.0, and 0.1 [87]. |
55 |
|
The paper aims at evaluation of statistics of road unevenness indicators based on two international standards (ISO 8608, 1995; EN 13036-5, 2006) [88]. |
41 |
|
|
The purpose of this study is to deduce the reciprocal conversion connection between the standard power spectral density and the other two indicators and evaluate incremental departures from the standard model [89]. |
27 |
Figure 6. Network visualization
As can be seen in Figure 6, the first clusters are in red consisting of 63 keywords with the most common keywords as follows: international roughness index, surface roughness, road and streets, pavement roughness, acceleration, durability, longitudinal profile, smartphones, and vehicle response. The red cluster research focuses on measuring road surface conditions to obtain the IRI value as part of monitoring road surface conditions using a mechanical method in the form of a vibration response received by the vehicle. A recent study revealed that using smartphones and ordinary vehicles to obtain a vibration-based measurement method for monitoring pavement conditions is inexpensive and easy to use [90]. The second clusters are in green, consisting of 55 keywords with the most common keywords as follows: concrete pavement, asphalt, pavement, pavement performance, long-term pavement performance, forecasting, asphalt, pavement, environmental impact, climate change, road construction, and performance prediction. The green cluster research focuses on the impact of surface roughness on the road environment, especially the effect on fuel and truck tires. An example of a study that has been carried out is to prove that fuel consumption increases along with pavement roughness, thus impacting vehicle operating costs. This study used a simulated fleet consisting of 29 different vehicles representing various vehicle categories, technologies, and types of fuel. As a result, vehicle fuel consumption is affected by the vehicle’s rolling resistance. The pavement roughness and vehicle speed characteristics affect the rolling resistance [91].
The third clusters are in blue, consisting of 33 keywords with the most common keywords as follows: budget control, pavement management system, road maintenance, decision-making, pavement condition, pavement deterioration, pavement management, maintenance and rehabilitation, and regression analysis. The blue cluster research focuses on pavement management, which refers to the process of performing maintenance and rehabilitation to keep road conditions as optimal as possible. A study on the national road network in Iran based on cloud decision tree theory, presenting a model for selecting the most optimal maintenance and rehabilitation strategy, is one example of a study that has been conducted. The results of the cloud decision tree obtained show that fatigue cracking and IRI are the most critical parameters to determine the appropriate maintenance and rehabilitation scenario [92]. The fourth clusters are in yellow, consisting of 17 keywords with the most common keywords as follows: pavement management, pavement maintenance, pavement preservation, cost-benefit analysis, cost, service life, and cost-effectiveness. The study focuses on the problem of road operational and maintenance costs and their relation to road service life. A study that has been carried out related to this topic area applies a life-cycle cost analysis combined with a probabilistic pavement performance model based on survival analysis to evaluate the cost-effectiveness of different overlay strategies. Implementation of optimal pavement rehabilitation is essential for highway agencies to allocate a limited budget. The results apply to wet pavements carrying more than 500,000 single-axle equivalent loads per year [93]. The fifth clusters are in purple, consisting of 16 keywords with the most common keywords, including computer simulation, modeling, ridding qualities, highway systems, correlation methods, mathematical models, statistical analysis, and statistical methods. The focus of the research is computer simulation to get statistical correlation and modelling and driving comfort. An example of a study that has been carried out is using Monte Carlo simulation and road surface models to assess the level of driving comfort in automatic vehicles. The results are compared with the classification based on IRI empirical data using the threshold method and the ISO 2631 standard driving comfort guidelines [94]. The sixth clusters are in light blue, consisting of 5 keywords with the most common keywords as follows: decision trees, learning algorithms, machine learning, mean square error, and neural networks. The light blue cluster research focuses on developing predictive models to identify the IRI value using a variety of road damage factors. Machine learning, neural networks, and regression develop predictive models. An example of a study that has been done is predicting IRI values based on the LTPP database using Extreme gradient boosting (XGBoost). The results show that XGBoost provides a better model fit for the mean absolute error and coefficient of determination than the support vector regression and random forest models [46].
Table 2. Keywords analysis of international roughness index research
|
No. |
Keywords |
Frequency |
Occurrences |
Total Link Strength |
|
1. |
international roughness index |
577 |
618 |
4286 |
|
2. |
pavements |
416 |
416 |
3038 |
|
3. |
surface roughness |
191 |
175 |
1671 |
|
4. |
roads and streets |
190 |
190 |
1362 |
|
5. |
pavement performance |
107 |
114 |
928 |
|
6. |
asphalt |
106 |
98 |
770 |
|
7. |
regression analysis |
93 |
86 |
720 |
|
8. |
pavement |
88 |
115 |
1026 |
|
9. |
concrete pavements |
87 |
86 |
643 |
|
10. |
asphalt pavements |
81 |
81 |
565 |
Discussion:
The International Roughness Index Research Keywords Analysis Table is a combination of the analysis results of the word cloud and network visualization in the form of a table, was used to identify the state-of-the-art in IRI research to address RQ1. Based on the provided Table 2, the keywords "international roughness index" and "pavements" stand out with high frequencies, occurrences, and total link strength, suggesting their central importance in the keyword network. Other keywords like "surface roughness," "roads and streets," and "pavement" also show substantial associations and occurrences. These keyword analyses provide insights into the frequency, occurrences, and link strength of specific terms, helping researchers understand their significance and relationships within the domain of study.
4.2 The emerging and trending research topics in international roughness index research
The results of keyword mapping using VOSviewer with co-occurrence analysis and full accounting methods resulted in overlay visualization with the following keywords: pavement performance, international roughness index, road and street, pavement, pavement roughness, transportation, forecasting, machine learning, deterioration, decision tree, learning algorithms, and long-term pavement performance. These keywords are still up to date topics from 2010 to 2021 as shown in Figure 7. The results show keyword analysis from the publications of the international roughness index on the temporal dimension. The node colour represents the keyword's average publication year, while the node size represents the keyword's frequency of occurrence [95].
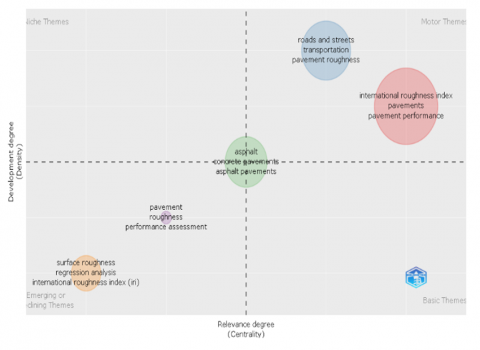
Nearly identical mapping results from keyword mapping using VOSviewer and bibliometric mapping using Biblioshiny are shown by the thematic map in Figure 8. There are keyword clusters for the categories of motor theme, roads and street, transportation, and pavement roughness.
Figure 7. Overlay visualization
Figure 8. Thematic map
The keyword clusters of international roughness index, pavement, and pavement performance are in the motor and basic theme categories. These six keywords are research topics that were the driving force from 2000 to 2021.
Discussion:
The analysis of keyword mapping using VOSviewer and Biblioshiny has revealed the emerging and trending research topics in international roughness index (IRI) research. The overlay visualization generated through co-occurrence analysis and full accounting methods identified key keywords such as pavement performance, international roughness index, road and street, pavement, pavement roughness, transportation, forecasting, machine learning, deterioration, decision tree, learning algorithms, and long-term pavement performance. These keywords have remained relevant and up-to-date throughout the period from 2010 to 2021.
The analysis of keyword usage on the temporal dimension has provided insights into the evolution of IRI research topics over time. The visualization, represented by node color indicating the average publication year and node size representing the frequency of occurrence, demonstrates the continued significance of these keywords.
The results obtained from both VOSviewer and Biblioshiny mappings have shown remarkable consistency, further confirming the emerging and trending research topics in IRI research. Thematic mapping has revealed keyword clusters related to motor themes, roads and streets, transportation, and pavement roughness. Notably, the clusters associated with international roughness index, pavement, and pavement performance have emerged as prominent areas of research, falling within the motor and basic theme categories. These six keywords have served as driving forces for research in the field of IRI from 2000 to 2021.
The identified research topics provide valuable insights for researchers and practitioners in the field of IRI. These trends highlight the importance of exploring areas such as pavement performance, machine learning, forecasting, and long-term pavement performance. By focusing on these emerging and trending research topics, future studies can contribute to the advancement of IRI research and its practical applications in transportation infrastructure management.
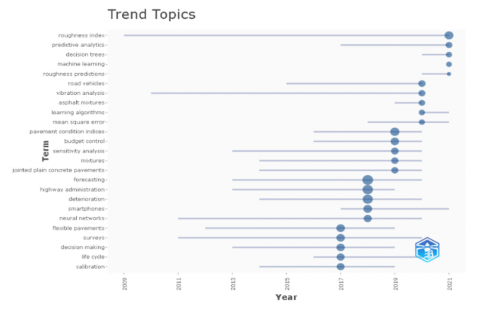
4.3 Potential future work in international roughness index research
The analysis results using bibliometric analysis using Biblioshiny are obtained in the trend topics graph for the last five years. At the top, the keywords include roughness index, predictive analytics, decision tree, machine learning, and roughness prediction, as can be seen in Figure 9 below. The co-occurrence analysis of the overlay visualization results in Figure 10 shows that the keywords machine learning and learning algorithms, as well as up to date topics with the yellow colour representation above 2020, are closely related to keywords forecasting and the international roughness index. Because the IRI model is related or influenced by several parameters, it will be reviewed in the following paragraph to provide a deeper view of future work.
An estimate/prediction model that can describe the condition of road infrastructure in the future is measuring or determining pavement grades as one of the essential elements at the network level and project level in the Pavement Management System [19, 46, 96]. The suitable model will provide accurate prediction results that can save construction costs effectively and efficiently during the road maintenance period [97].
Figure 9. Trend topics
Figure 10. Trending topics with overlay visualization
In 2022 there will be two IRI research publications; the first is a study in Laos to predict IRI models using ANN for double bituminous surface treatment and asphalt concrete pavements. This model uses Age, CESAL and YESAL parameters as input, with the result that the ANN model is more accurate than the multiple linear regression model [98]. The second study used IRI prediction models using several soft computing techniques, including gradient boosting method and random forest for flexible pavement to determine the effect of maintenance, traffic, and climate conditions. The results of the study reveal that SN is the most influential parameter based on the variable importance score [99]. These models generally relate IRI to pavement distresses, site conditions, climatic conditions, traffic levels, and structural parameters, such as layer thickness. Distress-based indices, such as rut depth and crack length, are used to determine the pavement coating’s rehabilitation time or service life. Therefore, good quality performance data combined with rational and accurate damage models are essential to accurately capture the total cost of living, energy consumption, and emissions [100]. The original IRI value is used as one of the quality assurance criteria by almost all road authorities across the globe, while the existing/current IRI indicates necessary pavement maintenance measures or rebuilding requirements [101, 102]. Based on the results of previous studies, it was found that the future direction where the current trend is the utilization of big data to measure IRI with an artificial intelligence prediction model approach, so that the measurement of IRI values becomes easier and cheaper but still accurate and reliable, of course using reliable data sources such as those sourced from the LTPP database.
Discussion:
Future work in international roughness index (IRI) research can focus on several key areas identified through bibliometric analysis and trend analysis. Recent trends, as depicted in the trend topics graph and co-occurrence analysis, highlight keywords such as roughness index, predictive analytics, decision tree, machine learning, and roughness prediction. These topics, particularly machine learning and learning algorithms, demonstrate a strong association with forecasting and the international roughness index, indicating their relevance for further investigation.
One important aspect for future work is the development of prediction models that accurately describe road infrastructure conditions, specifically pavement grades, at both the network and project levels within the Pavement Management System. These models should provide precise predictions to effectively manage construction costs during road maintenance periods. Recent publications have explored the use of artificial neural network (ANN) models for predicting IRI in different pavement types, demonstrating their superiority over traditional multiple linear regression models. Additionally, soft computing techniques like gradient boosting and random forest have been utilized to assess the effects of maintenance, traffic, and climate conditions on IRI prediction models for flexible pavements.
To ensure accurate evaluation of the total cost, energy consumption, and emissions associated with pavement performance, it is crucial to combine high-quality performance data with reliable damage models. The original IRI value serves as a quality assurance criterion for road authorities worldwide, while the existing IRI provides insights into necessary pavement maintenance measures or rebuilding requirements. As the field advances, the utilization of big data and artificial intelligence prediction models, leveraging sources like the Long-Term Pavement Performance (LTPP) database, is expected to simplify and streamline IRI measurement while maintaining accuracy and reliability.
Future research in IRI should concentrate on refining prediction models, incorporating advanced techniques such as machine learning, leveraging big data sources, and ensuring the availability of comprehensive and reliable performance data to support informed decision-making in road infrastructure management.
Based on the study of research using SLNA employing VOSviewer and Biblioshiny which are described in the sub-discussions to answer research questions, the following conclusions about research using keywords (research topics) about IRI can be drawn:
· The state-of-the-art research on the International Roughness Index (IRI) has shown a significant increase in publications over the years, indicating the continued productivity and demand for research in this field. Prominent outlets such as Transportation Research Record, International Journal of Pavement Engineering, and Journal of Transportation Engineering have been the primary sources of scientific writings in this area. Noteworthy authors like Peter Múčka, Mohammad Hossain, Baoshan Huang, and Oldrich Kropáč have made substantial contributions to IRI research, covering various topics such as limit values, predictive modeling, pavement performance, and statistical analysis. Collaboration between countries, particularly the USA, China, and Canada, has been prevalent in this research. The identified keyword clusters, including surface roughness, pavement performance, road and street, and pavement management, reflect the main areas of focus in IRI research. The analysis of keyword frequencies, occurrences, and link strength provides valuable insights into the significance and relationships within the domain of IRI study. Overall, this state-of-the-art research serves as a foundation for future investigations and advancements in the field of IRI.
· The analysis of keyword mapping using VOSviewer and Biblioshiny identified emerging and trending research topics in international roughness index (IRI) research, including pavement performance, international roughness index, road and street, pavement roughness, transportation, forecasting, machine learning, deterioration, decision tree, learning algorithms, and long-term pavement performance. These topics have remained relevant from 2010 to 2021 and provide valuable directions for future IRI research.
· Potential future work in international roughness index research is: Future work in international roughness index (IRI) research should focus on developing accurate prediction models using machine learning and big data approaches, leveraging sources like the Long-Term Pavement Performance (LTPP) database. These models should consider factors such as maintenance, traffic, and climate conditions to improve IRI measurement and provide cost-effective pavement management solutions. Additionally, integrating high-quality performance data and reliable damage models will ensure accurate assessment of total costs, energy consumption, and emissions related to pavement performance.
The authors would like to thank Palangka Raya University for funding the research and writing of this article with the decision letter of study aid/grant recipient.
|
Description |
Results |
|
MAIN INFORMATION ABOUT DATA |
|
|
Timespan |
2000:2021 |
|
Sources (journals, books, etc) |
292 |
|
Documents |
873 |
|
Average years from publication |
8.1 |
|
Average citations per document |
8.77 |
|
Average citations per year per doc |
1.165 |
|
References |
18119 |
|
DOCUMENT TYPES |
|
|
Article |
511 |
|
Book chapter |
12 |
|
Conference papers |
330 |
|
Conference review |
3 |
|
Review |
17 |
|
DOCUMENT CONTENTS |
|
|
Keywords Plus (ID) |
4118 |
|
Author's Keywords (DE) |
1482 |
|
AUTHORS |
|
|
Authors |
1863 |
|
Author appearances |
2778 |
|
Authors of single-authored documents |
49 |
|
Authors of multi-authored documents |
1814 |
|
AUTHOR COLLABORATION |
|
|
Single-authored documents |
77 |
|
Documents per author |
0.469 |
|
Authors per document |
23 |
|
Co-Authors per documents |
3.18 |
|
Collaboration Index |
2.28 |
[1] Sidess, A., Ravina, A., Oged, E. (2022). A model for predicting the deterioration of the international roughness index. International Journal of Pavement Engineering, 23(5): 1393-1403. https://doi.org/10.1080/10298436.2020.1804062
[2] Hossain, M., Gopisetti, L.S.P., Miah, M.S. (2020). Artificial neural network modelling to predict international roughness index of rigid pavements. International Journal of Pavement Research and Technology, 13: 229-239. https://doi.org/10.1007/s42947-020-0178-x
[3] Llopis-Castelló, D., García-Segura, T., Montalbán-Domingo, L., Sanz-Benlloch, A., Pellicer, E. (2020). Influence of pavement structure, traffic, and weather on urban flexible pavement deterioration. Sustainability, 12(22): 9717. https://doi.org/10.3390/su12229717
[4] Kaloop, M.R., El-Badawy, S.M., Ahn, J., Sim, H.B., Hu, J.W., Abd El-Hakim, R.T. (2022). A hybrid wavelet-optimally-pruned extreme learning machine model for the estimation of international roughness index of rigid pavements. International Journal of Pavement Engineering, 23(3): 862-876. https://doi.org/10.1080/10298436.2020.1776281
[5] Park, K., Thomas, N.E., Wayne Lee, K.J.J.O.T.E. (2007). Applicability of the international roughness index as a predictor of asphalt pavement condition. Journal of Transportation Engineering, 133(12): 706-709. https://doi.org/10.1061/(ASCE)0733-947X(2007)133:12(706)
[6] Wang, T., Harvey, J., Lea, J., Kim, C. (2014). Impact of pavement roughness on vehicle free-flow speed. Journal of Transportation Engineering, 140(9): 04014039. https://doi.org/10.1061/(ASCE)TE.1943-5436.0000689
[7] Tehrani, S.S., Falls, L.C., Mesher, D. (2015). Road users’ perception of roughness and the corresponding IRI threshold values. Canadian Journal of Civil Engineering, 42(4): 233-240. https://doi.org/10.1139/cjce-2014-0344
[8] Kırbaş, U. (2018). IRI sensitivity to the influence of surface distress on flexible pavements. Coatings, 8(8): 271. https://doi.org/10.3390/coatings8080271
[9] Chen, S.L., Lin, C.H., Tang, C.W., Chu, L.P., Cheng, C.K. (2020). Research on the international roughness index threshold of road rehabilitation in metropolitan areas: A case study in Taipei city. Sustainability, 12(24): 10536. https://doi.org/10.3390/su122410536
[10] Abdelaziz, N., Abd El-Hakim, R.T., El-Badawy, S.M., Afify, H.A. (2020). International roughness index prediction model for flexible pavements. International Journal of Pavement Engineering, 21(1): 88-99. https://doi.org/10.1080/10298436.2018.1441414
[11] Hossain, M.I., Gopisetti, L.S.P., Miah, M.S. (2019). International roughness index prediction of flexible pavements using neural networks. Journal of Transportation Engineering, Part B: Pavements, 145(1): 04018058. https://doi.org/10.1061/JPEODX.0000088
[12] Li, J., Zhang, Z., Wang, W. (2018). International roughness index and a new solution for its calculation. Journal of Transportation Engineering, Part B: Pavements, 144(2): 06018002. https://doi.org/10.1061/JPEODX.0000052
[13] Moffatt, M. (2007). Guide to asset management. Part 5B: Roughness. No. AGAM05B/07. Sydney-Australia.
[14] Transportation. A. (2015). Annual report 2014-2015. Alberta.
[15] Department of Public Works and Highways. (2016). Amendment to department order No. 47, Series of 2015 Re: Adoption of International Roughness Index Values for all National Primary Roads, 23.
[16] Minister of Public Works and Public Housing of the Republic of Indonesia. (2014). Regulation of the minister of public works of the republic of indonesia No. 16 concerning toll road minimum service standards (SPM). Indonesia.
[17] Múčka, P. (2017). International roughness index specifications around the world. Road Materials and Pavement Design, 18(4): 929-965. https://doi.org/10.1080/14680629.2016.1197144
[18] Elhadidy, A.A., El-Badawy, S.M., Elbeltagi, E.E. (2021). A simplified pavement condition index regression model for pavement evaluation. International Journal of Pavement Engineering, 22(5): 643-652. https://doi.org/10.1080/10298436.2019.1633579
[19] Terzi, S. (2013). Modeling for pavement roughness using the ANFIS approach. Advances in Engineering Software, 57: 59-64. https://doi.org/10.1016/j.advengsoft.2012.11.013
[20] Sayers, M.W. (1986). Guidelines for conducting and calibrating road roughness measurements. University of Michigan, Ann Arbor, Transportation Research Institute.
[21] Sayers, M.W. (1995). On the calculation of international roughness index from longitudinal road profile. Transportation Research Record, 1501: 1-12.
[22] Sollazzo, G., Fwa, T.F., Bosurgi, G. (2017). An ANN model to correlate roughness and structural performance in asphalt pavements. Construction and Building Materials, 134: 684-693. https://doi.org/10.1016/j.conbuildmat.2016.12.186
[23] Chandra, S., Sekhar, C.R., Bharti, A.K., Kangadurai, B. (2013). Relationship between pavement roughness and distress parameters for Indian highways. Journal of Transportation Engineering, 139(5): 467-475. https://doi.org/10.1061/(ASCE)TE.1943-5436.0000512
[24] Wang, K.C., Li, Q. (2011). Pavement smoothness prediction based on fuzzy and gray theories. Computer‐Aided Civil and Infrastructure Engineering, 26(1): 69-76. https://doi.org/10.1111/j.1467-8667.2009.00639.x
[25] Park, K., Thomas, N.E., Wayne Lee, K.J.J.O.T.E. (2007). Applicability of the international roughness index as a predictor of asphalt pavement condition. Journal of Transportation Engineering, 133(12): 706-709. https://doi.org/10.1061/(ASCE)0733-947X(2007)133:12(706)
[26] Alatoom, Y.I., Obaidat, T.I. (2021). Measurement of street pavement roughness in urban areas using smartphone. International Journal of Pavement Research and Technology, 1-18. https://doi.org/10.1007/s42947-021-00069-3
[27] Joni, H.H., Hilal, M.M., Abed, M.S. (2020). Developing international roughness index (IRI) model from visible pavement distresses. In IOP Conference Series: Materials Science and Engineering. IOP Publishing, 737(1): 012119. https://doi.org/10.1088/1757-899X/737/1/012119
[28] Colicchia, C., Strozzi, F. (2012). Supply chain risk management: A new methodology for a systematic literature review. Supply Chain Management: An International Journal, 17(4): 403-418. https://doi.org/10.1108/13598541211246558
[29] Khitous, F., Strozzi, F., Urbinati, A., Alberti, F. (2020). A systematic literature network analysis of existing themes and emerging research trends in circular economy. Sustainability, 12(4): 1633. https://doi.org/10.3390/su12041633
[30] Wang, C., Xu, S., Yang, J. (2021). Adaboost algorithm in artificial intelligence for optimizing the IRI prediction accuracy of asphalt concrete pavement. Sensors, 21(17): 5682. https://doi.org/10.3390/s21175682
[31] Naguib, A.M., EL-Badawy, S.M., Ibrahim, M.H. (2020). International roughness index predictive model for rigid pavements based on LTPP data. MEJ. Mansoura Engineering Journal, 40(2): 30-38. https://doi.org/10.21608/bfemu.2020.101239
[32] Ziari, H., Sobhani, J., Ayoubinejad, J., Hartmann, T. (2016). Prediction of IRI in short and long terms for flexible pavements: ANN and GMDH methods. International Journal of Pavement Engineering, 17(9): 776-788. https://doi.org/10.1080/10298436.2015.1019498
[33] ARA. (2001). Final document appendix PP: Smoothness prediction for rigid pavements. In Guide for Mechanistic-Empirical Design of New and Rehabilitated Pavement Structures (p. August). Champaign, Illinois: NCHRP.
[34] Pembuain, A., Priyanto, S., Suparma, L.B. (2018). Evaluasi kemantapan permukaan jalan berdasarkan international roughness index pada 14 ruas jalan di kota yogyakarta. Jurnal Teknik, 39(2): 126-13. https://doi.org/10.14710/teknik.v39n2.21459
[35] Al-Suleiman, T.I., Shiyab, A.M. (2003). Prediction of pavement remaining service life using roughness data-case study in Dubai. International Journal of Pavement Engineering, 4(2): 121-129. https://doi.org/10.1080/10298430310001634834
[36] Plati, C., Georgiou, P., Papavasiliou, V. (2016). Simulating pavement structural condition using artificial neural networks. Structure and Infrastructure Engineering, 12(9): 1127-1136. https://doi.org/10.1080/15732479.2015.1086384
[37] Terzi, S. (2013). Modeling for pavement roughness using the ANFIS approach. Advances in Engineering Software, 57: 59-64. https://doi.org/10.1016/j.advengsoft.2012.11.013
[38] Heidari, M.R., Heravi, G., Esmaeeli, A.N. (2020). Integrating life-cycle assessment and life-cycle cost analysis to select sustainable pavement: A probabilistic model using managerial flexibilities. Journal of Cleaner Production, 254: 120046. https://doi.org/10.1016/j.jclepro.2020.120046
[39] Pérez-Acebo, H., Linares-Unamunzaga, A., Rojí, E., Gonzalo-Orden, H. (2020). IRI performance models for flexible pavements in two-lane roads until first maintenance and/or rehabilitation work. Coatings, 10(2): 97. https://doi.org/10.3390/coatings10020097
[40] Bueno, L.D., Pereira, D.D.S., Specht, L.P., Nascimento, L.A.H.D., Schuster, S.L., Fritzen, M.A., Kim, Y.R., Back, A.H. (2022). Contribution to the mechanistic-empirical roughness prediction in asphalt pavements. Road Materials and Pavement Design, 1-16. https://doi.org/10.1080/14680629.2022.2029758
[41] Piryonesi, S.M., El-Diraby, T.E. (2021). Examining the relationship between two road performance indicators: Pavement condition index and international roughness index. Transportation Geotechnics, 26: 100441. https://doi.org/10.1016/j.trgeo.2020.100441
[42] Adeli, S., Najafi moghaddam Gilani, V., Kashani Novin, M., Motesharei, E., Salehfard, R. (2021). Development of a relationship between pavement condition index and international roughness index in rural road network. Advances in Civil Engineering, 2021: 1-9. https://doi.org/10.1155/2021/6635820
[43] Madeh Piryonesi, S., El-Diraby, T.E. (2021). Using machine learning to examine impact of type of performance indicator on flexible pavement deterioration modeling. Journal of Infrastructure Systems, 27(2): 04021005. https://doi.org/10.1061/(ASCE)IS.1943-555X.0000602
[44] Li, W., Huyan, J., Xiao, L., Tighe, S., Pei, L. (2019). International roughness index prediction based on multigranularity fuzzy time series and particle swarm optimization. Expert Systems with Applications, X(2): 100006. https://doi.org/10.1016/j.eswax.2019.100006
[45] De Luca, M. (2020). Evaluation of runway bearing capacity using international roughness index. Transportation Research Procedia, 45: 119-126. https://doi.org/10.1016/j.trpro.2020.02.096
[46] Damirchilo, F., Hosseini, A., Mellat Parast, M., Fini, E.H. (2021). Machine learning approach to predict international roughness index using long-term pavement performance data. Journal of Transportation Engineering, Part B: Pavements, 147(4): 04021058. https://doi.org/10.1061/JPEODX.0000312
[47] Nurhadiansyah, R., Hadiana, A. (2019). Toll road roughness index forecasting with combination grey forecasting model and similarity spatial data. In IOP Conference Series: Materials Science and Engineering, 662(2): 022065. https://doi.org/10.1088/1757-899X/662/2/022065
[48] Chen, S.L., Lin, C., Tang, C.W., Hsieh, H.A. (2022). Evaluation of pavement roughness by the international roughness index for sustainable pavement construction in new taipei city. Sustainability, 14(12): 6982. https://doi.org/10.3390/su14126982
[49] Perera, R.W., Al-Rawashdeh, A.S. (2017). Investigation of increase in roughness due to environmental factors in flexible pavements using profile data from long-term pavement performance specific pavement studies 1 experiment (No. FHWA-HRT-17-049). United States. Federal Highway Administration.
[50] Cruz, O.G.D., Mendoza, C.A., Lopez, K.D. (2021). International roughness index as road performance indicator: a literature review. In IOP Conference Series: Earth and Environmental Science, 822(1): 012016. https://doi.org/10.1088/1755-1315/822/1/012016
[51] Zeng, F., Lee, S.H.N., Lo, C.K.Y. (2020). The role of information systems in the sustainable development of enterprises: A systematic literature network analysis. Sustainability, 12(8): 3337. https://doi.org/10.3390/su12083337
[52] Fagundes, M.V.C., Teles, E.O., Vieira de Melo, S.A., Freires, F.G.M. (2020). Supply chain risk management modelling: A systematic literature network analysis review. IMA Journal of Management Mathematics, 31(4): 387-416. https://doi.org/10.1093/imaman/dpaa019
[53] Bamel, U.K., Pandey, R., Gupta, A. (2020). Safety climate: Systematic literature network analysis of 38 years (1980-2018) of research. Accident Analysis & Prevention, 135: 105387. https://doi.org/10.1016/j.aap.2019.105387
[54] Colicchia, C., Creazza, A., Noè, C., Strozzi, F. (2019). Information sharing in supply chains: A review of risks and opportunities using the systematic literature network analysis (SLNA). Supply Chain Management: An International Journal, 24(1): 5-21. https://doi.org/10.1108/SCM-01-2018-0003
[55] Ben Rjab, A., Mellouli, S. (2019). Artificial intelligence in smart cities: Systematic literature network analysis. In Proceedings of the 12th International Conference on Theory and Practice of Electronic Governance, pp. 259-269. https://doi.org/10.1145/3326365.3326400
[56] Strozzi, F., Colicchia, C., Creazza, A., Noè, C. (2017). Literature review on the ‘Smart Factory’concept using bibliometric tools. International Journal of Production Research, 55(22): 6572-6591. https://doi.org/10.1080/00207543.2017.1326643
[57] Ng, J.J., Chai, K.H. (2015). A bibliometric analysis of project management research. In 2015 IEEE International Conference on Industrial Engineering and Engineering Management (IEEM), pp. 976-980. https://doi.org/10.1109/IEEM.2015.7385794
[58] Zupic, I., Čater, T. (2015). Bibliometric methods in management and organization. Organizational Research Methods, 18(3): 429-472. https://doi.org/10.1177/1094428114562629
[59] Feng, Y., Zhu, Q., Lai, K.H. (2017). Corporate social responsibility for supply chain management: A literature review and bibliometric analysis. Journal of Cleaner Production, 158: 296-307. https://doi.org/10.1016/j.jclepro.2017.05.018
[60] Rey-Martí, A., Ribeiro-Soriano, D., Palacios-Marqués, D. (2016). A bibliometric analysis of social entrepreneurship. Journal of Business Research, 69(5): 1651-1655. https://doi.org/10.1016/j.jbusres.2015.10.033
[61] Fahimnia, B., Sarkis, J., Davarzani, H. (2015). Green supply chain management: A review and bibliometric analysis. International Journal of Production Economics, 162: 101-114. https://doi.org/10.1016/j.ijpe.2015.01.003
[62] Bramer, W.M., De Jonge, G.B., Rethlefsen, M.L., Mast, F., Kleijnen, J. (2018). A systematic approach to searching: An efficient and complete method to develop literature searches. Journal of the Medical Library Association: JMLA, 106(4): 531-541. https://doi.org/10.5195%2Fjmla.2018.283
[63] Gusenbauer, M., Haddaway, N.R. (2020). Which academic search systems are suitable for systematic reviews or meta‐analyses? Evaluating retrieval qualities of google scholar, pubmed, and 26 other resources. Research Synthesis Methods, 11(2): 181-217. https://doi.org/10.1002/jrsm.1378
[64] Van Eck, N.J., Waltman, L. (2013). VOSviewer manual. Leiden: Univeristeit Leiden, 1(1): 1-53.
[65] Westby, C. (2021). Resource review. Word Mouth, 32(5): 10-12. https://doi.org/10.1177/10483950211008345b
[66] Moral-Muñoz, J.A., Herrera-Viedma, E., Santisteban-Espejo, A., Cobo, M.J. (2020). Software tools for conducting bibliometric analysis in science: An up-to-date review. Profesional de la Información, 29(1). https://doi.org/10.3145/epi.2020.ene.03
[67] Aria, M., Cuccurullo, C. (2017). Bibliometrix: An R-tool for comprehensive science mapping analysis. Journal of Informetrics, 11(4): 959-975. https://doi.org/10.1016/j.joi.2017.08.007
[68] Zeng, R., Chini, A. (2017). A review of research on embodied energy of buildings using bibliometric analysis. Energy and Buildings, 155: 172-184. https://doi.org/10.1016/j.enbuild.2017.09.025
[69] Van Nunen, K., Li, J., Reniers, G., Ponnet, K. (2018). Bibliometric analysis of safety culture research. Safety Science, 108: 248-258. https://doi.org/10.1016/j.ssci.2017.08.011
[70] Rodrigues, S.P., Van Eck, N.J., Waltman, L., Jansen, F.W. (2014). Mapping patient safety: A large-scale literature review using bibliometric visualisation techniques. BMJ Open, 4(3): e004468. https://doi.org/10.1136/bmjopen-2013-004468
[71] Agbo, F.J., Oyelere, S.S., Suhonen, J., Tukiainen, M. (2021). Scientific production and thematic breakthroughs in smart learning environments: A bibliometric analysis. Smart Learning Environments, 8(1): 1-25. https://doi.org/10.1186/s40561-020-00145-4
[72] Khan, G.F., Wood, J. (2015). Information technology management domain: Emerging themes and keyword analysis. Scientometrics, 105: 959-972. https://doi.org/10.1007/s11192-015-1712-5
[73] Van Eck, N., Waltman, L. (2010). Software survey: VOSviewer, a computer program for bibliometric mapping. Scientometrics, 84(2): 523-538. https://doi.org/10.1007/s11192-009-0146-3
[74] Sun, X., Wang, H., Mei, S. (2023). Highway performance prediction model of international roughness index based on panel data analysis in subtropical monsoon climate. Construction and Building Materials, 366: 130232. https://doi.org/10.1016/j.conbuildmat.2022.130232
[75] Gu, Z., Meng, F., Farrukh, M. (2021). Mapping the research on knowledge transfer: A scientometrics approach. IEEE Access, 9: 34647-34659. https://doi.org/10.1109/ACCESS.2021.3061576
[76] Jain, R., Oh, C.H., Shapiro, D. (2022). A bibliometric analysis and future research opportunities in multinational business review. Multinational Business Review, (Ahead-of-Print), 30(3): 313–342. https://doi.org/10.1108/MBR-01-2022-0001
[77] Yin, H., Zhang, F., Yang, X., Meng, X., Miao, Y., Noor Hussain, M.S., Yang, L., Li, Z. (2022). Research trends of artificial intelligence in pancreatic cancer: A bibliometric analysis. Frontiers in Oncology, 12: 973999. https://doi.org/10.3389/fonc.2022.973999
[78] Múčka, P. (2017). Simulated road profiles according to ISO 8608 in vibration analysis. Journal of Testing and Evaluation, 46(1): 405-418. https://doi.org/10.1520/JTE20140493
[79] Múčka, P. (2017). Road roughness limit values based on measured vehicle vibration. Journal of Infrastructure Systems, 23(2): 04016029. https://doi.org/10.1061/(ASCE)IS.1943-555X.0000325
[80] Múčka, P. (2016). Current approaches to quantify the longitudinal road roughness. International Journal of Pavement Engineering, 17(8): 659-679. https://doi.org/10.1080/10298436.2015.1011782
[81] Mucka, P. (2004). Road waviness and the dynamic tyre force. International Journal of Vehicle Design, 36(2-3): 216-232. https://doi.org/10.1504/IJVD.2004.005357
[82] Hossain, M., Gopisetti, L.S.P., Miah, M.S. (2020). Artificial neural network modelling to predict international roughness index of rigid pavements. International Journal of Pavement Research and Technology, 13: 229-239. https://doi.org/10.1007/s42947-020-0178-x
[83] Hossain, M.I., Gopisetti, L.S.P., Miah, M.S. (2017). Prediction of international roughness index of flexible pavements from climate and traffic data using artificial neural network modeling. In Airfield and highway pavements 2017, pp. 256-267.
[84] Huang, B., Mohammad, L.N., Graves, P.S., Abadie, C. (2002). Louisiana experience with crumb rubber-modified hot-mix asphalt pavement. Transportation Research Record, 1789(1): 1-13. https://doi.org/10.3141/1789-01
[85] Gong, H., Sun, Y., Shu, X., Huang, B. (2018). Use of random forests regression for predicting IRI of asphalt pavements. Construction and Building Materials, 189: 890-897. https://doi.org/10.1016/j.conbuildmat.2018.09.017
[86] Dong, Q., Huang, B. (2012). Evaluation of effectiveness and cost-effectiveness of asphalt pavement rehabilitations utilizing LTPP data. Journal of Transportation Engineering, 138(6): 681-689. https://doi.org/10.1061/(ASCE)TE.1943-5436.0000378
[87] Kropáč, O., Múčka, P. (2005). Be careful when using the international roughness index as an indicator of road unevenness. Journal of Sound and Vibration, 287(4-5): 989-1003. https://doi.org/10.1016/j.jsv.2005.02.015
[88] Kropac, O., Mucka, P. (2008). Indicators of longitudinal unevenness of roads in the USA. International Journal of Vehicle Design, 46(4): 393-415. https://doi.org/10.1504/IJVD.2008.020306
[89] Kropac, O., Mucka, P. (2004). Non-standard longitudinal profiles of roads and indicators for their characterisation. International Journal of Vehicle Design, 36(2-3): 149-172. https://doi.org/10.1504/IJVD.2004.005354
[90] Rana, S. (2021). Vibration based pavement roughness monitoring system using vehicle dynamics and smartphone with estimated vehicle parameters. Results in Engineering, 12: 100294. https://doi.org/10.1016/j.rineng.2021.100294
[91] Sime, M., Bailey, G., Hajj, E.Y., Chkaiban, R. (2021). Impact of pavement roughness on fuel consumption for a range of vehicle types. Journal of Transportation Engineering, Part B: Pavements, 147(3): 04021022. https://doi.org/10.1061/JPEODX.0000272
[92] Mataei, B., Nejad, F.M., Zakeri, H. (2021). Pavement maintenance and rehabilitation optimization based on cloud decision tree. International Journal of Pavement Research and Technology, 14: 740-750. https://doi.org/10.1007/s42947-020-0306-7
[93] Zhang, M., Gong, H., Xiao, R., Jiang, X., Ma, Y., Huang, B. (2023). Life-cycle cost analysis of rehabilitation strategies for asphalt pavements based on probabilistic models. Road Materials and Pavement Design, 24(1): 121-137. https://doi.org/10.1080/14680629.2021.2012235
[94] Genser, A., Spielhofer, R., Nitsche, P., Kouvelas, A. (2022). Ride comfort assessment for automated vehicles utilizing a road surface model and monte carlo simulations. Computer‐Aided Civil and Infrastructure Engineering, 37(10): 1316-1334. https://doi.org/10.1111/mice.12787
[95] Van Eck, N.J., Waltman, L., van Raan, A.F., Klautz, R.J., Peul, W.C. (2013). Citation analysis may severely underestimate the impact of clinical research as compared to basic research. PloS One, 8(4): e62395. https://doi.org/10.1371/journal.pone.0062395
[96] Alatoom, Y.I., Obaidat, T.I. (2021). Measurement of street pavement roughness in urban areas using smartphone. International Journal of Pavement Research and Technology, 1-18. https://doi.org/10.1007/s42947-021-00069-3
[97] Marcelino, P., de Lurdes Antunes, M., Fortunato, E., Gomes, M.C. (2021). Machine learning approach for pavement performance prediction. International Journal of Pavement Engineering, 22(3): 341-354. https://doi.org/10.1080/10298436.2019.1609673
[98] Gharieb, M., Nishikawa, T., Nakamura, S., Thepvongsa, K. (2022). Modeling of pavement roughness utilizing artificial neural network approach for Laos national road network. Journal of Civil Engineering and Management, 28(4): 261-277. https://doi.org/10.3846/jcem.2022.15851
[99] Kayadelen, C., Önal, Y., Altay, G., Öztürk, M., Serin, S. (2022). Effects of maintenance, traffic and climate condition on international roughness index of flexible pavement. International Journal of Pavement Engineering, 1-13. https://doi.org/10.1080/10298436.2022.2038382
[100] Hong, F., Prozzi, J.A. (2018). Evaluation of recycled asphalt pavement using economic, environmental, and energy metrics based on long-term pavement performance sections. Road Materials and Pavement Design, 19(8): 1816-1831. https://doi.org/10.1080/14680629.2017.1348306
[101] Perera, R.W., Kohn, S.D. (2002). Issues in pavement smoothness: A summary report, national cooperative highway research program. Transportation Research Board, National Research Council, March.
[102] Robbins, M.M., Tran, N.H. (2016). A synthesis report: Value of pavement smoothness and ride quality to roadway users and the impact of pavement roughness on vehicle operating costs. National Center for Asphalt Technology (NCAT) at Auburn University, NCAT Report, 16-03.