Hery Suyanto | Aulia M.T. Nasution* | Ni Luh Putu Trisnawati | Iryanti Eka Suprihatin
© 2022 IIETA. This article is published by IIETA and is licensed under the CC BY 4.0 license (http://creativecommons.org/licenses/by/4.0/).
OPEN ACCESS
Laser-Induced Breakdown Spectroscopy (LIBS) is a spectroscopy-based measurement technique that is capable of rapid and accurate qualitative, as well as quantitative, analysis of elemental ingredients either in solid (either for organic or inorganic compounds), liquid, or gaseous samples. Unfortunately, this is not the case for powdered samples, where the focused laser beam will disperse the powder. This can be overcome by making the powder into pellets. But it has an inherent drawback, i.e., the minimum amount of powder is about 0.2 g to obtain a good detectable signal. To cope with this unfavorable condition, especially for the amount of powder less than 0.1 mg, we proposed a sub-target deposition method to make the pellets in this reported work. Using this method, the analyzed powder was deposited into an indented hole on a pellet substrate of KBr with the following optimum conditions, i.e., pellet's pressing pressure of 400 kPa, laser energy of 120 mJ, and a sample's heating temperature of 70℃. Microanalyses of standard powdered samples of PbO, CuO, and ZnO have been carried out with estimated detection limits of 4.7 μg, 4.6 μg, and 3.9 μg, respectively. So, this method can be used to analyze small amounts (in the microgram range) of powdered samples.
microanalysis, powdered samples, deposition-pellet preparation technique, laser-induced breakdown spectroscopy (libs), detection limit
Laser-induced Breakdown spectroscopy (LIBS) offers several advantages, i.e., it can be implemented rapidly and accurately on solid and gas samples without any sample preparation and can be categorized as a non-contact measurement technique. Unfortunately, it cannot be implemented directly onto powdered samples since the focused laser will disperse the powder, which will cause different located focal points among subsequent laser pulses. The dispersed powder that is caused by one pulse will absorb the next coming pulse and will lead to fluctuations in the laser's density used for ablating the samples [1]. Variation in density of laser irradiation will decrease the measurement's reproducibility, i.e., increase the value of relative standard deviation (RSTD) of the LIBS data [2-4] and will deteriorate the limit of detection (LOD) of powdered samples measurement in comparison to that of solid and gaseous samples.
Several methods have been tried by many researchers in order to increase the performance of the LIBS technique in analyzing powdered samples, one of which is by making the powder in pellet form [5, 6]. To improve the reproducibility of LIBS data, they varied several parameters required for making the pellets, i.e. pressing pressure, size of powder, using binding agents, as well as the ones for measurements, i.e. varying the pellet's temperature and laser focal points before analyzing [7-9]. However, this method has a disadvantage in that it requires a sufficient amount of powder, which is on the order of a gram (0.4 g). Hence, for very small amounts of samples, i.e., in the range of milli-to-microgram, it is very difficult to implement this method. Thus, this method is not suitable for expensive powdered samples as well as for cases where there is a very limited quantity of samples available for analysis. Additionally, this method is not suitable for those that are reactive to air, such as CrO powder.
Meanwhile, another group of researchers performed LIBS analysis on powdered samples without converting them to pellets [10, 11]. To avoid the dispersion of powder samples during laser irradiation, they fabricated a specific holder, which was called the confinement plasma. A small hole of diameter 3 mm with a depth of 13 mm was made for holding the powder samples for further irradiation (11). Even if the spectra and its calibration curve are good enough, it still requires a sufficient quantity of powder, i.e., about 0.3 grams.
Another effort to reduce the amount of required powder sample for direct analysis has been reported by another group of researchers, i.e., employing the sub-target method [12-17]. In this method, the powder sample should be priorly smoothened into a particle size of around 20–30 mm. This size range is the one that is suitable for making a thin film [12, 13], but it becomes difficult when we have an insufficient amount of powder, and it is impossible to reuse the damaged sample for further inspection. Then 1 mg of smoothened powder sample is mixed with binding agents, such as high vacuum silicone grease [14] or oil [15], before being deposited onto a sub-target material.
For a large number of powder samples, the researcher employed sub-target supported by micro mesh as a powder sample holder [16, 17]. The use of a micro-mesh supported sub-target as a holder was intended to provide a greater recoil effect when the focused laser beam reached the sample. In LIBS, as the focused laser beam impinges onto the sample, it will generate a laser-induced shock wave. The stronger the binding of the target atoms, the stronger the recoil force will be. This will eventually lead to the more intense shock-wave generated. This more intense shock-wave will excite more atoms, allowing for greater intensity to be acquired for analysis [16, 17]. In addition, the measurement needs to be performed under environmental pressure condition of 0.65 kPa.
The proposed technique reported in this work has almost a similar aim to the use of micro-mesh supported sub-target, i.e., to provide a stronger recoil effect from the deposited powder sample, but with the uniqueness that much less powder sample is required, i.e., less than 0.1 mg. When the micro-mesh supported sub-target is used, it is not possible to analyze such a small number of powder samples to provide a sufficiently low limit of detection. Additionally, using the proposed preparation technique, the measurement can still being performed under normal atmospheric condition.
2.1 Sample preparation
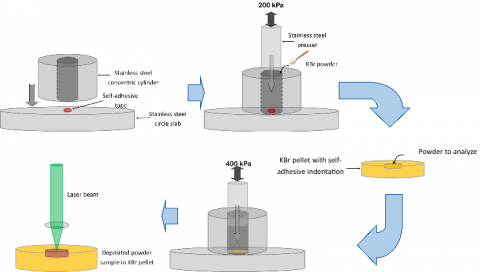
The steps of the procedure for sample preparation are sketched in Figure 1, with the sequence as indicated by the arrow. Firstly, an encircled self-adhesive tape (thickness of 0.01 mm and a diameter of about 2 mm) was attached onto the stainless-steel circle slab, and then the stainless-steel concentric cylinder was laid down onto the slab, with its inner diameter encircled the tape. Then 0.4 g of KBr powder was poured into the holder, followed by pressing the stainless-steel presser with a pressure of 200 kPa to solidify and mold the powder, which, in turn, acts as the matrix binding agent for the powder sample that will be analyzed [9]. The formed KBr pellet was then turned upside down, with the small circle indentation made from the self-adhesive tape facing up. The powder to be analyzed was then poured into this indentation hole and pressed with a pressure of 400 kPa to evenly deposit the powder into the indented hole. Using this technique, the powder will be well deposited into the indented hole on the KBr pellet. The deposited analyzed powder was then ready for LIBS measurement.
Figure 1. Steps of sample preparation
2.2 Experimental set-up
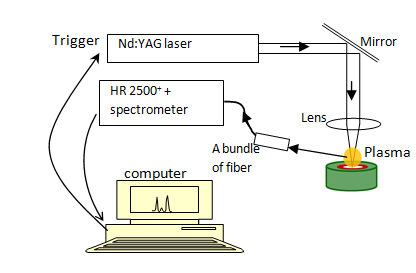
The experimental set-up used in this work is depicted in Figure 2 as follow.
Figure 2. Experimental setup
The commercial LIBS system consists of components of camera with a magnification of 150 for monitoring the investigation chamber, Nd:YAG laser, and an Ocean Optics HR 2500+ spectrometer. This system is also equipped with the OOILIBS for controlling the acquisition process and with the AddLIBS software [18] for analyzing the resulted spectra data. Parameters used in the experiments can be given in Table 1.
Table 1. Setting parameters of LIBS system’s components used in the experiments
|
Components |
Setting parameters |
|
Nd: YAG laser |
$\lambda_{\text {excitation }}$: 1064 nm frequency: 10 Hz pulse width: 7 ns energy per pulse: 80 mJ, 100 mJ, 120 mJ, 140 mJ, and 160 mJ |
|
HR 2500+ spectrometer |
number of pixels: 14,336 Sensitivity region: 200 – 890 nm Number of averaging: 4 shots Delay time before acquisition: 0.5 ms |
The diameter of Nd:YAG laser used was 2 mm, and this beam was then focused through a 10 cm focal length biconvex lens to provide focused beam with diameter of 100 mm onto the deposited powder sample. This focused laser beam will provide energy density of 200 times higher than the unfocused one. Such an intense laser beam is required to generate plasma from the deposited powder sample. The resulted emission radiation from the generated plasma was then captured by the optical multichannel analyzer of the spectrometer HR 2500+.
2.3 Experimental procedure
In order to obtain good measurement results, the following experimental design was used: Firstly, determining the best parameters for preparing the sample (i.e., applying pressure for depositing the powder onto the KBr pellet and heating temperature), and secondly, determining the experiment's optimum acquisition parameters. The powder samples used in this experiment were standard powders of PbO, CuO, and ZnO.
In the first step, the standard powdered samples were subjected to a variation of applied pressure in order to be evenly and firmly deposited onto the KBr pellet. The pressure variations applied were 200, 300, 400, 500, and 600 kPa. It was then followed by the variation of heating temperatures of 30, 40, 50, 60, 70, 80, and 90℃. After preparation, samples were ready for LIBS measurements using various laser energies per pulse of 80 mJ, 100 mJ, 120 mJ, 140 mJ, and 160 mJ. For each of the variation combinations, the microanalysis (a.k.a. quantitative powdered sample analysis) was carried out to determine the lowest amount of powder sample detectable by this method.
3.1 Determination of optimum applied pressure and laser energy
Optimum experimental conditions, i.e., the optimum pressure in making pellet as a sub-target material, deposition temperature, as well as laser energy, need to be achieved before performing micro analysis of the powder samples. Each pellet is made of 0.4 gram of KBr powder under different pressure variations, followed by depositing the analyzed powder under different applied pressures and heating temperatures. Each of the analyzed powders deposited onto the pellet was then irradiated using laser energy of 80 mJ, 100 mJ, 120 mJ, 140 mJ, and 160 mJ to produce plasmas of electrons, molecules, neutral atoms, ions, and excited atoms [19-21].
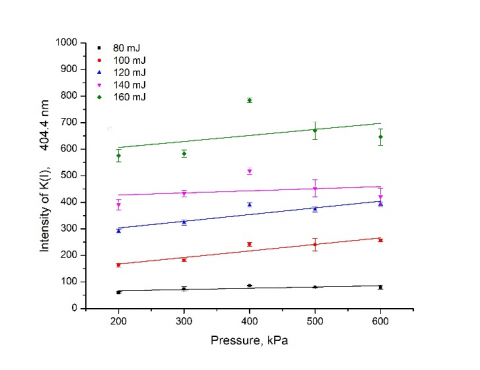
As excited electrons from potassium atoms undergo transition from higher energy levels into ground states, a photon K(I) at a wavelength of 404.4 nm is emitted [22]. This photon emission is captured by a spectrometer and plotted as a graphic of intensity vs applied pressure for each of the five laser-energy used, as depicted in Figure 3. This graph shows that the emission intensity increases proportionally to the increase of both laser energy and applied deposition pressure (up to 400 kPa). Meanwhile, the larger the applied pressure, the emission intensity shows a decreasing trend for all the laser energy used. Based on these results, the optimum applied pressure of 200 kPa for pellet holder preparation and of 400 kPa for deposition of the analyzed samples onto the sub-target material were chosen. The use of lower applied molding pressure was aimed to avoid the occurrence of matrix effects on the KBr pellet as a binder material, a perfect condition required as a binding material. Meanwhile, the use of laser energy per pulse of 100 and 120 mJ shows a better linearity in comparison to other energies for all applied pellet pressures, as indicated by the R-square (COD) of the linear fitting from the measured data, i.e. 0.877 and 0.730, respectively.
Figure 3. Emission intensity of neutral potassium K(I) as function of laser energy and pressure on KBr pellet
3.2 Determination of optimum sample deposition temperatures
Most analysis using the LIBS technique requires compact targets, which are determined by many parameters. Among others are the physical and chemical characteristics of the sample material, laser parameters, and the surrounding atmosphere [23-25]. To get an accurate analysis of powder samples, homogeneity is an important factor, in addition to good mechanical strength for LIBS analysis, since strong shockwaves during laser ablation may disintegrate the sample [26]. The plasma’s emission intensity from a powder sample in the pellet form is determined by the strong binding force among powder particles to withstand the sample's disintegration during the ablation, which will increase the analytical stability of the samples. Additionally, the uniformity of binding force throughout the pellet is also necessary for the measurements using the LIBS technique [9]. To achieve the above requirements, special attention needs to be implemented during their pelletizing process. Applied pressure, in addition to temperature, is among the determining variables required to be fixed during the pelletizing process [1, 27-29] to obtain pellets of microgram powder samples suitable for LIBS analysis as mentioned previously.
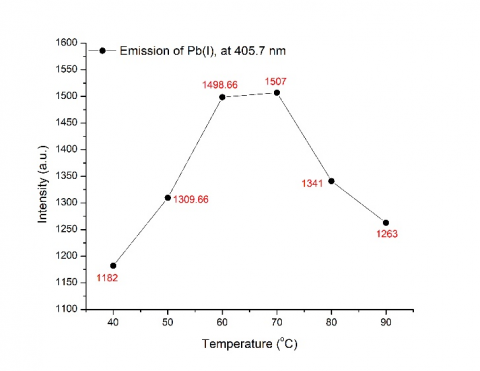
To observe this effect, 1 mg of PbO powder is deposited onto each of the sub-targets of KBr pellets and heated under different deposition temperatures of 30, 40, 50, 60, 70, 80, and 90 °C for 10 minutes. These deposited PbO powders were then irradiated under a laser energy of 120 mJ to create plasmas. The emission intensity of neutral atoms of Pb (I) at a wavelength of 405.7 nm [22] in the plasmas is captured by a spectrometer and plotted as a function of temperature, as shown in Figure 4.
Figure 4. Emission intensity of neutral Pb(I) vs temperature
This intensity shows a steep increasing tendency as the temperature increases from 40℃ - 60℃, still continue to reach the highest at 70℃ but declines afterwards. It shows that increasing the pellet’s deposition temperature will tighten the molecular bonding among particles in the powder, which will induce a stronger recoil force as the laser beam is focused onto the sample surface. Meanwhile, at temperatures above 70℃, the molecular bonding in the PbO powder was predicted to loosen and eventually separate, resulting in the decreasing intensity trend. The phenomenon is almost similar to the "irreversible deformation" as described in [29]. That is why we chose to use 70℃ as the heating temperature during the deposition of analyzed powder onto the sub-target pellet.
3.3 Micro analysis results
The aim of micro analysis is to determine the minimum amount of powder in order to produce significant signals using this sub-target deposition pellet method and to determine its detection limit. The standard powders used in this research are standard PbO, ZnO, and CuO.
All samples were prepared using previously described steps, i.e., a pellet from 0.4 g of KBr powder, molded under an applied pressure of 200 kPa. Then varying amounts of PbO, CuO, and ZnO powders (i.e. 0.1 mg, 0.25 mg, 0.5 mg, and 1 mg) were each deposited onto the top surface of the KBr pellet and a deposition pressure of 400 kPa was applied. Then each of the samples was heated under 70℃ and finally irradiated using a laser with an energy of 120 mJ. After a 0.5 micro second (μs) delay, detection was performed, and the recorded spectra (average of three pulse measurements) are shown in Figures 5-7.
Figure 5A shows the emission intensity of neutral atoms of Pb (I) at a wavelength of 405.7 nm [22]. It can be observed that the highest intensity was achieved at 1 mg, and that it declined with the decreasing amount of deposited PbO. Meanwhile, the KBr pellet's sub-target material (i.e., without any PbO deposition) emits no Pb (shown as a dashed line). This means that KBr pellet sub-target material contains no Pb at all, hence the emission of neutral atoms of Pb (I) is solely originated from the analysed PbO powder. The figure also confirmed that the excitation of the limited amount of PbO, i.e., less than 0.25 mg, will cause the occurrence of neutral atoms of K (I) at a wavelength of 404.4 nm, which means that the laser irradiation has struck the substrate of KBr pellet. In order to determine the limit of detection (LOD), a graph of intensity values of Pb (I) at a wavelength of 405.7 nm (after substracted with background signals) was plotted against the mass of PbO powder, as can be seen in Figure 5B (inset graph). The curve in this figure shows a linear correlation between the mass of PbO powder and the emission intensity of Pb(I), and thus the limit of detection (LOD) can be calculated around 4.7 μg using method described in [19].
Figure 5. (A) Emission intensity spectra of neutral Plumbum Pb(I) for any PbO mass, (B) Calibration curve graph of Pb atomic mass deposited into KBr substrate
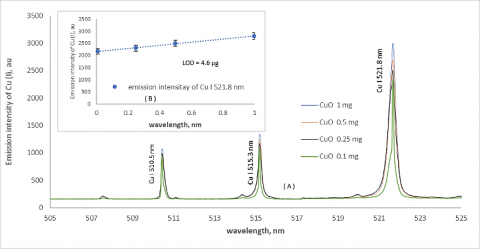
Meanwhile irradiating deposited CuO powder samples produced three emission peaks of neutral atom of Cu (I), i.e. at wavelengths of 510.5 nm, 515.3 nm, and 521.8 nm [22], as shown in Figure 6A. The intensity is decreasing with diminishing amount of deposited CuO powder. Since the emission line of Cu(I) at 521.8 nm has the highest emission probability, this line is used to predict the detection limit, as shown in Figure 6B. Inset graphs in Figure 6B shows linear correlation between the intensity of neutral atom Cu(I) at 521.8 nm and mass of deposited CuO powder. Hence the limit of detection of CuO powder is calculated to be around 4.6 µg using method described in [19].
Figure 6. Emission intensity spectra of neutral atom of Cu(I) for any CuO mass, (B) Calibration curve graph of Cu atomic mass deposited into KBr substrate
Lastly, the ZnO powder samples with varying amount after being irradiated produced specific three emission peaks of neutral atom of Zn (I) at wavelengths of 481.05 nm, 472.22 nm, and 468.01 nm [22], as shown in Figure 7A, and their intensities decline as diminishing amount of deposited ZnO powder onto the pellet. As shown in Figure 7B (inset graph), since the emission line of Zn (I) at 481.05 nm has the highest emission intensity, then this emission peak is used to predict the limit of detection. The LOD is then calculated to be around 3.9 µg.
Figure 7. (A) Emission intensity spectra of neutral atom of Zu(I) for any ZnO mass, (B) Calibration curve graph of Zn atomic mass deposited into KBr substrate
This paper has described a proposed technique to prepare the deposition-pellet for measurement of small quantities of powdered samples, i.e., less than 5 μg, as well as examining the influence of physical variables (i.e., temperature and pressure) on the stability of emission intensities. Based on the observed spectral measurement results, the limits of detection for the analyzed PbO, CuO, and ZnO powders are calculated to be 4.7 μg, 4.6 μg, and 3.9 μg, respectively.
This research was funded by the Ministry of Research, Technology, and Higher Education as well as the Institute of Research and Community Service (LPPM) Udayana University under the contract 492.6/UN 14.4.A/LT/2019. The authors would also like to thank MIPA Integrated Research Laboratory, Udayana University, for providing LIBS equipment.
[1] Singh, J.P., Thakur, S.N. (2007). LIBS Technique for Powder Materials. Laser-Induced Breakdown Spectroscopy, 1st Ed., Elsevier, 287-310.
[2] Wisburn, R., Schechter, I., Niessner, R., Schroeder, H., Kompa, K.L. (1994). Detector for trace elemental analysis of solid environmental samples by laser plasma spectroscopy. Analytical Chemistry, 66(18): 2964-2975. https://doi.org/10.1021/ac00090a026
[3] Fichet, P., Menut, D., Brennetot, R., Vors, E., Rivoallan, A. (2003). Analysis by laser-induced breakdown spectroscopy of complex solids, liquids, and powder with an echelle spectrometer. Applied Optics, 42(30): 6029-6035. https://doi.org/10.1364/ao.42.006029
[4] Martin, M.Z., Wullschleger, S.D., Garten, C.T., Palumbo, A.V. (2003), Laser-induced breakdown spectroscopy for the environmental determination of total carbon and nitrogen in soils. Applied Optics, 42(12): 2072-2077. https://doi.org/10.1364/AO.42.002072
[5] Mansoori, A., Roshanzadeh, B., Khalaji, M., Tavassoli, S.H. (2011). Quantitative analysis of cement powder by laser induced breakdown spectroscopy. Optics and Lasers in Engineering, 49(3): 318-323. https://doi.org/10.1016/j.optlaseng.2010.10.005
[6] Rosenwasser, S., Asimellis, G., Bromley, B., Hazlett, R., Pearce, Martin, T., Zigler, A. (2001). Development of a method for automated quantitative analysis of ores using LIBS. Spectrochimica Acta Part B: Atomic Spectroscopy, 56(6): 707-714. https://doi.org/10.1016/S0584-8547(01)00191-4
[7] Krasniker, R., Bulatov, V., Schechter, I. (2001). Study of matrix effects in laser plasma spectroscopy by shock wave propagation. Spectrochimica Acta Part B: Atomic Spectroscopy, 56(6): 609-618, https://doi.org/10.1016/S0584-8547(01)00194-X
[8] Lal, B., Zheng, H.B., Yueh, F.Y., Singh, J.P. (2004). Parametric study of pellets for elemental analysis with laser-induced breakdown spectroscopy. Appl. Opt., 43(13): 2792-2797. https://doi.org/10.1364/AO.43.002792
[9] Gondal, M.A., Hussain, T., Yamani, Z.H., Baig, M.A. (2007). The role of various binding materials for trace elemental analysis of powder sample using laser-induced breakdown spectroscopy. Talanta, 72(2): 462-469. https://doi.org/10.1016/j.talanta.2006.11.039
[10] Khumaeni, A., Ramli, M., Deguchi, Y., Lee, Y.I., Idris, N., Kurniawan, K.H., Lie, T.J., Kagawa, K. (2008). New technique for the direct analysis of food powders confined in a small hole using transversely excited atmospheric CO2 laser-induced gas plasma. Applied Spectroscopy, 62(12): 1344-1348. https://doi.org/10.1366/000370208786822151
[11] Suyanto, H., Kurniawan, H., Lie, T.J., Tjia, M.O., Kagawa, K. (2002). Application of laser plasma confinement and bending effects for direct analysis of powder sample. Spectrochimica Acta Part B: Atomic Spectroscopy, 57(8): 1325-1332, https://doi.org/10.1016/S0584-8547(02)00048-4
[12] Tian, Y., Chung, H.C., Zheng, R., Ma, Q.L., Chen, Y.P., Delepine-Gilon, N., Yu, J. (2016). Elemental analysis of powders with surface-assisted thin film laser-laser breakdown spectroscopy. Spectrochimica Acta Part B: Atomic Spectroscopy, 124: 16-24. https://doi.org/10.1016/j.sab.2016.08.016
[13] Hedwig, R., Setia Budi, W., Abdulmadjid, S.N., Pardede, M., Suliyanti, M.M., Lie, T.J., Kurniawan, D.P., Kurniawan, K.H., Kagawa, K., Tjia, M.O. (2006). Film analysis employing Subtarget effect using 355 nm Nd-YAG laser-induced plasma at low pressure. Spectrochimica Acta Part B: Atomic Spectroscopy, 61(12): 1285-1293. https://doi.org/10.1016/j.sab.2006.10.012
[14] Khumaeni, A., Lie, Z.S., Lee, Y.I., Kurihara, K., Kagawa, K., Niki, H. (2011). Rapid analysis of tiny amount of power samples using transversely excited atmospheric CO2 laser-induced helium gas plasma with the aid of high-vacuum silicon grease as a binder on a metal sub-target. Applied Spectroscopy, 65(2): 236-241. https://doi.org/10.1366/10-06035
[15] Idrus, N., Kagawa, K., Sakaan, F., Tsuyuki, K., Miura, S. (2012). Analysis of heavy metal pollution in soil using transversely excited atmospheric CO2 laser-induced plasma by trapping the soil in micro-structured holes on metal sub-target. Applied Spectroscopy, 61(12): 1344-1351. https://doi.org/10.1366/000370207783292181
[16] Suyanto, H., Lie, T.J., Kurniawan, K.H., Kagawa, K., Tjia, M.O. (2017). Practical soil analysis by laser induced breakdown spectroscopy employing sub-target supported micro mesh as a powder sample holder. Spectrochimica Acta Part B: Atomic Spectroscopy, 137: 59-63. https://doi.org/10.1016/j.sab.2017.09.013
[17] Iqbal, J., Pardede, M., Jobiliong, E., Hedwig, R., Ramli, M., Khumaeni, A., Setia Budi, W., Idris, N., Abdulmadjid, S.N., Lahna, K., Marpaung, M.A., Karnadi, I., Lie, Z.S., Suyanto, H., Kurniawan, D.P., Lie, T.J., Kurniawan, K.H., Kagawa, K., Tjia, M.O. (2018). Shock wave plasma generation in low pressure ambient gas from powder sample using subtarget supported micro mesh as a sample holder and its potential applications for sensitive analysis of powder samples. Microchemical Journal, 142: 108-116. https://doi.org/10.1016/j.microc.2018.06.022
[18] Ocean Optics. (2009). AddLIBSTM Laser-Induced Breakdown Spectroscopy Software User Guide.
[19] Cremers, D.A., Radziemski, L.J. (2006), Handbook of Laser-Induced Breakdown Spectroscopy: Basics of the LIBS Plasma. John Wiley & Sons, Chichester.
[20] Setia Budi, W., Suyanto, H., Kurniawan, H., Tjia, M.O., Kagawa, K. (1999). Shock excitation and cooling stage in the laser plasma induced by a Q-sw Nd-YAG laser at low pressure. Appl. Spectroscopy, 53(6): 719-730. https://doi.org/10.1366/0003702991947162
[21] Setia Budi, W., Rahman, A., Kurniawan, H., Tjia, M.O., Kagawa, K. (2001). Bending of shock wave plasma induced by a Q-sw Nd-YAG laser at low pressure. Rev. Laser Eng., 29(3): 180-183. https://doi.org/10.2184/lsj.29.180
[22] NIST Electronic Database. https://physics.nist.gov/PhysRefData/ASD/lines_form.html, accessed on Jan. 3, 2020.
[23] Hahn, D.W., Omenetto, N. (2010), Laser-induced breakdown spectroscopy (LIBS), Part I: Review of basic diagnostics and plasma–particle interactions: still-challenging issues within the analytical plasma community. Applied Spectroscopy, 64(12): 335-366. https://doi.org/10.1366/000370210793561691
[24] Ismail, M.A., Imam, H., Elhassan, A., Younissa, W.T., Harith, M. (2004). LIBS limit of detection and plasma parameters of some elements in two different metallic matrices. J. Anal. At. Spectrom., 19: 489-494. https://doi.org/10.1039/B315588A
[25] Fu, X.L., Lia, G.L., Dong, D. (2020). Improving the detection sensitivity for laser-induced breakdown spectroscopy: A review. Front. Phys., 8: 68. https://doi.org/10.3389/fphy.2020.00068
[26] Campanella, B., Legnaioli, S., Pagnotta, S., Poggialini, F., Palleschi, V. (2019). Shock waves in laser-induced plasmas. Atoms, 7(2): 57. https://doi.org/10.3390/atoms7020057
[27] Lal, B., Zheng, H., Yueh, F.Y., Singh, J.P. (2004). Parametric study of pellets for elemental analysis with laser-induced breakdown spectroscopy. APPLIED OPTICS, 43(13): 2792-2797. https://doi.org/10.1364/AO.43.002792
[28] Shi, L.L., Lin, Q.Y., Duan, Y.X. (2015). A novel specimen-preparing method using epoxy resin as binding material for LIBS analysis of powder samples. Talanta, 144: 1370-1376. https://doi.org/10.1016/j.talanta.2015.07.085
[29] Jezerska, L., Drozdova, J., Rozbroj, J., Zegzulka, J., Frydrych, J. (2019). Pelletization of energy grasses: A study on the influence of process and material parameters on pellet quality. International Journal of Green Energy, 16(14): 1278-1286. https://doi.org/10.1080/15435075.2019.1671402