Wahri Sunanda* | Yuant Tiandho | Rika Favoria Gusa | Muhammad Darussalam | Dwi Novitasari
© 2021 IIETA. This article is published by IIETA and is licensed under the CC BY 4.0 license (http://creativecommons.org/licenses/by/4.0/).
OPEN ACCESS
Universitas Bangka Belitung is currently supplied by electricity from the State Electric Company in 690 kVA. Concerning utilizing renewable energy at Universitas Bangka Belitung, the solar power plant is an alternative energy source that will implement. Therefore it is necessary to design a solar power plant with a monitoring system to be known at any time the performance of the solar power plant. Monitoring is conducted in real-time via a website displaying several photovoltaic parameters, including voltage, current, humidity, temperature, and solar irradiation. From the measurement results obtained environmental parameters for temperature between 26°- 56.4°C, humidity 23.6% RH - 85.6% RH and solar irradiation 4.4 W/m2 - 1281.4 W/m2. The measured voltage of 11.41 - 18.95 volts with the rated current from the load used is 0.05 - 1.5 amperes.
renewable energy, solar power plant, monitoring system, environmental parameters, voltage, current
Universitas Bangka Belitung is a public university in the Province of Bangka Belitung Islands. Currently, the main electricity supply is supplied by a state electricity company with a capacity of 690 kVA. However, the campus has started developing some electrical systems provided by solar energy to utilize renewable energy sources. Furthermore, solar energy is an energy source for public street lighting and electrical energy supply in several existing buildings. Currently, the photovoltaic capacity at Universitas Bangka Belitung is 190.4 kW. It certainly shows the commitment of the Universitas Bangka Belitung to the diversification of energy sources which is also outlined in the University's strategic policy.
In this regard, it is necessary to carry out real-time monitoring regarding solar panels as a source of electrical energy at Universitas Bangka Belitung. Problems that arise in the field include maintaining solar panels, batteries, and other supporting electronic equipment. Limited human resources in monitoring are also another problem in the area [1]. Therefore a monitoring system is needed for all panels and system support equipment to know their performance. Research on photovoltaic performance has been carried out to compare the performance of solar panels with a dirty surface due to environmental influences with solar panels that have been cleaned [2]. Several studies related to the use of photovoltaics in campus buildings, including in Boston College with a solar power plant output that can meet 5% of the annual energy needs [3], rooftop photovoltaic design on-campus buildings in Busan, South Korea, which can produce 6% of the yearly energy demand [4], the feasibility analysis of the solar power plant at the University of New Haven provides possible results to be implemented and can also be the basis for the development of photovoltaic installations in nearby area campus buildings that have similar climatic characteristics and economic factors [5], the design of a solar power plant at Ilinois State University which with technical and financial considerations obtained 12 different systems with regard to size, annual electrical energy production, and financing [6], the design of the Technical University of Crete solar power plant which will supply 1899 MWh which is equal to 47% of the annual energy needs [7] and Implementation of grid connected photovoltaic at the University of Autónoma de Cali, Colombia with a performance ratio of 0.73 - 0.78 [8]. The solar photovoltaic rooftop design at Pondhicherry University, which uses PVsyst Software, produces 590 MWh, equivalent to 11% of the campus annual energy requirement [9] also uses PVsyst for modeling of photovoltaic use in 2 buildings at KTH Campus in Stockholm, Sweden [10]. Then economic calculations related to photovoltaic design on several campuses in Indonesia, including campuses in the southern part of Java Island [11] in East Java for the rooftop photovoltaic design [12] and at the University of Samudera with the potential power of 3 MW [13, 14]. Apart from photovoltaic design using software, mathematical modeling is carried out for use. photovoltaic at University of Kalyani, India [15].
Research related to humidity and temperature monitoring for solar panels with a capacity of 50 Wp but not real-time has also been carried out [16]. Of course, developments related to monitoring several real-time parameters and characteristics of solar panels, including solar radiation, temperature, humidity, voltage, current, and power, need to be built to optimize the use of solar panels as a source of electrical energy, including using microcontroller IoT [17-20]. Monitoring is carried out in real-time, based on the website [21], making it easier to observe changes in the value of parameters in solar energy-sourced power plants, maintenance, and detecting disturbances [22-24].
In this study, the object of research used photovoltaic at the Universitas Bangka Belitung. With the potential availability of 190.4 kW of power, the maximum utilization needs to be done to monitor that performance in providing alternative electrical energy at the Universitas Bangka Belitung.
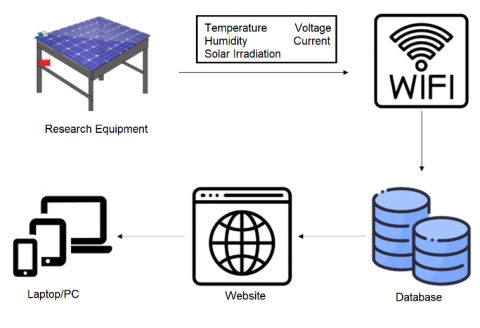
The system designed consists of sending parameter values so that they can be monitored via the website. We watch several parameters in this work, including current, voltage, solar radiation, temperature, and humidity. In Figure 1 can see a model of the system. The parameters are collected by using some sensors and is processed by a microcontroller. Then, NodeMCU sends the monitoring results with a request and response method that utilizes the internet network. The output stored in the cloud database and displayed on a website. Thus, it can be visited through a device connected to the internet.
Figure 1. Model of the system
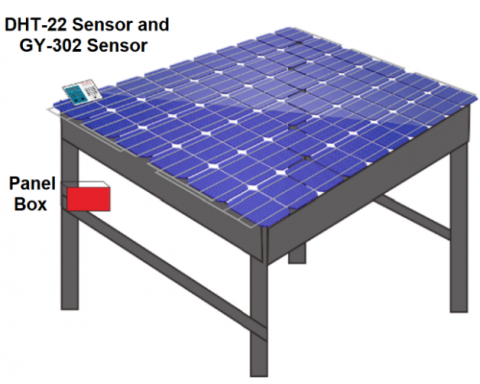
Furthermore, for the design of the research equipment, as in Figure 2. Since the solar panel must be directly illuminated by sunlight, then the NodeMCU, Arduino, ACS712- sensor, voltage sensor, battery, and solar charge control are placed in a panel box under the panel. Meanwhile, the GY-302 sensor and the DHT22 sensor are placed close together on top of the panel. Thus, the wiring diagram of the tool consists of Arduino, NodeMCU, current sensor, voltage sensor, temperature sensor, and light sensor.
Arduino is used to reading the value generated by the sensor. NodeMCU helps send data to the server. At the same time, the voltage sensor is used to read the value of the voltage generated by the solar panel. ACS712 current sensor functions to read the value of the current generated by the solar panel. The GY-302 light sensor is used to measure solar radiation, and the DHT22 temperature sensor is used to measure ambient temperature and environmental humidity.
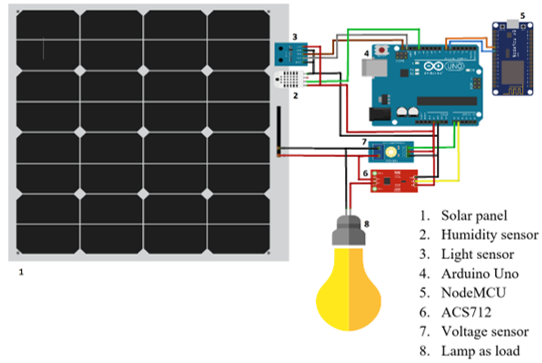
In Figure 3, the wiring diagram of the system is presented. The positive terminal of a solar panel is connected to Vcc on the voltage sensor. The negative terminal of the solar panel is connected to the GND on the voltage sensor. Then the solar panel is connected in series to the current sensor. It is connected to pins A0 (Analog 0) to A3 (Analog 3) Arduino for output. For the ground current sensor to ground Arduino and Vcc current sensor to pin 5V Arduino. Then the temperature and humidity sensor (DHT22) is connected to the Arduino digital pin 12, the SDA and SCL pins on the light sensor (GY-302) are connected to the SDA, and SCL Arduino pins ADDR. For temperature sensors, humidity sensors, and light sensors, each sensor ground is connected to the Arduino ground and Vcc to 3.3V Arduino. Then Pin 8 Arduino is connected to D7 NodeMCU and pin 7 Arduino to D8 NodeMCU as serial communication. The Arduino 5V pin is connected to the Vin NodeMCU, and the Arduino ground is connected to the NodeMCU ground for providing power to NodeMCU.
Figure 2. An object of photovoltaic performance monitoring
Figure 3. Wiring diagram
The design of tools and websites is the next stage to be carried out. Only after that is it continued with system testing. The data received by the sensor will be sent to the database using the NodeMCU module then it will be displayed on the website and stored in the database. After the system is valid, data collection of voltage, current, solar radiation, ambient temperature, and environmental humidity is carried out on the solar panel.
In Table 1, a comparison of the measurement results between the voltage sensor and the multimeter is presented. The source voltage of this section is in the range of 1 - 25 volts. Therefore, the error value ranges from 0 - 4.76%, with an average error of 0.91%.
Table 1. Measuring of a voltage sensor
|
Vsource (V) |
Voltage sensor (V) |
Multimeter (V) |
Error (%) |
|
1 |
1.05 |
1.1 |
4.76 |
|
2 |
2.03 |
2.1 |
3.45 |
|
3 |
3.01 |
3.1 |
2.99 |
|
4 |
4.03 |
4.1 |
1.74 |
|
5 |
5.01 |
5.1 |
1.80 |
|
6 |
6.04 |
6.1 |
0.99 |
|
7 |
7.06 |
7.1 |
0.57 |
|
8 |
8.04 |
8.1 |
0.75 |
|
9 |
8.99 |
9 |
0.11 |
|
10 |
10.02 |
10.1 |
0.80 |
|
11 |
11.02 |
11.1 |
0.73 |
|
12 |
12.02 |
12.1 |
0.67 |
|
13 |
13 |
13 |
0.00 |
|
14 |
14.05 |
14.1 |
0.36 |
|
15 |
15.05 |
15.1 |
0.33 |
|
16 |
16.03 |
16.1 |
0.44 |
|
17 |
17.06 |
17.1 |
0.23 |
|
18 |
18.01 |
18 |
0.06 |
|
19 |
19.06 |
19.1 |
0.21 |
|
20 |
20.04 |
20.1 |
0.30 |
|
21 |
21.02 |
21 |
0.10 |
|
22 |
22.02 |
22.1 |
0.36 |
|
23 |
23.02 |
23.1 |
0.35 |
|
24 |
24.02 |
24.1 |
0.33 |
|
25 |
25 |
25.1 |
0.40 |
|
Average |
0.91 |
||
Table 2 compares the current sensor against the ammeter with a source voltage and a load of light-emitting diode (LED) with the real power of 2 watts for each LED.
Table 2. Measuring of current sensor
|
Vsource (V) |
Current sensor (A) |
Multimeter (A) |
Load |
Error (%) |
|
12 |
0.15 |
0.12 |
1 lamp |
20 |
|
12 |
0.22 |
0.21 |
2 lamps |
4.55 |
|
12 |
0.3 |
0.31 |
3 lamps |
3.33 |
|
Average |
9.29 |
|||
Table 3 compares the temperature sensor with the thermometer and the humidity sensor with the hygrometer. The error value is at an average of 0.58% for temperature and 0.96% for humidity.
Table 3. Measuring of sensor DHT22
|
DHT22 |
Thermometer (℃) |
Hygrometer (%) |
Error (%) |
||
|
Temperature (℃) |
Humidity (%RH) |
Temperature (℃) |
Humidity |
||
|
26 |
90 |
26.2 |
90.5 |
0.77 |
0.56 |
|
26.6 |
88 |
26.7 |
90 |
0.38 |
2.27 |
|
28.4 |
87.6 |
28.5 |
88 |
0.35 |
0.46 |
|
28.7 |
86.5 |
28.8 |
86.9 |
0.35 |
0.46 |
|
29 |
86.1 |
29.3 |
87 |
1.03 |
1.05 |
|
Average |
0.58 |
0.96 |
|||
Table 4 shows a sensor test for the intensity of solar radiation against the solar power meter. The error value is in the range of 0 - 4.55%.
From the data in Table 1, Table 2, Table 3 and Table 4 show that after the K-S normality test, all data are normally distributed. In the paired sample T-Test between voltage sensor and multimeter, between current sensor and multimeter, between temperature sensor and thermometer, between humidity sensor and hygrometer, it is found that the sig value is more significant than 0.05, which means that it is not significantly different.
Table 4. Measuring of sensor GY-302
|
GY-302 Sensor (W/m²) |
Solar power meter (W/m²) |
Error (%) |
|
180.4 |
180.4 |
0.00 |
|
189 |
180.4 |
4.55 |
|
188.1 |
195.4 |
3.88 |
|
185.3 |
182.3 |
1.62 |
|
242.7 |
247.5 |
1.98 |
|
311.9 |
316.2 |
1.38 |
|
418.1 |
415.1 |
0.72 |
|
212.8 |
219.4 |
3.10 |
|
236.5 |
229 |
3.17 |
|
219.8 |
218.3 |
0.68 |
|
313.1 |
312.9 |
0.06 |
|
505 |
505.2 |
0.04 |
|
479 |
473.8 |
1.09 |
|
490.5 |
493.2 |
0.55 |
|
Average |
1.63 |
|
Monitoring the performance of solar panels can be seen in several parameters, namely, voltage, current, temperature, humidity, and intensity of solar radiation. For example, Figure 4 results from voltage monitoring on July 18, 2020, from 08:00 WIB to 15:00 WIB with data retrieval every 5 minutes. During the monitoring, the highest voltage value was 18.95 V, and the lowest value was 11.41 V.
Figure 4. Monitoring of voltage
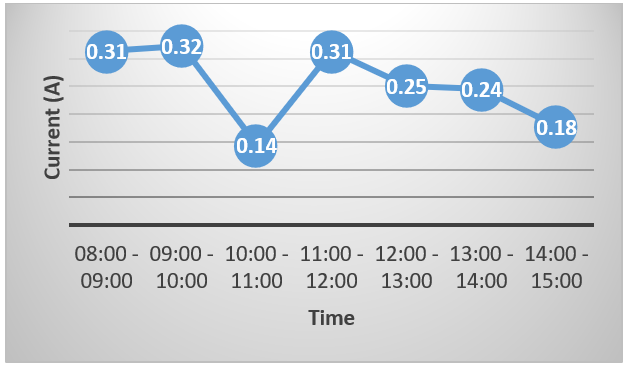
Figure 5 shows the flow monitoring results on July 18, 2020, with measurements taken from 08:00 WIB to 15:00 WIB. Data sampling was done every 5 minutes. From the size, the highest current value is 1.5 A, and the lowest is 0.05 A.
Figure 6 shows temperature monitoring on July 18, 2020, with measurements taken from 08:00 WIB to 15:00 WIB. Data is copied every 5 minutes. The measure found that the highest temperature was 56.4℃, and the lowest was 26℃.
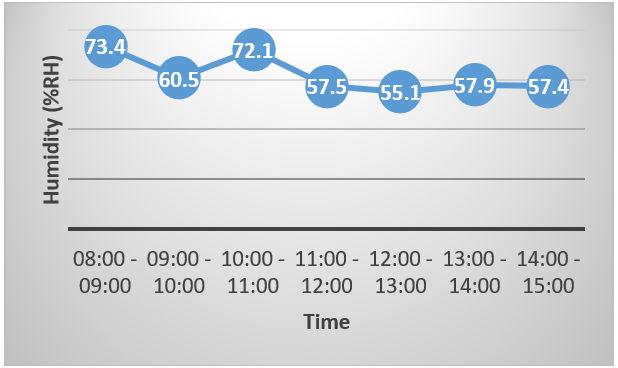
Figure 7 shows the results of humidity monitoring carried out on July 18, 2020. Measurements were made from 08:00 WIB to 15:00 WIB, with data sampling every 5 minutes. The highest humidity was 85.6% RH, and the lowest humidity was 23.6% RH.
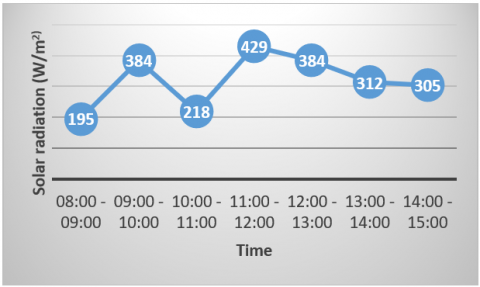
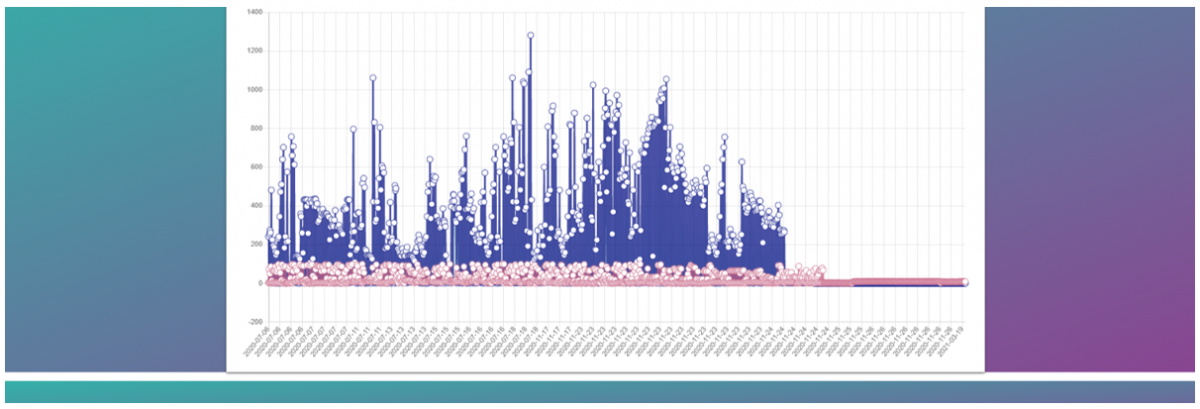
Figure 8 shows the results of monitoring solar radiation on July 18, 2020 which was carried out from 08:00 WIB to 15:00 WIB with data sampling every 5 minutes. The highest value of solar radiation is 1281.4 W/m2, and the lowest value is 4.4 W/m2.
Figure 5. Monitoring of current
Figure 6. Monitoring of temperature
Figure 7. Monitoring of humidity
Figure 8. Monitoring of solar irradiation
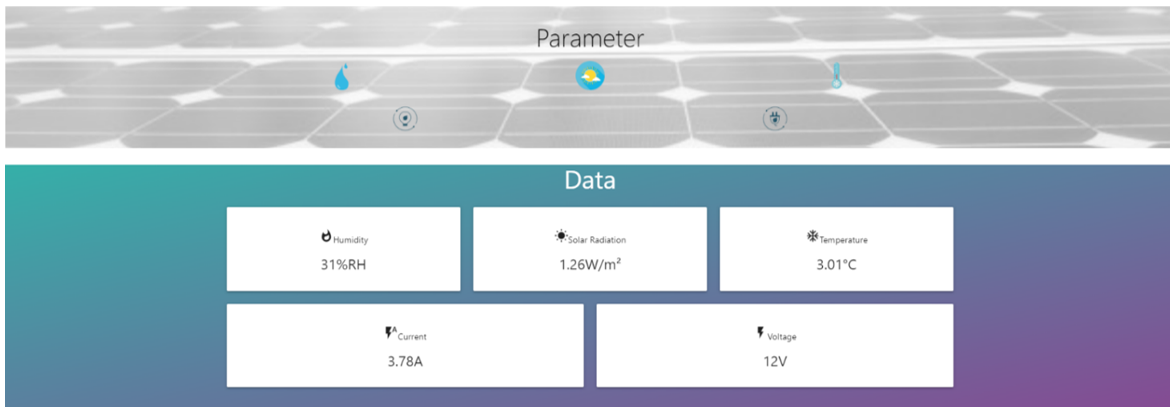
Figure 9. Website of a monitoring system
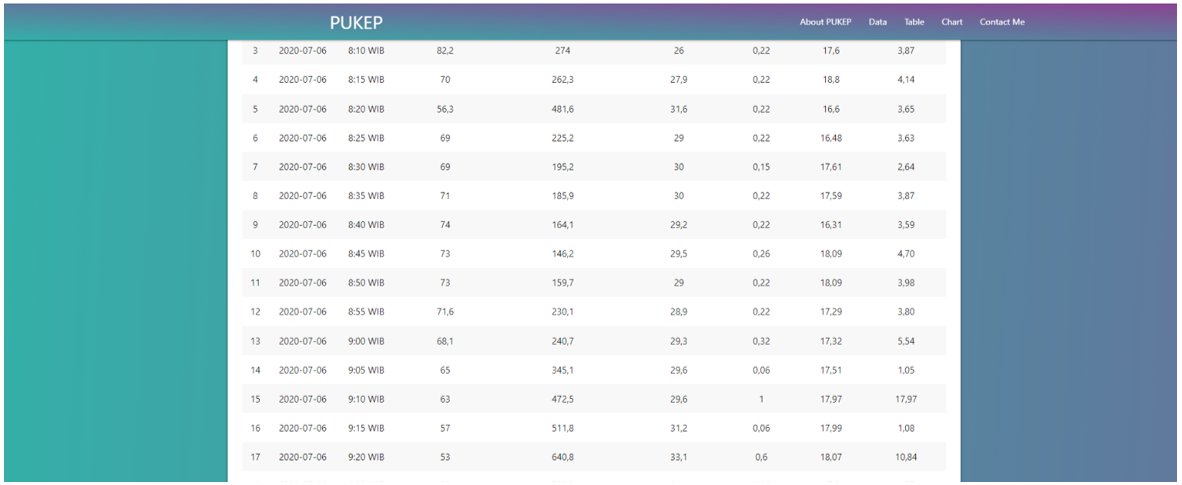
Figure 10. Data on website
Figure 11. Chart of solar irradiation and real power
For effectiveness in monitoring the performance of solar panels, data on several parameters, namely voltage, current, temperature, humidity, and solar irradiation intensity, can be seen in real-time on the website. Figure 9 shows the display of real-time data from the monitored parameters, namely environmental humidity in% RH (percent relative humidity), solar radiation intensity in units of W/m2 (Watts per square meter), the ambient temperature in ℃ (degrees Celsius), current in units (amperes), and voltage in units (volts).
Figure 10 shows a table display of data obtained from the website database. The parameters contained in the table are date, time, environmental humidity in% RH, solar radiation in W/m2 ambient temperature in ℃, current in A, a voltage in V, and power in Watts obtained from the multiplication of voltage and current.
Figure 11 shows a graphic display of solar radiation received by solar panels and the power generated by solar panels based on the received solar radiation, with the date as the x-axis on the graph, solar radiation in W/m2, and power in Watts as the y-axis.
We tried to analyze the relationship between solar panel efficiency and several weather parameters such as temperature and humidity through the monitoring data. It is because these two parameters influence the performance of solar panels. The performance of solar panels, especially those based on silicon, will decrease with increasing temperature. The temperature will change the energy gap value of silicon, which impacts the energy requirements of photons for the electron and hole generation process so that the solar panels can flow current [25]. For humidity has a slightly more complicated impact. In certain conditions, the humidity will help solar panels have a more stable temperature, but on the other hand, humidity can also interfere with sunlight that irradiates the solar panels. Therefore, by modifying the simple model of solar panel efficiency (η) as proposed by Dubey et al. [26] and by integrating the efficiency dependence on humidity as suggested [27], the relationship between solar panel efficiency and weather parameters can be written as,
$\eta ={{\eta }_{ref}}\left( 1-\beta \left( T-{{T}_{ref}} \right)+\gamma \exp \left( -\alpha h \right) \right) $ (1)
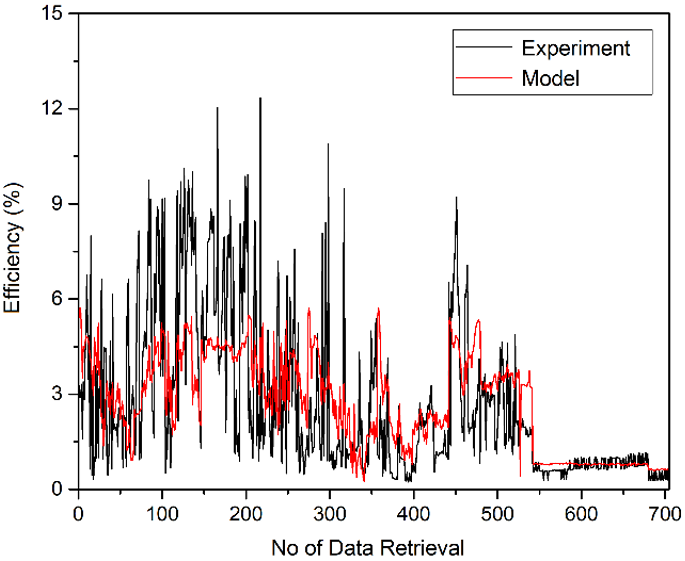
where, ηref is the efficient solar panel at standard conditions, T is the temperature; Tref is the panel temperature at the standard state, h is humidity, β is the empirical constant related to temperature, while α and γ are the empirical constants related to humidity. Through the fitting data between the experimental monitoring data and the model in the Eq. (1) it is known that the fit of the model is indicated by coefficient of determination, R2 = 0.702. In addition, in Figure 12, a comparison between monitoring data and the proposed model is presented. Explicitly, the expression of the relationship between efficiency and the observed weather parameters on the solar panel satisfies:
$\eta =43.1486\times \left( \begin{align} & 1-1.01468\exp \left( -0.00185521h \right) \\ & -0.0000734673\left( T-25 \right) \\\end{align} \right) $ (2)
Figure 12. The comparison between the experimental monitoring data and the solar panel efficiency relationship model to the weather parameters
It appears that the proposed model and the experimental results have an identical pattern of change. In addition, the suitability of the model with experimental data from this study is relatively higher than the research conducted by Tijjani Baraya et al. [28], which obtained a coefficient of determination R2 = 0.517. The higher coefficient of determination is due to the involvement of the two weather parameters in the calculation. In addition, based on the results of the fittings obtained in the Eq. (2) the observed performance of the solar panels decreases with increasing temperature and humidity. Through the value obtained for the β coefficient related to temperature in the proposed model, it appears that the solar panel's performance is degraded due to the increase in temperature. It is in line with various studies that have been conducted [29-31]. Likewise, with the humidity parameter, the value of the γ coefficient, which is minus, indicates that the increase in humidity degrades the solar panel's performance. This phenomenon is consistent with research conducted by Tijjani Baraya et al. [28] and Mekhilef et al. [32], which shows that the performance of silicon-based solar panels is degraded due to humidity. In other words, it can state that the temperature and humidity parameters are the parameters that play a role in the degradation of the performance of the solar panels in this study.
We gratefully acknowledge the funding from USAID through the SHERA program – Centre for Development of Sustainable Region (CDSR). In the year 2017-2021, CDSR is led by Centre for Energy Studies – UGM.
[1] Sunanda, W., Pratama, E.A., Subastiyan, H., Tiandho, Y., Novitasari, D. (2020). Monitoring for Photovoltaic in Outer Island. Journal of Engineering and Scientific Research, 2(2): 68-73. https://doi.org/10.23960/jesr.v2i2.59
[2] Maulana, A., Yandi, W., Sunanda, W. (2020). Analysis of photovoltaic cells performance at university of Bangka Belitung. Journal of Innovation and Technology, 1(2): 8-11. https://doi.org/10.31629/jit.v1i2.3166
[3] Meyer, A., Zaman, F., Norton, E. (2014). A case study: Solar panels at Boston College. https://www.bc.edu/content/dam/files/schools/cas_sites/envstudies/pdf/Student%20Research/8_Solar_Panels_at_Boston%20College_paper.pdf, accessed on May 20, 2021.
[4] Song, J., Yosoon, C. (2015) Evaluation of rooftop photovoltaic electricity generation systems for establishing a green campus, Geosystem Engineering, 18(1): 51-60. https://doi.org/10.1080/12269328.2014.997892
[5] Lee, J., Chang, B., Aktas, C., Gorthala, R. (2016). Economic feasibility of campus-wide photovoltaic systems in New England. Renewable Energy, 99: 452-464. https://doi.org/10.1016/j.renene.2016.07.009
[6] Jo, J.H., Ilves, K., Barth, T., Leszczynski, E. (2017). Implementation of a large-scale solar photovoltaic system at a higher education institution in Illinois, USA. AIMS Energy, 5(1): 54-62. https://doi.org/10.3934/energy.2017.1.54
[7] Hasapis, D., Savvakis, N., Tsoutsos, T., Kalaitzakis, K., Psychis, S., Nikolaidis, N.P. (2017). Design of large scale prosuming in Universities: The solar energy vision of the TUC campus. Energy and Buildings, 141: 39-55. https://doi.org/10.1016/j.enbuild.2017.01.074
[8] Castrillón-Mendoza, R., Manrique-Castillo, P.A., Rey-Hernández, J.M., Rey-Martínez, F.J., González-Palomino, G. (2020). PV energy performance in a sustainable campus. Electronics, 9(11): 1874. https://doi.org/10.3390/electronics9111874
[9] Barua, S., Prasath, R.A., Boruah, D. (2017). Rooftop solar photovoltaic system design and assessment for the academic campus using PVsyst software. International Journal of Electronics and Electrical Engineering, 5(1): 76-83. https://doi.org/10.18178/ijeee.5.1.76-83
[10] Mewes, D., Monsalve, P., Gustafsson, I., Hasan, B., Palén, J., Nakakido, R., Capobianchi, E., Österlund, B. (2017). Evaluation methods for photovoltaic installations on existing buildings at the KTH campus in Stockholm, Sweden. Energy Procedia, 115: 409-422. https://doi.org/10.1016/j.egypro.2017.05.038
[11] Kristiawan, R.B., Widiastuti, I., Suharno, S. (2018). Technical and economical feasibility analysis of photovoltaic power installation on a university campus in indonesia. In MATEC Web of Conferences, 197, 08012. https://doi.org/10.1051/matecconf/201819708012
[12] Tarigan, E., Djuwari, J., Dwi Kartikasari, F. (2017). Photovoltaic solar energy simulation of rooftops of a university campus buildings in Surabaya, Indonesia. Proceedings of the First EAI International Conference on Computer Science and Engineering. https://doi.org/10.4108/eai.27-2-2017.152259
[13] Thaib, R., Amudy, M., Rizal, T. (2019). Study on implementation of rooftop photovoltaic power plant as an effort to attain a sustainable campus. European Journal of Engineering Research and Science, 4(11): 21-25. https://doi.org/10.24018/ejers.2019.4.11.1606
[14] Umar, H., Amudy, M., Rizal, T.A. (2019). Feasibility study of installation photovoltaic system at a university in Indonesia: A case study. Journal of Physics: Conference Series, 1402(4): 044035. https://doi.org/10.1088/1742-6596/1402/4/044035
[15] Chakraborty, T., Ghosh, P., Mal, S., Biswas, U. (2019). A modelling applied to active renewable energy for an existing building of higher educational institution. International Journal of System Assurance Engineering and Management, 10(5): 1361-1368. https://doi.org/10.1007/s13198-019-00890-x
[16] Subastiyan, H., Sunanda, W., Gusa, R. F. (2020). A prototype of monitoring temperature and humidity on photovoltaic using ESP8266. In IOP Conference Series: Earth and Environmental Science, 520(1): 012010. https://doi.org/10.1088/1755-1315/520/1/012010
[17] Madeti, S.R., Singh, S.N. (2017). Monitoring system for photovoltaic plants: A review. Renewable and Sustainable Energy Reviews, 67: 1180-1207. https://doi.org/10.1016/j.rser.2016.09.088
[18] Kekre, A., Gawre, S.K. (2017). Solar photovoltaic remote monitoring system using IOT. 2017 International Conference on Recent Innovations in Signal Processing and Embedded Systems (RISE). https://doi.org/10.1109/rise.2017.8378227
[19] Beránek, V., Olšan, T., Libra, M., Poulek, V., Sedláček, J., Dang, M.Q., Tyukhov, I.I. (2018). New monitoring system for photovoltaic power plants’ management. Energies, 11(10): 2495. https://doi.org/10.3390/en11102495
[20] Hamied, A., Mellit, A., Zoulid, M.A., Birouk, R. (2018). IoT-based experimental prototype for monitoring of photovoltaic arrays. In 2018 International Conference on Applied. https://doi.org/10.1109/icass.2018.8652014
[21] Adhya, S., Saha, D., Das, A., Jana, J., Saha, H. (2016). An IoT based smart solar photovoltaic remote monitoring and control unit. 2016 2nd International Conference on Control, Instrumentation, Energy & Communication (CIEC). https://doi.org/10.1109/ciec.2016.7513793
[22] Moreno-Garcia, I.M., Palacios-Garcia, E.J., Pallares-Lopez, V., Santiago, I., Gonzalez-Redondo, M.J., Varo-Martinez, M., Real-Calvo, R.J. (2016). Real-time monitoring system for a utility-scale photovoltaic power plant. Sensors, 16(6): 770. https://doi.org/10.3390/s16060770
[23] Ortega, E., Aranguren, G., Saenz, M.J., Gutierrez, R., Jimeno, J.C. (2017). Study of photovoltaic systems monitoring methods. 2017 IEEE 44th Photovoltaic Specialist Conference (PVSC). https://doi.org/10.1109/pvsc.2017.8366523
[24] Van Sark, W., Louwen, A., Tsafarakis, O., Moraitis, P. (2017). PV System monitoring and characterization. Photovoltaic Solar Energy, 553-563. https://doi.org/10.1002/9781118927496.ch49
[25] Tiandho, Y., Sunanda, W., Afriani, F., Indriawati, A., Handayani, T.P. (2018). Accurate model for temperature dependence of solar cell performance according to phonon energy correction. Latvian Journal of Physics and Technical Sciences, 55(5): 15-25. https://doi.org/10.2478/lpts-2018-0032
[26] Dubey, S., Sarvaiya, J.N., Seshadri, B. (2013). Temperature dependent photovoltaic (PV) efficiency and its effect on PV production in the world–A review. Energy Procedia, 33: 311-321. https://doi.org/10.1016/j.egypro.2013.05.072
[27] Park, N.C., Oh, W.W., Kim, D.H. (2013). Effect of temperature and humidity on the degradation rate of multicrystalline silicon photovoltaic module. International Journal of Photoenergy, 1-9. https://doi.org/10.1155/2013/925280
[28] Tijjani Baraya, J., Hamza Abdullahi, B., Sylvester Igwenagu, U. (2020). The effect of humidity and temperature on the efficiency of solar power panel output in Dutsin-ma local government area (L.G.A), Nigeria. Journal of Asian Scientific Research, 10(1): 1-16. https://doi.org/10.18488/journal.2.2020.101.1.16
[29] Peng, Z., Herfatmanesh, M.R., Liu, Y. (2017). Cooled solar PV panels for output energy efficiency optimisation. Energy Conversion and Management, 150: 949-955. https://doi.org/10.1016/j.enconman.2017.07.007
[30] Adeeb, J., Farhan, A., Al-Salaymeh, A. (2019). Temperature effect on performance of different solar cell technologies. Journal of Ecological Engineering, 20(5): 249-254. https://doi.org/10.12911/22998993/105543
[31] Ike, C.U. (2013). The effect of temperature on the performance of a photovoltaic solar system in Eastern Nigeria. Research Inventy: International Journal of Engineering and Science, 3(12): 10-14. https://doi.org/10.1051/matecconf/201824004004
[32] Mekhilef, S., Saidur, R., Kamalisarvestani, M. (2012). Effect of dust, humidity and air velocity on efficiency of photovoltaic cells. Renewable and Sustainable Energy Reviews, 16(5): 2920-2925. https://doi.org/10.1016/j.rser.2012.02.012