Veerabhadrappa S. Thippeswamy* | Puranik M. Shivakumaraswamy | Suguna G. Chickaramanna | Venkatesha M. Iyengar | Anuroop P. Das | Abhyudaya Sharma
© 2021 IIETA. This article is published by IIETA and is licensed under the CC BY 4.0 license (http://creativecommons.org/licenses/by/4.0/).
OPEN ACCESS
Vital signs are a group of essential body parameter, which provides the overall health state of a human body. They often play a pivotal role in accessing the overall physiological state of the human body. For patients requiring intense and continuous monitoring, especially those in an Intensive Care Unit, the essentiality to assess their vital signs regularly. Monitoring the health status of ICU patients becomes quite cost-effective when the same can be monitored within the comfort zone of their own house. The technique elaborated herein revolves around the fundamental idea of implementing a vital sign monitoring system that continuously assesses a patient and regularly updates the same to a centralized server system. In an event of a medical emergency, the relevant data is conveyed to the doctor via an efficient alert system, thereby ensuring safe and timely treatment to the patients. Also, as suggested the proposed design is characterized by IoT capability that allows real-time monitoring of the subject, thereby allowing, minimizing the human involvement in its operation.
vital signs, ICU, internet of things, real-time monitoring, SpO2, heart rate, ECG
Disease detection and their associated treatment required, are rapidly evolving in the present medical world. The most commonly used means of detecting, diagnosing, and treating various diseases are the use of displays that show the patients’ physiologic vital signs [1]. A typical example of an area that utilizes this methodology of disease diagnosis and treatment is a hospital ICU, wherein the parametric function values suggested by various monitoring devices are taken as one of the discrete criteria of assessing and asserting a patients’ health status. The physiologic parameters currently displayed on ICU monitors include blood pressure, pulse waveform, ECG, body temperature, oxygen saturation of the blood, heart rate, and respiratory rate. Though the data acquired from these devices are quite reliable in disease detection, and doctors consistently use them to monitor physiologic parameters to assure the patient’s stability, they do inherently possess an undeniable constraint of inaccessibility to the underprivileged masses of the society. The extensive care of modern ICU tends to be of absolute facility when the patients tend to be paraplegic, a medical condition requiring just prolonged continuous monitoring. Moreover, it often becomes a tremendously tedious process when the number of patients to be monitored in an ICU becomes large. Thus, any attempt to modernize, innovate or improve these devices necessarily involves developing new techniques to mitigate the aforementioned negatives. One effective way of implementing the same is by incorporating the ideology of IoT utilities in these devices [2]. Enabling IoT in these devices points in the direction wherein all vital measuring devices are linked to a common hub or server and collectively share information among them. This forms the basic underlying principle of the proposed. The establishment of such an interconnected monitoring network allows less critical patients, requiring continuous monitoring, to be evaluated regularly, within the comfort zones of their houses, thereby reducing the incurred cost involved with the process, when the same is done within an ICU front. The paper puts forward a bold attempt to IoT - enable the Electrocardiogram, SpO2, Pulse Rate Monitoring, Respiration Rate Monitoring and Body Temperature measuring devices of an ICU.
The basic parametric values obtained from the proposed system is then immediately confronted by an analog front, wherein a set of complex algorithmic computation employed to assess the same and compare it with a set of predefined medical thresholds. A fall or rise of the measured values beyond these limiting thresholds is indeed a clear indication of a medical emergency, during which the patient under concern must be provided with required treatment and care supports. The urgency to address such situations is profoundly solved by the usage of an SMS, which will send a timely alert message to the doctor or concerned professional citing the case, need of an emergency [3]. Moreover, the output obtained from the system is then fed to a cloud server with IoT capabilities which further strengthens the practicality of the monitoring scheme in the modern tech-savvy world. The addition of IoT capabilities to the considered design promotes its essential feature of interconnected networks, which allows real-time monitoring and analysis of the captured data point values. The fundamental idea of interconnected networks allows real-time data to be stored in a web-based server for continuous and efficient monitoring of signals with much visual appeal on any connected device [4]. This ideology further pushes the scope of the proposal, allowing it to be enabled with an internet-based alerting mechanism that warns the required users in an event when the measure parametric values cross a predefined upper and lower threshold, thereby denoting relevant adverse medical conditions at a timely manner, hence assuring a faster and precise treatment to the concerned subjects. The paper further catalogs the typical system design, methodology, results and discussions for the envisioned design schematic.
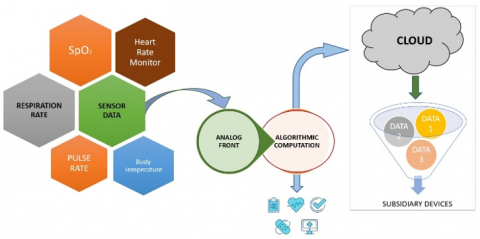
The basic functional architecture of the proposed design has both hardware and software constituents, shown in Figure 1. The system includes ECG, SpO2, Pulse Rate Monitoring, Respiration Rate Monitoring and Body Temperature. The analog front and signal conditioning circuits of each sensor/electrode are connected to the cloud through a microcontroller. This is effectively followed and backed up by software supports for data acquisition, processing and storing the result in the cloud (Google Firebase) written using Python scripts. The basic foundational base of the entire process is the Raspberry Pi processor that runs on Raspbian OS, a robust and flexible platform for effective processing and analysis of real-time data.
Figure 1. Block diagram of Health Monitoring device
2.1 ECG
The ECG is capable of detecting almost any kind of heart abnormality at an early stage and represents an essential tool for the assessment of the cardiovascular system [5]. The twelve-electrode ECGs are considered the gold standard in clinical practice [6]. Several researchers demonstrated that three-electrode ECGs provide an approximately 98% and 74% sensitivity and specificity respectively for distinguishing between native and pathological heart electrical activity [7, 8]. Branko Babusiak et al. shown low powered two-electrode ECG system that may be used for the analysis of the electrical activity of the heart [9]. The three electrodes (lead-II) were used to acquire the ECG signal to monitor the electrical activity of the heart. It provides analog readings as the output and the ECG is used to map the electrical activity of the heart. The three electrodes are connected to RA (Right arm), LA (Left Arm), and RL (Right Leg) to the IC AD8232 to acquire an ECG signal [10].
2.2 Pulse oximetry
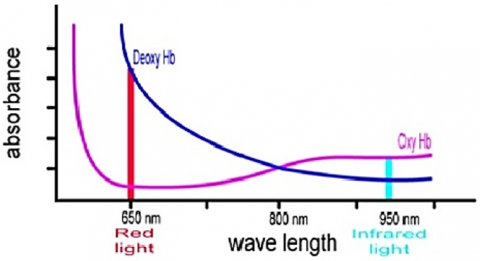
Continuous monitoring of arterial blood saturation using pulse oximetry has become the standard of care in the ICU [11]. Pulse oximetry is the non-invasive measurement of oxygen saturation (SpO2). It is based on the concept that arterial oxygen saturation can be determined by using two wavelengths, provided the measurements are made on the pulsatile part of the waveform. The absorption coefficients of oxygenated hemoglobin (HbO2) and deoxygenated hemoglobin (Hb) of these two wavelengths are shown in Figure 2. This non-invasive method of multi-spectral measurement is based on radiation of nearly monochromatic light, emitted by Light Emitting Diodes (LED) in the range of 600nm to 1400nm, through an area of skin on the finger [12, 13]. MAX30102 biosensor chip is used as integrated pulse oximetry and to monitor pulse rate. It has ultra-low power operation due to zero standby current. It also provides a high signal-to-noise ratio due to its robust motion resilience and has high output capability [14].
Figure 2. Absorbance v/s wavelength of blood
2.3 Body temperature and respiration rate
NTC is a nonlinear resistor whose resistance value changes with temperature. As the temperature increases, the resistance value decreases in a nonlinear fashion. This nonlinear fashion can be presented as a constant, which is different for different materials of a thermistor. It is noted that there is a 7kΩ variation in resistance of the NTC thermistor with a 1℃ change in temperature. A Wheatstone bridge setup is used, where there is a shift from the perfect balance condition of the bridge whenever there is a temperature change, usually caused by inhaling and exhaling [15, 16].
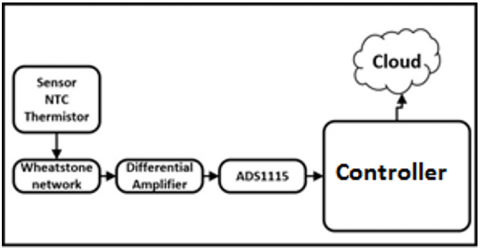
A Thermistor based Respiratory rate detection method is shown in Figure 3. The variation of resistance based on changes in temperature of the thermistor during inhaling and exhaling phases of respiration forms the underlying principle.
Figure 3. Block diagram of respiration rate monitoring device
2.4 Google Firebase
Firebase provides a communication solution that satisfies the demand for real-time and stable transmission of the respiration rate over the cloud [17, 18]. For time-critical issues, this provides low latency data communication. When there exists a need for the transfer of a large database, the rate of transmission should be very high to ensure low latency. Google firebase supports several platforms such as iOS, Android, Linux, etc., especially useful for time-limited development and its usage in technologies of varying design architecture and schematics.
Absolute precision and accuracy are the most desired characteristics in any patient monitoring system. Thus, the addition of the desired features high- lighted by this proposal invariantly necessitates the use of typical sensors with minimal structural dimensions that back the desired natures of affordability and precision. Based on the conclusive study, the most effective sensors satisfying all the aforementioned characteristics are found to be an AD8232, MAX30102 and thermistor.
The typical schematic shown in Figure 4 used in the concerned proposal involves the use of AD8232, MAX30102 and NTC thermistor connected in a Wheatstone bridge configuration which tends to be in a balanced state at the initial stage of operation. During a respiratory cycle, the associated inspiration and expiration cause the resistance of the thermistor to increase or decrease respectively, thereby unbalancing the bridge. The output of the sensor is connected to the controller through ADC. The respiratory signal is recorded at the sampling frequency of 5 Hz for further analysis and related algorithmic computations. The sample of a waveform can thus be derived from these data points which indicate several distinct positive and negative peaks as shown in Figure 5.
Figure 4. Circuit diagram of remote patient monitoring system
Figure 5. Samples of respiration cycle for 120 seconds
3.1 Analog circuit design
Analog Front based on the inherent specifications, the differential voltage obtained as the primary output of the sensors is in the order of millivolts, which push forward the requirement to use an amplifier to boost the signal yield to a level necessary for further analysis. For satisfactory performance, the proposed design demands the use of a differential amplifier.
As the signal derived from the NTC thermistor, AD8232, and its associated circuitry is analog, it is indeed essential to digitizing them, such that the required parametric values can be processed by the central processor. The lack of inherent Analog to Digital Converter (ADC) modules in Raspberry Pi, further demands the use of an external ADC circuitry that adds up to the analog front of the overall design. To meet the design requirement of the proposal, a 16-bit ADC (ADS 1115) is added to the analog front to digitize the required parametric values with increased accuracy and precision [19-21]. It converts the analog data at the rate of up to 860 samples per second, which makes it suitable for both small and large-signal measurements. The primordial reason to choose the ADS 1115 tends to be its inherent properties of efficient digitization and communication as it uses the I2C protocol for sharing data with the Raspberry pi processor [22]. The MAX30102 directly outputs data points via the SDA and SCL buses of the I2C protocol. The overall functional circuitry with a different modular interface is shown in Figure 4, whereas the flow chart of the designed circuit is indicated in Figure 6. It is observed from the flow chart, this system runs in an infinite loop and is only broken in case of an error in any sensor connection. The vital parameters are continuously monitored and compared with the set of thresholds as defined in Table 1. If any one of the parameters out-bound the limit then the control mechanism is activated and an SMS is sent to the doctor, nurse and caretaker along with a loud buzzer that gets activated.
Table 1. Various threshold setting
|
Parameter |
Lower limit |
Upper limit |
|
Pulse rate |
<60 bpm |
>120 bpm |
|
Respiration rate |
<12 breaths per minute |
>24 breaths per minute |
|
SpO2 |
<80 % |
- |
Figure 6. Flow chart of the implemented design
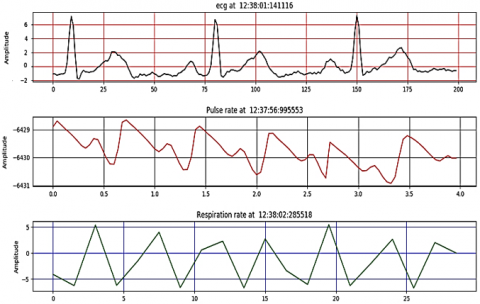
ECG, pulse and respiratory signals were acquired simultaneously for a one-minute duration with a sampling rate of 128 samples per second. The data points thus yielded from the above system are further conveyed to the Raspberry Pi for further analysis and related algorithmic computations. An efficient and informative waveform can thus be derived from these data points which indicate several distinct positive and negative peaks as shown in Figure 7. The derived waveform is immensely self-informative being the fact that the timestamp is present makes it very useful for doctors.
Further analysis of the graphical data reveals the pulse rate, time taken for one respiration cycle, computed from the peak to peak time interval of any two consecutive positive or negative peaks. For a typical analysis, the pulse rate, SpO2, and respiration rate are calculated using the data points within 60 seconds. Figure 8, depicts a real-time recording of the respiration rate of the subject and which can then be stored in databases for future analysis.
Figure 7. Samples of ECG, Pulse and Respiratory signals
Figure 8. Storing the vital sign parameters in database using google firebase
Table 2. Vital parameters of different subjects
|
Age |
Normal Condition |
Stressed Condition |
|
Pulse Rate |
77.06 ± 9.272 |
100.8 ± 8.324 |
|
Resp. Rate |
16.06 ± 1.162 |
18.15 ± 1.625 |
|
SpO2 |
96.19 ± 3.309 |
98.90 ± 0.652 |
Figure 9. Hardware implemented health monitoring system
In this study, 100 volunteers of different age groups have participated. The mean and standard deviation of the various parameters are shown in Table 2. It is observed that all the parameters were increased under the stressed condition as compared to normal conditions. From the above results, it can be inferred that the pulse and respiration rate of a normal healthy subject tends to lie within the range of 70-80 beats and 14-16 cycles per minute respectively. During rapid breathing, this range further pushes to 90-110 beats and 18-20 cycles per minute respectively.
Moreover, the concerned Databases are updated every 30 seconds with a prime intention to reflect any parametric variation in vital parameters of the subject. This essentially provides more flexibility and reliability to the data acquisition and management system, as even a minute variation in values is immediately updated in the Database for analysis and report synthesis. The final design incorporating all the aforementioned characteristics is shown in Figure 9, which is clinically tested with various subjects whose data are systematically updated in the Database. As an endnote, this data is stored in a web-based server, can be accessed by doctors or other concerned personals at any time point, with essential authentication and certification.
The accuracy and practicality of the data are signified by the obtained result of the aforementioned system for its usage as a Remote Patient Monitoring System based on real-time monitoring using IoT. Further, the incorporated networking characteristics and related user warning algorithm enhance its usability by providing us with a real-time platform for timely parametric acquisition and its related analysis. Moreover, the inherent IoT capability ensures a smart system that alerts the user in an event of a medical emergency thereby providing the subjects with timely and accurate treatment. As a future scope of improvement, the device can further be enhanced with more parameters monitoring and also to detect typical diseases like Apnea, Hypertension or Hypotension, Hypothyroidism, Hemochromatosis, and other cardiovascular ailments, etc.
We would like to express our special gratitude and thanks to all staff of the Department of Electronics and Communication Engineering, JSS Academy of Technical Education, Bengaluru for their support and cooperation with this work.
[1] Khandpur, R.S. (2003). Handbook of Biomedical Instrumentation. Tata McGraw- Hill Education, Biomedical Engineering.
[2] Jain, N.P., Jain, P.N., Agarkar, T.P. (2012). An embedded, GSM-based, multiparameter, real-time patient monitoring system and control – An implementation for ICU patients. 2012 World Congress on Information and Communication Technologies, Trivandrum, India. https://doi.org/10.1109/WICT.2012.6409218
[3] Wang, J.X., Yu, X., Ren, L., Tang, S.Y. (2016). Design and development of ICU intelligent medicine management system based on MVC. 2016 IEEE International Conference on Bioinformatics and Biomedicine (BIBM), Shenzhen, China. https://doi.org/10.1109/BIBM.2016.7822662
[4] Yeldose, A., Dhanyaja, N., Jose, J.T., Anju, S.S. (2013). Integration of ICU data into electronic medical records-issues and solutions. 2013 IEEE Conference on Information & Communication Technologies, Thuckalay, India. https://doi.org/10.1109/CICT.2013.6558140
[5] Javorka, M., Krohova, J., Czippelova, B., Turianikova, Z., Lazarova, Z., Wiszt, R., Faes, L. (2018). Towards understanding the complexity of cardiovascular oscillations: Insights from information theory. Comput. Biol. Med., 98: 48-57. https://doi.org/10.1016/j.compbiomed.2018.05.007
[6] Serhani, M.A., El Kassabi, H.T., Ismail, H., Nujum Navaz, A. (2020). ECG monitoring systems: Review, architecture, processes, and key challenges. Sensors, 20(6): 1796. https://doi.org/10.3390/s20061796
[7] Koltowski, L., Balsam, P., Glowczynska, R., Peller, M., Maksym, J., Blicharz, L., Niedziela, M., Maciejewski, K., Opolski, G., Grabowski, M. (2017). Comparison of Kardia Mobile (one lead ECGs records) with 12-lead ECGs in 100 consecutive patients with various cardiovascular disorders. EP Eur., 19: iii353.
[8] Lin, Y., Bueno-Barrachina, J.M., Prats-boluda, G., Rodriguez de Sanabria, R., Garcia-Casado, J. (2017). Wireless sensor node for non-invasive high precision electrocardiographic signal acquisition based on a multi-ring electrode. Meas. J. Int. Meas. Confed., 97: 195-202. https://doi.org/10.1016/j.measurement.2016.11.009
[9] Babusiak, B., Borik, S., Smondrk, M. (2020). Two-electrode ECG for ambulatory monitoring with minimal hardware complexity. Sensors, 20(8): 2386. https://doi.org/10.3390/s20082386
[10] AD8232, Single-Lead, Heart Rate Monitor Front End, 2012-2018 Analog Devices, Inc. https://www.analog.com/en/products/ad8232.html#product-overview.
[11] Jubran, A. (2004). Pulse oximetry. Intensive Care Medicine. 30(11): 2017-2020. https://doi.org/10.1007/s00134-004-2399-x
[12] Tremper, K.K., Barker, S.J. (1989). Pulse oximetry. Anesthesiology: The Journal of the American Society of Anesthesiologists, 70(1): 98-108. https://doi.org/10.1097/00000542-198901000-00019
[13] Yelderman, M., New, W. (1983). Evaluation of pulse oximetry. Anesthesiology: The Journal of the American Society of Anesthesiologists, 59(4): 349-351. https://doi.org/10.1097/00000542-198310000-00015
[14] MAX30102 High-Sensitivity Pulse Oximeter and Heart-rate Sensor for Wearable Health, Maxim Integrated. https://www.maximintegrated.com/en/products/interface/sensor-interface/MAX30102.html.
[15] Gupta, M., Qudsi. H. (2013). Low-cost, thermistor based respiration monitor. 39th Annual Northeast Bioengineering Conference, pp. 287-288. https://doi.org/10.1109/NEBEC.2013.111
[16] Das, T., Guha, S., Banerjee, N., Basak, P. (2017). Development of thermistor based low cost high sensitive respiration rate measurement system using audio software with audio input. Third International Conference on Biosignals, Images and Instrumentation (ICBSII), pp. 1-3. https://doi.org/10.1109/ICBSII.2017.8082283
[17] Alsalemi, A., Al Homsi, Y., Al Disi, M., Ahmed, I., Bensaali, F., Amira, A., Alinier, G. (2017). Real-time communication network using firebase cloud IoT platform for ECMO simulation. IEEE International Conference on Internet of Things (iThings) and IEEE Green Computing and Communications (GreenCom) and IEEE Cyber, Physical and Social Computing (CPSCom) and IEEE Smart Data (SmartData), pp. 178-182. https://doi.org/10.1109/iThings-GreenCom-CPSCom-SmartData.2017.31
[18] Khan, S., Rasheed, A., Marwat, M.U., Ali, A. (2014). Portable telehealth aggregation manager: A novel approach for remote health monitoring. 4th International Conference on Engineering Technology and Technopreneuship (ICE2T), pp. 309-313. https://doi.org/10.1109/ICE2T.2014.7006268
[19] Xu, G., Yuan, J.R. (2004). A programmable analog-to- digital converter. 2004 IEEE International Symposium on Circuits and Systems (IEEE Cat. No.04CH37512), pp. 585-588. https://doi.org/10.1109/ISCAS.2004.1328262
[20] ADS1113, ADS1114, ADS1115, Texas Instruments, SBAS444D MAY 2009 Revised January 2018. (Data sheets).
[21] Understanding the I2C Bus, Texas Instruments, SLVA704 June 2015. (Data sheets).
[22] Raspberry Pi Compute Module 3, Raspberry Pi (Trading) Ltd., 2016. (Data sheets).