Ali Mohammad Alqudah* | Amin Alqudah
© 2021 IIETA. This article is published by IIETA and is licensed under the CC BY 4.0 license (http://creativecommons.org/licenses/by/4.0/).
OPEN ACCESS
The wave starting from the beginning of the S wave until the end of the T wave is known as ST-T. ST-T wave extraction and classification is a very important technique in the diagnosis of myocardial ischemia. The myocardial ischemia which is also called cardiac ischemia can cause damage to the heart muscle. A sudden, severe blockage of a coronary artery may lead to a heart attack or other severe complications, and may also cause serious abnormal heart rhythms which will be reflected in the electrocardiogram trace. This paper aims to automate the real-time technique detection of ST-T waves that help in the diagnosis of myocardial ischemia and to classify the patient state. The proposed method uses the ECG wave morphological features that have been extracted using the detrended cumulative area, which is used to detect the ST-T wave. The proposed technique was tested and validated and it revealed promising results. The proposed method scored a sensitivity of 90.13% for K-mean Clustering and 96.3% for the SVM classifier for the ST interval detection. The method was tested on the European ST-T Database.
ECG, automated detection, ST-T wave, SVM, K-mean, classification
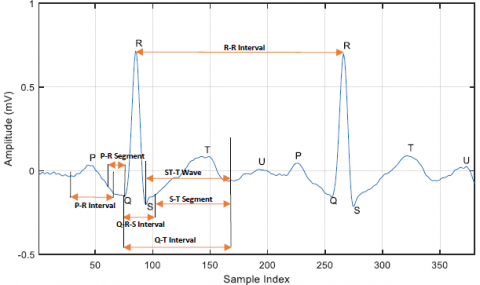
The Electrocardiogram (ECG) is an electrical recording of heart behavior and it's crucial for investigating cardiac abnormalities in a human. The ECG recordings are typically examined visually by a physician for important features. Besides, ECG is usually used as an input parameter for patient health decision systems based on the patient’s health records. Figure 1 shows a part of ECG recording with the fiducial points of importance in any ECG signal; P wave, QRS complex, and T-wave [1-5].
Figure 1. Part of ECG signal and important peaks (points) and intervals of it are marked
Coronary artery disease is developed when coronary arteries, which are the major blood vessels that supply the heart with blood, oxygen, and nutrients become damaged or diseased. This will cause the Flat, down-sloping, or depressed of the ST-T wave in the ECG. The changes in time and morphological features of an ST-T wave such as amplitude, time, and duration can be used as an electrical instability that indicates increasing susceptibility of diseases and thus leading to sudden cardiac death. The ST-T wave consists of two important diagnostic waves: ST-segment and T-wave; both are the most popular diagnostic parameters for coronary artery disease; they represent a state of unchanged polarization. Any significant change of this ST-T wave level from the baseline indicates an ischemic heart condition [2, 6-8].
Cholesterol-containing deposits (plaque) in arteries and inflammation are considered as the main precursors for coronary artery disease. It can become catastrophic, resulting in myocardial infarction with affected myocardium that is reflected in the occurrence of lethal arrhythmias. Lethal arrhythmias can cause sudden cardiac death and are divided into two types: bradyarrhythmia and tachyarrhythmia [9-11]. Lethal arrhythmias mainly result from structural and functional abnormalities of the myocardium. But primary ECG diseases, which are caused by gene abnormalities may also cause lethal arrhythmias without such abnormalities [12-14].
There is a chain of events that develop in sequence because of ischemia: diastolic dysfunction (poor relaxation), systolic dysfunction (weak contraction), ECG changes (ST-deviation), angina pectoris, and finally infarction [1]. Several studies have demonstrated that myocardial ischemia modifies segments and waves of left ventricular depolarization and repolarization (QRS complex and ST-T wave, respectively) [8, 15, 16]. In the next section, we will survey the recent related works related to the topic of the paper.
Recently, many methods have been developed to extract and classify ST-T interval. Correa et al. [17] developed a method based on the vectorcardiogram (VCG) with parameters based on the T-wave loop morphology. The authors reported that they used the ST Vector Magnitude Area (aSTVM), the T-wave Vector Magnitude Area (aTVM), the ST-T Vector Magnitude Difference (ST-TVD), the T-wave Vector Magnitude Difference (TVD), the conventional ST-Change Vector Magnitude (STCVM), and the Spatial Ventricular Gradient (SVG) as detection techniques. They used a statistical minute-by-minute PTCA comparison against the control situation and showed that ischemic monitoring reached a sensitivity of 90.5%. Garcia et al. [2] developed their technique for the ST-T complex using the Karhunen-Loeve transform for the analysis (Laguna et al., 1999). Garcia et al. provided a new technique based on changes in the repolarization phase (ST-T complex) in the cardiac cycle by applying a detection algorithm to the filtered root mean square (RMS) series of the differences between the beat segment (ST-segment) and an average pattern segment [2].
Papaloukas et al. [4] proposed a method capable of extracting events from noisy ECG where the signal to noise ratio (SNR) is very low. An ECG was introduced to analyze the original markovian approach system for ischemia detection. The system built for online beat detection and segmentation, with precise localization of all beats and particularly of the PQ and ST segments. Moreover, Pang et al. [3] created a novel real-time algorithm which focusing on detecting ischemia in the proposed ECG signal. The built algorithm was based on home-oriented care devices. These devices can automatically diagnose the ECG and detect the heart risks outside the hospitals. The algorithm was based on real-time detecting of R-peaks, time-domain parameters of ECG, advanced morphologic parameters using Karhunen-Loeve transform. The classification was done using adaptive neuro-fuzzy logic.
Smrdel and Jager [16] proposed by a novel automated system that improved the detection of transient ischemic and heart rate-related ST-segment episodes in the "real-world" and it was applied in 24h ambulatory ECG signals. The method was based on a combination of traditional time-domain and Karhunen-Loeve transform-based approaches. This system extracts the QRS complex and ST-segment morphology, by mimicking human examination of feature vector time series and their trends, then it tracks the time-varying ST-segment reference level owing to clinically unimportant. Papadimitriou et al. [18] developed a supervising network self-organizing map (sNet-SOM) model for designing computationally effective methods for the ischemic detection problem and for other applications that share similar characteristics.
A rule-based ST-segment waveform morphology classification method was proposed by Xu et al. [19]. The method can be used to accurately classify the waveform morphology and ST-segment even in a relatively large dataset. The authors report that they have used a total of 17,314 ST segments to classify them into two classes (Normal and Abnormal), then the abnormal classes have been classified into five sub-classes. The method achieved a classification accuracy and sensitivity for the testing data of 90.1% and 87.73%, respectively. Finally, Kayikcioglu et al. [20] proposed a time-frequency distribution-based approach for myocardial infarction detection by classification of ST-Segment waveform from multi-lead ECG signals. The authors reported that they have tested the method for classification of the ST-Segment waveform into four classes using a large dataset. The method was based on Ensemble Classifier Subspace k-NN, and the accuracy and the sensitivity of 92.58% and 93.61, respectively.
As a summary of the surveyed literature, most of the papers provide complex methods that depend on vector ECG (VECG), modeling the ST-T wave, or detection of the ST-T wave by other waves or segments instead of detecting the S-T wave itself. Also, all method's sensitivity is lower than 94% which is low for such a crucial problem. In this paper, we proposed a new time-domain method using the morphology of ECG beat to detect the ST-T segmented which will be used in the detection of cardiac ischemia. The proposed method can be used in a real-time manner and can detect the changes directly. The method has been tested using the European ST-T Database.
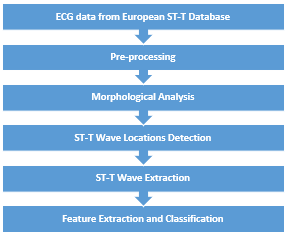
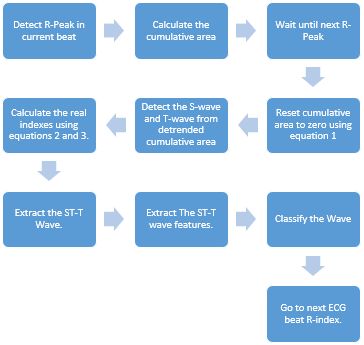
In this section, the used dataset of ECG signals with ST-T variations and the methodology including the used machine learning (ML) and the training process are all discussed in details. Figure 2 illustrates a block diagram that shows the stages of the proposed methodology which are explained in details in the following sub-sections.
Figure 2. Proposed technique general diagram
3.1 ECG dataset
The ECG data used in this study is part of the European ST-T database which is available online for free at the PhysioNet website at (https://physionet.org/content/edb/1.0.0/). The subjects involved in collecting the dataset were 70 men aged 30 to 84, and 8 women aged 55 to 71. The dataset contains 90 annotated ECG records. In this paper, in order to ensure the unbiasing in the results of the proposed methodology, we have selected a random testing set which consists of 40 records from 40 different patients of one hour in length and sampled at 250 Hz in order evaluate the proposed methodology [21, 22].
3.2 Pre-processing
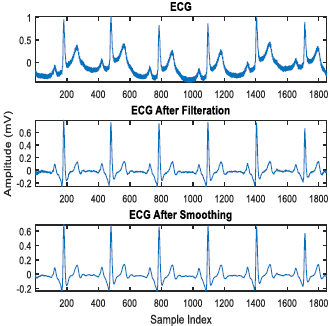
To eliminate low and high frequency noise, such as baseline wandering and power line interference, two filters have been used, the first one is a 4th order Butterworth bandpass filter with a bandwidth of 0.2 - 100 Hz. This filter will remove the baseline wandering. The second filter have been implemented in order to minimize the power line interferences. It was a 2nd order Butterworth notch filter which has been applied to cancel the 50/60 Hz power line interference.
The second stage of the pre-processing is the moving average filter with a window length of 7 samples. The moving average filter is used to decrease the effect of high frequency noise and to smooth the ECG which can be effective for further processing, and in ST-T wave start and endpoint detection [5, 23, 24]. Figure 3 shows the input and the output of the pre-processing stage; where the first row shows the raw ECG signal before applying pre-processing; the second row shows the ECG signal after applying the pre-processing techniques and finally, the third row shows the filtered ECG signal after applying the smoothing technique.
Figure 3. Comparing ECG before and after applying the preprocessing and the smoothing techniques
3.3 Morphological Analysis for single ECG beat
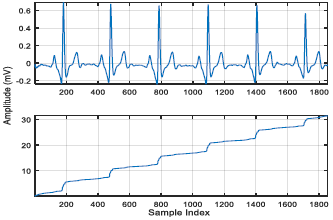
Figure 4. The ECG signal above with the calculated Cumulative area of it down
The purpose of this step is to localize the ST-T wave start and endpoints, then to extract them using these points. First, we must extract each single ECG beat alone and find the point at which the ECG signal starts rising up and falling down; the ECG amplitude changes to represent the electrical activity of the heart. To do so, the cumulative area of ECG is calculated and because the S-wave is in the negative part of the ECG; the absolute value of the ECG was taken then the cumulative area was calculated [25]. Figure 4 shows the ECG signal with its calculated cumulative area. The first row shows the signal results from the preprocessing stage which is ready for further processing; and the second row shows the cumulative area calculated for this signal that will be used to detect the starting and ending points of the ECG beat.
The start and the end points of each ECG beat which will used later to reset the cumulative area for every single beat. This step is done by returning the cumulative area curve to zero after the end of each ECG beat and before the start of the next ECG beat. Reset-to-zero for the cumulative area between the ECG beats is very important to detect and localize the ST-T Wave.
The main wave that makes big changes on the cumulative curve is the QRS complex which elevates the curve from one level to another where the P and T waves have smaller effect (slight elevation). To detect the start and endpoints of each area, the time average between two consecutive beats is calculated and used to reset the time commutative area of each beat using Eq. (1) [25]. The result is shown in Figure 5.
Reset Time $=\frac{R_{i}+R_{i+1}}{2}$ (1)
where, Ri is the R wave peak index in the current ECG beat and Ri+1 is the R wave peak index in the next ECG beat.
Figure 5. Resetted cumulative area using the proposed algorithm and Eq. (1)
After each cumulative area start and end points have calculated, the areas are separated and detrended. Detrending of the separated cumulative area is very important since these areas will be used in further processing for detecting ST-T segments. Since the cumulative area of each ECG will start raising at the start of the ECG and fall at the end of it, each ECG wave will represent a noticeable change in the cumulative area signal. To make these changes clear and easy to detect in the cumulative area, the polynomial trend of the cumulative area is removed. The polynomial trend of the cumulative area results from the ECG baseline wandering and morphological changes. Figure 6 shows the cumulative area before and after detrending; this detrended cumulative area will be used to detect the start and end points of each ST-Segment.
After detrending the separated cumulative area, the peaks which reflect the waves in ECG can be detected. The last two changes in the cumulative area represented the S-wave and T-wave. If we detect these points, we can extract the ST-T wave. In order to detect these points exactly, the first derivative of the detrended cumulative area is calculated. The first derivative of the cumulative area is shown in Figure 7. The second-largest peak in the derivative (represents the S fall in QRS complex) occurs immediately after the largest peak (represent the Q fall in QRS complex). The last peak represents the termination of the P wave. Both peaks are our targets. To detect the peak that represents the S-wave fall, the peak amplitudes are sorted in descending order and the second one is chosen. While for the T-wave the last peak in all derivatives is selected to detect this wave. The results are shown in Figure 7b.
Figure 6. The cumulative area of a single ECG beat before detrending above and after detrending down
Figure 7. The first derivative of the detrended cumulative area above with the detected ST-T Segment Start and Endpoints and the same points in the detrended cumulative area down
After the points related to the ST-T wave are detected, the reallocation of these points concerning the R-peak index is shown in Eqns. (2) and (3):
$R S_{\text {index }}=$ Rpeakindex $+$ Detected_S_index (2)
$R T_{\text {index }}=$ Rpeakindex $+$ Detected_T_index (3)
where, Rpeakindex is the sample index of the R-Wave, Detected_S_index is the detected S wave index, and Detected_T_index is the detected T wave index. Using these equations, the real ECG index represents the detected ST-T wave can be calculated and used to extract the wave. Figure 8 shows the real ECG detected points and Figure 9 shows an example of the extracted ST-T wave. This figure shows the detect peaks using detrended cumulative area first derivative and their corresponding location on the ECG beat as vertical lines falls from the detrended cumulative area to ECG beat.
Figure 8. Detected real S-wave and T-wave indexes
Figure 9. Example of the extracted ST-T wave
3.4 Real-time algorithm
Figure 10. Real-time algorithm
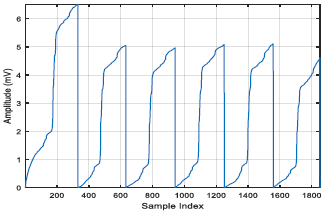
After we determine how to detect and extract the ST-T wave for each single ECG beat, we can use them in our proposed real time algorithm. A real time algorithm using the proposed method is shown in Figure 10. Examples of the extracted ST-T waves using this algorithm are shown in Figure 11.
Figure 11. Examples of extracted waves using a real-time algorithm
3.5 Features extraction
For each detected ST-T wave, there are two main features used to classify the wave whether it is normal or not. These features are the duration of the wave and the peak difference between the maximum and minimum voltage in each extracted segment. These features are directly related to the status of the patient because these values are direct changes when there is an abnormality in the status of the patient.
3.6 The classifiers
3.6.1 K-mean clustering
K-means classifier is one of the simplest unsupervised learning algorithms, the main purpose of the K-means clustering algorithm is to divide data with a size of M points and N dimensions into K clusters, so that the within-the same cluster, the sum of squares is minimized. The main idea of the clustering algorithm is to define K centers, one for each cluster [26, 27]. These K centers should be placed in a smart way in order to get better results. The next step is to take each point belonging to a given data set and associate it to the nearest center using the minimal sum of squares against all centers [28, 29]. This method is used to classify the ST-T segment by clustering the two extracted features (duration and peak difference).
3.6.2 Support Vector Machine (SVM)
Support Vector Machine (SVM) classifier is a supervised algorithm used to classify data into two categories. The SVM algorithm uses specific training data set to build a model in order classify new examples. The SVM aims to determine the optimal separating hyperplane of a dataset which maximizes the margin between the nearest data point and the separating hyperplane [27]. SVM has been successfully applied to wide range of real-world applications including face detection, recognition, and verification, text categorization, image retrieval, handwritten character, and digit recognition [28]. In this paper, ST-T duration and the ST-T wave peak difference between the maximum and minimum voltage in each extracted segment fed into SVM classifier to achieve the output goal of classifying the ST-T waves into normal and abnormal [29, 30]. The ST-T duration is calculated by finding the difference between the T-Wave end time and the S-Wave start time, where the ST-T wave peak difference is calculated by finding the difference between the maximum peak in the ST-T wave and the minimum peak in the ST-T wave. These values are selected to be calculated based on the fact that the changes in the ST-T wave are mainly two: the first one is the elagaonation of the T-wave which is reflected using the ST-T wave time difference. The second one is the elevation or depression of the S-wave which is reflected using the ST-T wave peak difference [29].
Figure 12. Duration feature clustering using KNN
Figure 13. Peak difference feature clustering using KNN
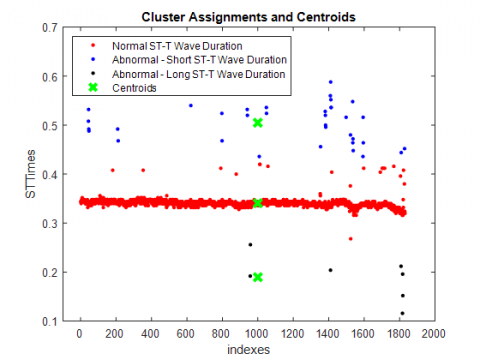
The performance of the proposed technique was experimentally evaluated. The European ST-T database has been used for validation purposes. Signal preprocessing is followed by ST-T Segment Extraction, where the feature extraction is used to decide whether the status of the extracted ST-T waves is normal or abnormal. The features for the extracted waves which are previously mentioned in section 2.4 were calculated and used to form a data set of 228 ECG records. The features’ data set is then fed into the K-means clustering and SVM classifier, and the entire extracted waves were classified. The classifier used to classify both the duration and the peak difference into three classes as shown in Table 1. For K-mean clustering method, the three classes are fed to it while only two classes are fed to the SVM classifier. The output of duration and peak difference features clustered using K-mean Clustering are shown in Figure 12 and Figure 13, respectively. The output of duration and peak difference features classified using the SVM classifier are shown in Figure 14.
Table 1. Classes of features for K-mean clustering
|
Feature |
Class 1 |
Class 2 |
Class 3 |
|
Duration |
Short ST-T Duration |
Normal ST-T Duration |
Long ST-T Duration |
|
Peak Difference |
Small Peak Difference |
Normal Peak Difference |
Large Peak Difference |
Table 2. Comparison with existing methods
|
Ref # |
Reference |
|
Sensitivity % |
Year of Publication |
Detection Type |
Data size and annotations used |
|
2 |
Garcia et al. |
|
85.0 |
2000 |
ST-segment episodes |
228 records |
|
3 |
Pang et al. |
|
81.30 |
2005 |
ST-segment episodes |
As above |
|
4 |
Papaloukas et al. |
|
86.00 |
2000 |
ST-segment episodes |
As above |
|
5 |
Andreao et al. |
|
83.00 |
2004 |
ST-segment episodes |
As above |
|
16 |
Smrdel and Jager. |
|
81.30 |
2004 |
ST-segment episodes |
As above |
|
18 |
Papadimitriou et al. |
|
82.80 |
2001 |
ST-segment episodes |
As above |
|
19 |
Xu et al. |
|
87.73 |
2015 |
ST-segment episodes |
As above |
|
20 |
Kayikcioglu et al. |
SVM Medium Gaussian |
89.84 |
2020 |
ST-segment episodes |
As above |
|
k-NN Weighted Cityblok |
91.61 |
2020 |
ST-segment episodes |
As above |
||
|
Ensemble Subspace k-NN |
91.44 |
2020 |
ST-segment episodes |
As above |
||
|
This paper |
K-mean |
90.13 |
2021 |
ST- Wave episodes |
40 records with 1851 ST-waves |
|
|
SVM |
96.3 |
|||||
Figure 14. SVM classification model using the peak difference and duration features
The proposed technique was evaluated successfully for the extraction of an ST-T wave with high precision and classification. The system succeeded in segmenting and extracting segments. A comparison of the proposed technique with previous methods is shown in Table 2. The main metric is the sensitivity [31, 32]; high sensitivity means high probability to test positive when the disease is present [33, 34].
Sensitivity $=\frac{T P}{T P+F N}$ (4)
where, TP is the number of annotated events detected by the algorithm (true positives), whereas FN is the number of annotated events missed by the algorithm (false negatives) [35].
A comparison of the proposed method with previous methods shows that the proposed method has advantages over all previous methods; the advantages include robust morphology-based technique, high sensitivity, and real-time detection and classification of ST-T wave. By comparing the proposed method for example with Papaloukas et. al. (the method which has the highest sensitivity of the previous methods), the proposed method has a sensitivity of 90.13% for K-mean Clustering and 96.3% for SVM. This means that the proposed method has an advantage over previous methods of being robust and very sensitive in detecting and classifying abnormalities which could be due to morphological methods used.
Changes in the morphology of ECG in general and especially in the ST-segment is an important indicator of heart disease, especially for myocardial ischemia. Providing early detection and extraction of ST-T waves can provide useful and informative data that can help physicians to manage myocardial ischemia, especially in telemedicine applications. In this work, a new, robust, and high-precision technique for ST-T wave detection and extraction has been presented. This technique provides a precise and effective detection and classification method for the ST-T wave. The technique is based on the computation of the cumulative area of the ECG signal. The technique then resets this area to zero after each ECG beat. After that, detrending the cumulative area to remove any polynomial trend is executed. Next, the derivative of the detrended area is calculated. Finally, the technique detects the points of interests which are related to the S-Wave and the T-Wave using the output of the derivative step. The proposed methodology has been implemented and evaluated using the PhysioNet European ST-T Database. The proposed algorithm successfully extracted all ST-T waves in the used ECG signal.
After determining whether the signal is normal or abnormal, the output data is passed to K-means clustering and SVM classifier to perform classification. The technique showed high sensitivity using the two classifiers. The proposed method is important for detecting myocardial ischemia with high precision due to its exact extraction of the ST-T wave. The method showed very high sensitivity comparing with other methods used for detecting myocardial ischemia. This means that the medical doctors can use the proposed method to support their decision in the diagnosis of patients, in other words, the proposed method is able to replace the currently used methods for detecting myocardial ischemia.
In our literature survey, in comparison with previous work, our method has three novelty attributes. First, our method is developed using time-domain morphological features of the ECG signal. Second, our method revealed better performance all over two-class and multi-classes methods. Third, our method speed is suitable for telemedicine systems. As future work, we intend to apply decision fusion and feature fusion algorithms by combining time domain and frequency domain features.
The authors would like to thank the anonymous reviewers for their valuable comments.
[1] Alqudah, A.M. (2017). Fuzzy expert system for coronary heart disease diagnosis in Jordan. Health and Technology, 7: 215-222. https://doi.org/10.1007/s12553-017-0178-2
[2] Garcia, J., Sornmo, L., Olmos, S., Laguna, P. (2000). Automatic detection of ST-T complex changes on the ECG using filtered RMS difference series: application to ambulatory ischemia monitoring. IEEE Trans Biomed Eng, 47(9): 1195-201. https://doi.org/10.1109/10.867943
[3] Pang, L., Tchoudovski, I., Bolz, A., Braecklein, M., Egorouchkina, K., Kellermann, W. (2005). Real time heart ischemia detection in the smart home care system. 2005 IEEE Engineering in Medicine and Biology 27th Annual Conference, 4: 3703-6. https://doi.org/10.1109/IEMBS.2005.1617286
[4] Papaloukas, C., Fotiadis, D.I., Likas, A., Liavas, A.P., Michalis, L.K. (2000). A robust knowledge-based technique for ischemia detection in noisy ECGs, 2: 768-771. https://doi.org/10.1109/kes.2000.884159
[5] Andreao, R.V., Dorizzi, B., Boudy, J., Mota, J.C.M. (2004). ST-segment analysis using hidden markov model beat segmentation: application to ischernia detection, 381-384. https://doi.org/10.1109/cic.2004.1442952.
[6] Sadhukhan, D., Mitra, M. (2012). R-peak detection algorithm for ecg using double difference and rr interval processing. Procedia Technology, 4: 873-877. https://doi.org/10.1016/j.protcy.2012.05.143
[7] Afsar, F.A., Arif, M., Yang, J. (2008). Detection of ST segment deviation episodes in ECG using KLT with an ensemble neural classifier. Physiol Meas, 29(7): 747-60. https://doi.org/10.1088/0967-3334/29/7/004
[8] Kawamura, T., Yamamoto, R., Wakai, K., Ichihara, Y., Mizuno, Y., Kojima, M., Aoki, R., Tamakoshi, A., Ohno, Y. (1996). Newly developed ST-T abnormalities on the electrocardiogram and chronologic changes in cardiovascular risk factors. The American Journal of Cardiology, 77(10): 823-827. https://doi.org/10.1016/s0002-9149(97)89175-8
[9] Laguna, P., Moody, G.B., García, J., Goldberger, A.L., Mark, R.G. (1999). Analysis of the ST-T complex of the electrocardiogram using the Karhunen—Loeve transform: adaptive monitoring and alternans detection. Medical & Biological Engineering & Computing, 37(2): 175-189. https://doi.org/10.1007/bf02513285
[10] Belfort, M.A., Saade, G.R. (2011). ST segment analysis (STAN) as an adjunct to electronic fetal monitoring, Part II: clinical studies and future directions. Clin Perinatol, 38(1): 159-67. https://doi.org/10.1016/j.clp.2010.12.010.
[11] Dervaitis, K.L., Poole, M., Schmidt, G., Penava, D., Natale, R., Gagnon, R. (2004). ST segment analysis of the fetal electrocardiogram plus electronic fetal heart rate monitoring in labor and its relationship to umbilical cord arterial blood gases. Am J Obstet Gynecol, 191(3): 879-84. https://doi.org/10.1016/j.ajog.2004.05.059
[12] Dhruva, V.N., Abdelhadi, S.I., Anis, A., Gluchman, W., Hom D., Dougan, W., Kaluski, E., Haider, B., Klapholz, M. (2007). ST-Segment Analysis Using Wireless Technology in Acute Myocardial Infarction (STAT-MI) trial. Journal of the American College of Cardiology, 50(6): 509-13. https://doi.org/10.1016/j.jacc.2007.04.049
[13] Fischell, T.A, Fischell, D.R., Fischell, R.E., Virmani, R., DeVries, J.J., Krucoff, M.W. (2006). Real-time detection and alerting for acute ST-segment elevation myocardial ischemia using an implantable, high-fidelity, intracardiac electrogram monitoring system with long-range telemetry in an ambulatory porcine model. Journal of the American College of Cardiology, 48(11): 2306-2314. https://doi.org/10.1016/j.jacc.2006.07.058
[14] Jernberg, J., Lindahl, B., Wallentin, L. (1999). ST-segment monitoring with continuous 12-lead ECG improves early risk stratification in patients with chest pain and ECG nondiagnostic of acute myocardial infarction. Journal of the American College of Cardiology, 34(5): 1413-1419. https://doi.org/10.1016/s0735-1097(99)00370-8
[15] Manriquez, A.I., Zhang, Q.H. (2007). An algorithm for QRS onset and offset detection in single lead electrocardiogram records. Conf Proc IEEE Eng Med Biol Soc, 2007: 541-4. https://doi.org/10.1109/IEMBS.2007.4352347
[16] Smrdel, A., Jager, F. (2004). Automated detection of transient ST-segment episodes in 24h electrocardiograms. Medical & Biological Engineering & Computing, 42(3): 303-311. https://doi.org/10.1007/bf02344704
[17] Correa, R., Arini, P.D., Correa, L.S., Valentinuzzi, M., Laciar, M. (2014). Novel technique for ST-T interval characterization in patients with acute myocardial ischemia. Comput Biol Med, 50: 49-55. https://doi.org/10.1016/j.compbiomed.2014.04.009
[18] Papadimitriou, S., Mavroudi, S., Vladutu, L., Bezerianos, A. (2001). Ischemia detection with a self-organizing map supplemented by supervised learning. IEEE Trans Neural Netw, 12(3): 503-15. https://doi.org/10.1109/72.925554
[19] Xu, M.F., Wei, S., Qin, X., Zhang, Y.T., Liu, C.Y. (2015). Rule-Based Method for Morphological Classification of ST Segment in ECG Signals. Journal of Medical and Biological Engineering, 35(6): 816-823. https://doi.org/10.1007/s40846-015-0092-x
[20] Kayikcioglu, I., Akdeniz, F., Köse, C., Kayikcioglu, T. (2020). Time-frequency approach to ECG classification of myocardial infarction. Computers & Electrical Engineering, 84: 106621. https://doi.org/10.1016/j.compeleceng.2020.106621
[21] Taddei, A., Distante, G., Emdin, M., Pisani, P., Moody, G.B., Zeelenberg, C., Marchesi, C. (1992). The European ST-T database: standard for evaluating systems for the analysis of ST-T changes in ambulatory electrocardiography. European Heart Journal, 13(9): 1164-1172. https://doi.org/10.1093/oxfordjournals.eurheartj.a060332
[22] Jain, A., Goyal, Y., Patel, A. (2012). ECG analysis system with event detection based on daubechies wavelets. 2012 International Conference on Electronics Engineering and Informatics, Singapore, pp. 145-149. https://doi.org/10.7763/IPCSIT.2012.V49.26
[23] Bulusu, S.C., Faezipour, M., Ng, V., Nourani, M., Tamil, L.S., Banerjee, S. (2011). Transient ST-segment episode detection for ECG beat classification, 121-124. https://doi.org/10.1109/lissa.2011.5754171
[24] Stone, P.H. (2005). ST-segment analysis in ambulatory ECG (AECG or Holter) monitoring in patients with coronary artery disease: clinical significance and analytic techniques. Ann Noninvasive Electrocardiol, 10(2): 263-78. https://doi.org/10.1111/j.1542-474X.2005.10203.x
[25] Alqudah, A.M. (2017). An enhanced method for real-time modelling of cardiac related biosignals using Gaussian mixtures. Journal of Medical Engineering & Technology, 1-12. https://doi.org/10.1080/03091902.2017.1382587
[26] Orhan, U., Hekim, M., Ozer, M. (2011). EEG signals classification using the K-means clustering and a multilayer perceptron neural network model. Expert Systems with Applications, 38(10): 13475-13481. https://doi.org/10.1016/j.eswa.2011.04.149
[27] Ben-Hur, A., Weston, J. (2010). A user’s guide to support vector machines. Data mining techniques for the life sciences: Springer, 609: 223-239. https://doi.org/10.1007/978-1-60327-241-4_13
[28] Cardona, A., Zareba, K.M., Nagaraja, H.N., Schaal, S.F., Simonetti, O.P., Ambrosio, G., Raman, S.V. (2018). T‐wave abnormality as electrocardiographic signature of myocardial edema in non‐ST‐elevation acute coronary syndromes. Journal of the American Heart Association, 7(3). https://doi.org/10.1161/JAHA.117.007118
[29] Alqudah, A.M. (2019). Towards classifying non-segmented heart sound records using instantaneous frequency based features. Journal of Medical Engineering & Technology, 43(7): 418-430. https://doi.org/10.1080/03091902.2019.1688408
[30] Alqudah, A., Alqudah, A.M. (2019). Sliding window based support vector machine system for classification of breast cancer using histopathological microscopic images. IETE Journal of Research. https://doi.org/10.1080/03772063.2019.1583610
[31] Alqudah, A.M. (2019). Ovarian cancer classification using serum proteomic profiling and wavelet features a comparison of machine learning and features selection algorithms. Journal of Clinical Engineering, 44(4): 165-173. https://doi.org/10.1097/jce.0000000000000359
[32] Alquran, H., Qasmieh, I.A., Alqudah, A.M., Alhammouri, S., Alawneh, E., Abughazaleh, A., Hasayen, F. (2017). The melanoma skin cancer detection and classification using support vector machine. Applied Electrical Engineering and Computing Technologies (AEECT), 2017 IEEE Jordan Conference on, 2017: IEEE, 1-5. https://doi.org/10.1109/AEECT.2017.8257738
[33] Alqudah, A.M. (2019). AOCT-NET: A convolutional network automated classification of multiclass retinal diseases using spectral-domain optical coherence tomography images. Medical & Biological Engineering & Computing, 58(1): 41-53. https://doi.org/10.1007/s11517-019-02066-y
[34] Al-Sharu, W., Alqudah, A.M. (2019). Enhancing prediction of prosthetic fingers movement based on sEMG using mixtures of features and random forest. International Journal of Recent Technology and Engineering, 8(4): 289-294. https://doi.org/10.35940/ijrte.d6801.118419
[35] Alqudah, A.M., Albadarneh, A., Abu-Qasmieh, I., Alquran, H. (2019). Developing of robust and high accurate ECG beat classification by combining Gaussian mixtures and wavelets features. Australasian Physical & Engineering Sciences in Medicine, 42(1): 149-157. https://doi.org/10.1007/s13246-019-00722-z