Arvind Kumar Cholker | Bode Venkata Kavyateja | Panga Narasimha Reddy*
OPEN ACCESS
In the present study, concrete cubes of 150mm embedded with carbon fibres in different dosages (from 0% to 2% by cement mass) were cast using self-compacting concrete. Two tests were conducted, namely strain sensing and damage sensing on all the samples and co-relation between a fractional change in electrical resistance (FCR) and properties of concrete under compressive load are reported. Strain sensing test was carried out within the elastic region and the co-relationship was achieved in between the strength and change in electrical resistance over time in order to obtain the strain sensing properties of the sample. The findings acquired show that concrete specimens with fiber dosage of 1.5 percent by cement mass produce a stronger correlation between a fractional change in resistance (FCR) and concrete compressive strength which can be used as a stress detecting property. Gage factors of all the specimens were also measured throughout strain sensing tests. Following strain sensing testing, all the samples were tested for the damage sensing test by gradually applying load until failure. The relationship between stress, electrical resistances and strain is established from obtained test results. Results obtained show that the same sample comprising 1.5% fiber by cement mass is able to sense damage and can be linked to the stress-strain curve of concrete that can further be used as NDT approach to obtain stress-strain in concrete if FCR is recognized.
electrical properties, self-compacting concrete, gauge factor, structural health monitoring, universal testing machine, resistivity
Traditional concrete is a concrete matrix consisting of coarse and fine aggregates that efficiently resist compressive stresses. This heterogeneous concrete material can have void /loose/weak packets that drastically lower the load carrying capacity. These weak packages cannot withstand stresses under external force and thus pass these stresses to the adjacent concrete, which results in stress accumulation and resulting in the collapse of the section/part/structure occurs. This has forced the scientists to constantly know the inner body composition and strains of concrete during loading and is expressed in concrete health monitoring.
In the quest to notice the stresses at a given position on the surface/internal parts of the concrete, it is normal practice to attach tension measuring equipment like stain gauges/extensometers, dial gauges etc. on the concrete body [1, 2]. This process provides selective health monitoring but cannot be true for the inner concrete body. Thus, a thorough random structural health monitoring (SHM) of concrete must be observed in a unified manner.
In previous research works it was identified that carbon fibers, unlike other fibers, have a very strong capacity for self-sensing compared with much other fiber. If these fibers are spread randomly in cement body/cement composites, they stimulate self-sensing properties in concrete [3]. These fibers are instantly noticeable to alter the electrical conductivity/ resistance of cement composites that are subjected to loads, which thereby provide the corridor for constant structural health monitoring [3, 4]. Therefore, SHM can be carried out with this method, if the same estate is expanded to concrete, there by substituting internal/integrated equipment and fixtures for concrete. Through this method, health monitoring cuts expenses and also improves structural durability because no integrated sensors are accessible.
Concrete becomes a sensor because it provides electrical sensing authority when carbon fibers are added into the concrete. The material sensing property can be defined by its stress condition as a reaction to electric volumetric resistivity [5]. It was noted that, electrical resistance changes when a longitudinal compressive load is applied to the cement composite specimen, for example when a cube/prismatic specimen is under compressive loading, the electrical conductivity increases (resistance decreases) of the sample due to movement of fibers towards each other and vice versa under tensile loading [5, 6]. Similarly during flexural loading on cement composites, the electrical resistance of compression surface upon loading decreases due to fiber movement towards each other as surface is under compression and the same resistance increases at tension surface during unloading as there is pull in fibers as they move away from each other [5, 7].
Gauge factor (GF) is the term used for measuring ability of concrete reinforced with carbon fiber (self-sensing concrete) towards strain sensing. Gauge factor can be described as the fractional change in electrical resistance (FCR) per unit strain [8] and can be calculated as
$G F=\frac{(\Delta R | R 0)}{(\Delta L | L)}=\frac{(\Delta R | R 0)}{\text { strain }}$ (1)
$F C R=\frac{\Delta R}{R o}$ (2)
where, ΔR is change in electrical resistance; R0 is initial resistance; L is initial length between the probes and ΔL is change in length between the probes.
Many researchers looked at the behavior of cement mortar and cement paste when introduced carbon fiber to samples [5, 9, 10]. Strain [11] and damage sensing [12] properties were investigated [13, 14] on cement composites in multiples of carbon-fibers (CF’s) and carbon nano-tubes (CNT) in different percentages dosage both individually and as well as in combination [15]. Few other researchers have also researched the true implementation of carbon fibers in cement composites for traffic surveillance [16] and SHM [17].
A research lately released on the use of CF’s and CNT’s as cementitious sensors to monitor vibration of structures [18]. They were discovered to be useful for the vibration monitoring of structures via detecting the natural frequencies with these nanos altered cement detectors. The latest research done on columns cast with carbon nano fiber (CNF) in cement and checked for cyclical reverse loading [19], also found useful for health monitoring. It was discovered to be possible to detect damage levels in reinforced concrete (RC) columns that were casted with embedding carbon fiber there by providing health monitoring in real time. However, the correlation between compressive stress and electrical resistance could not be created in the above experiments on the column [5]. Very few studies were also conducted on concrete samples embedded with carbon fibers (CF) /CNT/MWCNT’s where in concrete used was conventional concrete and results focused on the mechanical properties [20-22]. Similar studies by Han et al. [23] found that when 3mm length CF were added to concrete dispersed using ultrasonication method, compressive strength is observed to increase but addition of 6mm CF does not increase the strength.
From literature review it was observed that, the major work in this field was carried on cement/cement composites and mortar paste, when compared to concrete. Therefore here is an attempt to work on concrete rather than cement or mortar specimens [17, 24]. The important objective of this research is to study and find out the percolation threshold of carbon fibres in self-compacting concrete (SCC) specimen (rather than cement composites) by performing and analysing a systematic study on electrical resistivity properties of concrete samples casted with different dosages of carbon fibres by doing self-sensing and damage sensing.
2.1 Material
The concrete mix was made with OPC cement of 43 grade. For all sample preparations tap water was used in the set water/cement proportion (w/c) of 0.4. A surfactant called Dedocylic benesulphonic sodium salt (SDBS), which is a useful dispersion medium for carbon fibers, has also been blended in water to ensure efficient fiber dispersion [16]. Carbon fibers (CF’s) of the type SYC-TR-PU were introduced in the self-compacting concrete (SCC) with different percentages ranging from 0 to 2% with a step-by-step increase of 0.5%. In order to explore stress sensing behavior, damage sensing behaviors, and to obtain the limit of percolation for further research, various dosages of carbon fibers have been introduced. The limit of percolation can be described as the condition where in randomly distributed carbon fiber contact each other and form continues link to provide least electrical resistance. The lowest quantity of fibers needed to obtain this conductive pathway is defined as the percolation threshold [6]. Table 1 presents the characteristics of CF’s used in present study. In order to achieve concrete workability and stronger fiber dispersion, self-compacting concrete (SCC) is prepared in this research. For obtaining SCC, polycarboxylic ether (PCE) based super plasticizer was added 1% by weight of cement. The specific gravity of super plasticizer was 1.08 & had solid contents not less than 32% by weight confirming ASTM C494 Type F standards. Coarse aggregate (CA) of less than 10mm and Zone 4 fine aggregate (FA) was used with specific gravity 2.74 and 2.69, respectively.
Table 1. Properties of carbon fiber
|
Carbon Content |
% |
95 |
|
Electrical Resistivity |
w.cm |
1.54x10⁻³ |
|
Elongation |
% |
2.3 |
|
Tensile Strength |
MPa |
4,810 |
|
Tensile Modulus |
GPa |
225 |
|
Density |
g/cm3 |
1.78 |
|
Filament Diameter |
µm |
6.97 |
|
Length |
Mm |
6 |
2.2 Fabrication of specimen
Using various doses of carbon fibers, concrete cubes of 150 mm were cast. For fabrication of cubes, initially a solution of water and surfactant (SDBS) was made for the preparation of samples using a shear mixer. Later in this solution, carbon fiber was introduced and mixed for 20 min for an even dispersion of the fibers within the solution with the same mixer. The above solution is then blended with dry cement, FA and CA along with 1% super plasticizer and a further mixing is made in a concrete mixer until SCC is obtained. The new blend is then transferred to the metal molds and retained for 24 hours at room temperature (28oC and RH 82%). These samples were removed from moulds after 24 hours followed by curing for 28 days in fresh water. Table 2 presents the SCC match ratio for all the samples. In order to guarantee the used concrete is self-compact concrete only, all the mixes have been tested for slump flow and fresh state results are shown in Table 3 along with their permissible limits and material properties.
2.3 Testing program
Electrical resistance was evaluated using two probe techniques for all samples within the elastic range of loading. During this research, two probe method techniques were chosen as samples were small and the devices used were very accurate in measuring resistance even when voltage and current passed along the same route. Although few studies suggest four probe method rather than probe method [25], two probe method is used in this research, since the loaded sample showed no sensitivity towards resistance when four probe methods were used.
Table 2. Mix proportion of SCC
|
Materials |
Quantity /m3 of concrete in kgs |
Remarks |
||||
|
% 0 CF |
%5 .0 CF |
%1 CF |
1.5 CF |
% 2 CF |
||
|
Cement |
550 |
550 |
550 |
550 |
550 |
PC-43 grade with compressive strength 43 N/mm2 |
|
Carbon Fibers |
0 |
2.75 |
5.5 |
8.25 |
11 |
mm6 Length |
|
Fine Aggregate |
786 |
786 |
786 |
786 |
786 |
Zone-III and FM-2.56 |
|
Coarse Aggregate (10 mm) |
853 |
853 |
853 |
853 |
853 |
F.M-6.88 |
|
Water Readucing Admixture |
5.5 |
5.5 |
5.5 |
5.5 |
5.5 |
PCE based super plasticizer |
|
Surfactant |
0.32 |
0.32 |
0.32 |
0.32 |
0.32 |
Dedocyl Benzenesulphonic acid sodium salt (SDBS) |
|
Water |
220 |
220 |
220 |
220 |
220 |
Tap water with pH 7.1 |
Table 3. Slump flow test results
|
Mix Designation With % of CF |
Flow Dia. (mm) Obtained in 30 seconds |
Permissible range as per EFNARC |
Time for 500mm Dia. (T500) |
Permissible range for T500 as per EFNARC |
|
0 |
740 |
600-850 |
2.6 |
2-5 |
|
0.5 |
725 |
600-850 |
2.9 |
2-5 |
|
1 |
708 |
600-850 |
3.1 |
2-5 |
|
1.5 |
689 |
600-850 |
3.4 |
2-5 |
|
2 |
668 |
600-850 |
3.7 |
2-5 |
The Universal Test Machine (UTM) has been used for both damage and stress sensing tests. For measuring the load and strain UTM was used, while Keysight Digital Multimeter (DMM) analyzed the changes in electrical resistance. The electrical conductive paint was applied on the concrete surface on all samples and copper wires were wounded on the conductive paint surface around the entire perimeter on 4 interior sides, parallel to its end surfaces and perpendicular to the direction of load application as illustrated in Figure 1. Only the top and bottom cables of copper were connected to the DMM.
Figure 1. Specimen details
2.3.1 Testing for strain sensing
Each cube specimen was loaded up to 240kN load and unloaded at the same velocity during the strain sensing test experiment. With a load speed of 1.5kN/sec, the load was gradually increasing. To monitor the strain sensing property, the sample was loaded and unloaded for 3 cycles. During this experiment load was measured by UTM and electrical resistance by DMM.
2.3.2 Testing for strain sensing
In this test, each sample was loaded until failure at 1.5 kN /sec loading rate. During the experiment, stress, resistance and load were recorded and their behavior was explored. Figure 2 illustrate the actual experimental configuration for both damage and strain sensing tests.
Figure 2. Experimental setup
3.1 Electrical investigation
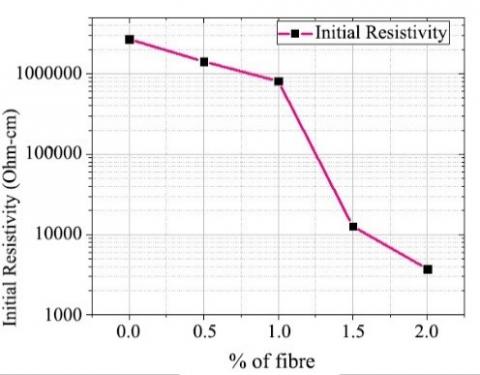
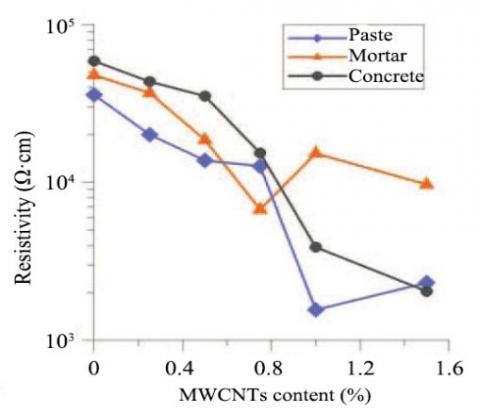
By connecting a DMM to the specimen and waiting for 2 minutes to develop polarization of materials, an initial resistance (prior to load application) of all specimens was measured. Figure 3 shows the original resistivity of all the specimens. It is observed that, the initial resistivity decreases steadily from 0% to 1% fiber dosage, drastically decreases at 1.5%, and mildly decreases at 2 % fiber dosage. It can therefore be said that a percolation limit of 1.5% carbon fiber may be taken from specimens comprising distinct fiber percentages, where the fiber remains to be electrically connected throughout the specimen. Resistivity of all specimens was calculated using Eq. 3. The similar trend of decrease in resistivity was observed by Alessandro et al. [18] when multi-wall carbon nano tubes (MWCNTs) and carbon fibers were used in concrete specimens with different dosages by cement mass as shown in Figure 4.
$\rho=\frac{\mathrm{AR}}{\mathrm{L}}$ (3)
where, A is cross sectional area; ρ is electrical resistivity; L distance between probes and R is electrical resistance.
Figure 3. Initial resistivity versus dosage of carbon fibers
Figure 4. Electrical resistivity of composite sensors versus the concentration of MWCNTs, with respect to the mass of cement [18]
3.2 Compressive strength
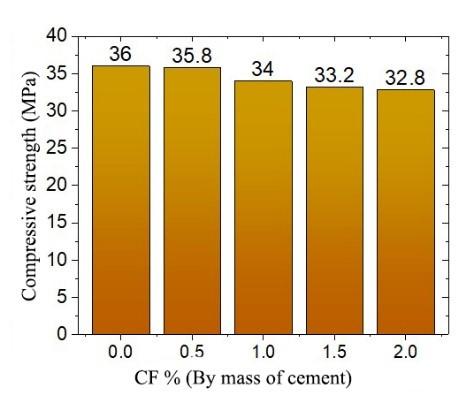
Three specimens of each carbon fiber dosage were subjected to compressive tests to find maximum load carrying capacity. This is performed so as to ensure elasticity during stress sensing tests from maximum load bearing capacity. Figure 5 demonstrates the peak compressive strength properties of fiber-casted specimens. The figure shows that there is a little decrease in peak stress with a growing proportion of fiber. This is likely because the presence of more carbon fibers, which lead to a reduction in strength due to formation of little air packets. It has been observed that decrease in strengths for 0.5% CF, 1% CF, 1.5% CF and 2% CF dosage are 0.5%, 5.6%, 7.8% and 8.8% respectively when compared with no fiber sample.
Figure 5. Compressive strength for different dosages of carbon fibres
3.3 Results of strain sensing test
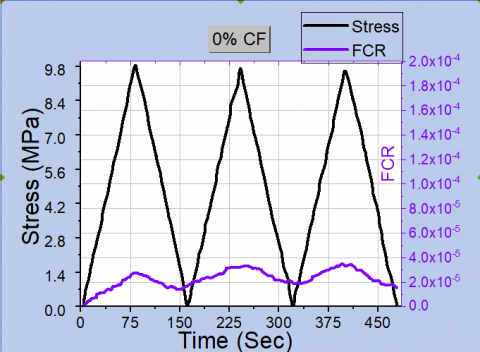
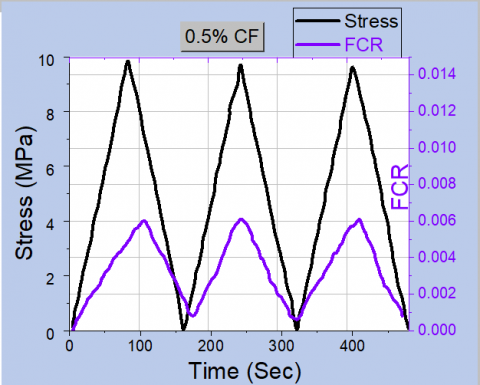
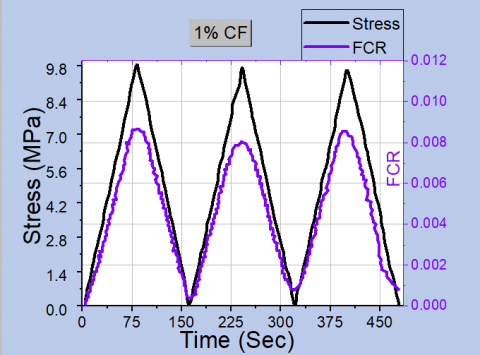
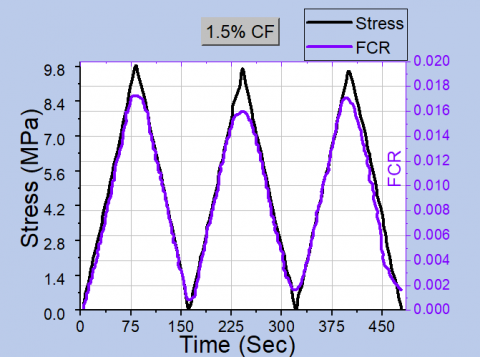
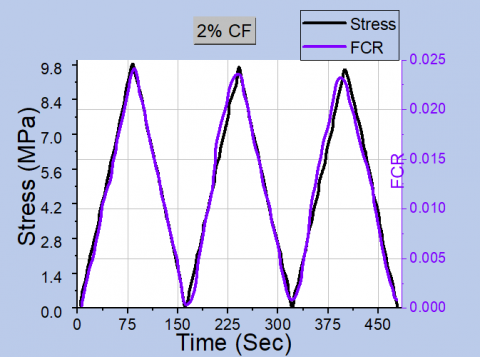
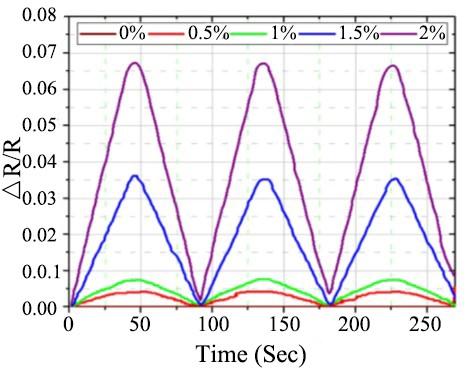
All specimens have been tested for 28 days at maximum loads of 250kN while maintaining a constant rate of loading of 1.5kN/sec in the UTM. Stress and fractional electric resistance change for all doses of carbon fibers are plotted in against time. The readings of the applied load and strains have been recorded using UTM while the resistance change was measured using DMM. After the load readings were read, stress values were calculated from obtained load readings and Eq. 2 was used to calculate fractional resistance changes (FCR’s) values. Both results acquired are time-related and are illustrated in Figure 6.
(a) 0% carbon Fiber (by mass of cement)
(b) 0.5% carbon Fiber (by mass of cement)
(c) 1% carbon Fiber (by mass of cement)
(d) 1.5% carbon Fiber (by mass of cement)
(e) 2% carbon Fiber (by mass of cement)
(f) Combined graph for fractional change in resistance for all dosages of carbon fibers
Figure 6. Compressive stress and fractional change in electrical resistance with respect to time for cyclic loading
Results obtained indicate that in Figure 6 (a), there is not very much co-relation in the specimen where carbon fibers are absent, between stress and fractional electric resistance changes. Also the value of FCR is much less than in other specimens where carbon fibers are embedded, with maximum order of 3 x 10⁻⁵. On the other side, the presence of CF’s in specific samples revealed that no fiber sample could not demonstrate any reversible correlation between stress and FCR during loading and unloading, as also previously reported [26]. From Figure 6 shown from b to e, it can be obviously seen that there is a close connection between electrical resistance changes and stress as the dosage of fibers increases. The maximum shift in electrical resistivity in no-fiber specimens was 3x10⁻⁵, which rose to 200 times for 0.5% fiber dosage, providing a maximum increase in electrical resistance (FCR) of 0.006 compared with non-fiber. Similarly, the increased electrical resistance factor is 1.3 from 0.5% to 1% fiber dosage, and from 1% to 1.5% are 2 and from 1.5% to 2% is 1.47. Figure 6 (f) shows plot of change in electrical resistance comparison of all the samples on one scale. Galao et al. [25] has worked on cement composites (cement paste) cast with carbon fibers for damage and strain sensing. It was found that better strain sensing was achieved in the samples that were cured for 28 days rather than 7 or 14 days. It was observed that obtained results in the present study followed the same trend as observed by Galao et al. [25].
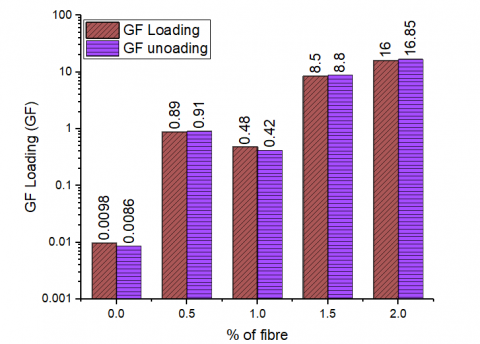
During strain sensing test, mean GF’s were also calculated for loading and unloading using Eq. 1. The values of mean GF for different dosages of carbon fibre are plotted in Figure 7. It is observed that during cyclic loading or unloading there was not much difference between mean GF concluding the analysis is probably correct regardless of loading or unloading. It can be also seen that GF increases as dosage of carbon fibre increases showing clear increase in the FCR readings.
Figure 7. Average gauge factor during loading and unloading
3.4 Results of damage sensing test
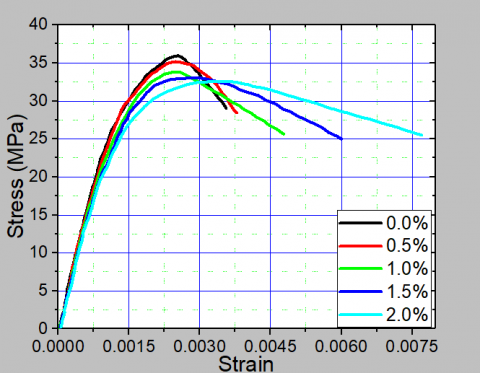
The same load speed was applied to all the samples as applied in strain sensing test until the failure of cubes. Figure 8 demonstrates the relation for various dosages of carbon fibers, between stress strains. The strength is not much affected by 0.5% and 1% fiber dosage, but further addition of CF’s significantly reduces strength. The average decrease in intensity owing to the fiber additions was 0.5, 5.5, 7.8 and 8.9% for 0.5%, 1%, 1.5% and 2% respective of CF’s.
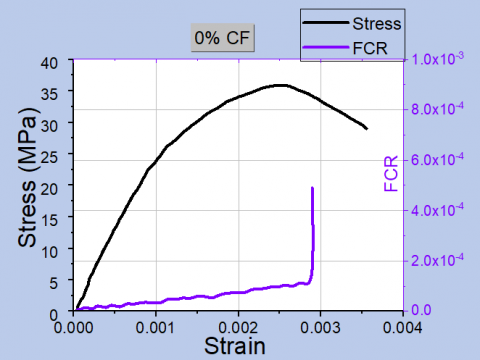
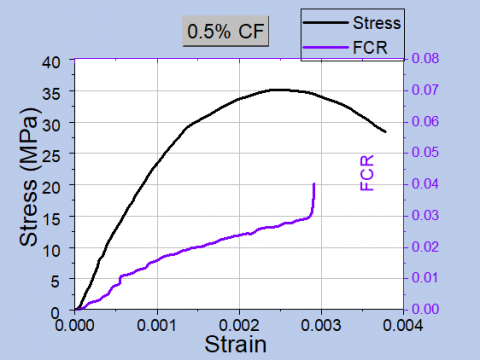
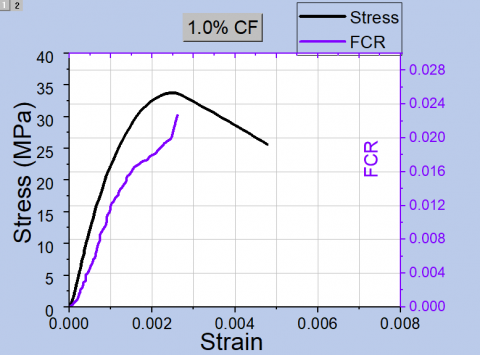
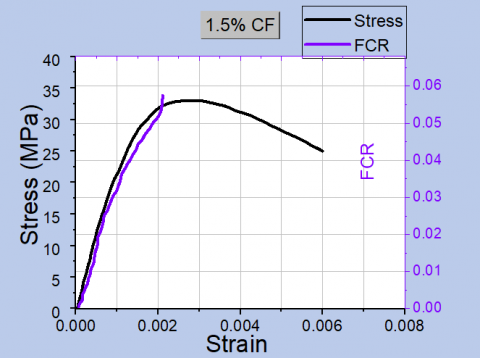
Figure 9 displays the plotted curve of stress and FCR against strain for various dosages of carbon fibers. Figure 9(a) shows that concrete specimens with no carbon fibers have no relation between strain, stress and FCR, as there is no charge flow since fibers are not present. On the other side, the co-relationship improves as the carbon fiber dose increases by weight from 0.5% to 2%.
Therefore, 1.5% CF dosage can be taken from the economic point of perspective as it shows a healthy coexistence in relation to 0.5% and 1% fiber dosage. The abrupt rise in the fractional resistance curve of Figure 9 (a-e) shows a failure of the sample due to no conductivity between the fibers. The highest levels of resistance change can also be observed from 0.0002 to 0.06 as the fiber dosing rises from 0% to 2%. Interestingly, cubes with 1.5 and 2% fibers show the soft curve (Figure 9 b & c) in comparison to other samples.
Because the carbon fiber continuity exists even after the fracture in cubes, until the sample has a broad opening of the fracture. The sudden increase in FCR) was also observed by Galao et al. [5] and Yining Ding [27] when cement specimen was loaded in a cyclic manner until failure with increase in load for each cycle of load. On the other hand, there is a sudden rise in FCR values with samples comprising 0.5% and 1% fiber, which demonstrates no simialar co-relation between stress and resistance. This is due to the fact that the fibers are less in quantity and having poor or no connectivity between them after formation of micro crack.
Figure 8. Compressive stress versus strain for different dosages of carbon fibres
(a) Compressive stress, electrical resistance versus strain curve for 0% carbon fibre dosage
(b) Compressive stress, electrical resistance versus strain curves for 0.5% carbon fibre dosage
(c) Compressive stress, electrical resistance versus strain curves for 1% carbon fibre dosage
(d) Compressive stress, electrical resistance versus strain curves for 1.5% carbon fibre dosage
(e) Compressive stress, electrical resistance versus strain curves for 2% carbon fibre dosage
Figure 9. Compressive stress and electrical resistance curves against strain for different dosages of carbon fibres corresponding to damage sensing test
In present work self-compacting concrete specimens cast with distinct dosages of carbon fibers have been tested for strain sensing and damage detecting experiments. Following conclusions can be drawn from present study:
The author is acknowledging his supervisor Dr. M.A Tantray and NIT Srinagar for financially supporting this research work in aspects of purchasing materials and equipments.
[1] Charif, A., Mourad, S.M., Khan, M.I. (2016). Flexural behavior of beams reinforced with steel bars exceeding the nominal yield strength. Latin American Journal of Solids and Structures, 13(5). http://dx.doi.org/10.1590/1679-78251683
[2] Kumar, C.A., Mohan, M., Rajesh, D.V.S.P., Kulkarni, P., Engineering, C., Campus, T. (2015). Behaviour of fibre reinforce concrete beam in combined bending and torsion. IJRET: International Journal of Research in Engineering and Technology, 4(7): 450-455.
[3] Wen, S., Chung, D.D.L. (2006). Self-sensing of flexural damage and strain in carbon fiber reinforced cement and effect of embedded steel reinforcing bars. Carbon, 44(8): 1496-1502. https://doi.org/10.1016/j.carbon.2005.12.009
[4] Azhari, F., Banthia, N. (2012). Cement & Concrete Composites Cement-based sensors with carbon fibers and carbon nanotubes for piezoresistive sensing. Cement and Concrete Composites, 34(7): 866-873. https://doi.org/10.1016/j.cemconcomp.2012.04.007
[5] Galao, O., Baeza, F.J., Zornoza, E., Garcés, P. (2014). Strain and damage sensing properties on multifunctional cement composites with CNF admixture. Cem. Concr. Compos., 46: 90-98. https://doi.org/10.1016/j.cemconcomp.2013.11.009
[6] Javier Baeza, F., Chung, D., Zornoza, E., Andión, L.G., Garcés, P. (2010). Triple percolation in concrete reinforced with carbon fiber. Aci Materials Journal, 107(4): 396.
[7] Chen, H., Qian, C., Liang, C., Kang, W. (2018). An approach for predicting the compressive strength of cement-based materials exposed to sulfate attack. PLoS One, 13(1): 1-11. https://doi.org/10.1371/journal.pone.0191370
[8] Wen, S., Chung, D.D.L. (2007). Piezoresistivity-based strain sensing in carbon fiber-reinforced cement. Journal of Intelligent Material Systems and Structures, 13(9). https://doi.org/10.1106/104538902031861
[9] Kim, H.K., Nam, I.W., Lee, H.K. (2014). Enhanced effect of carbon nanotube on mechanical and electrical properties of cement composites by incorporation of silica fume. Compos. Struct., 107: 60-69. https://doi.org/10.1016/j.compstruct.2013.07.042
[10] Hoheneder, J., Flores-Vivian, I., Lin, Z., Zilberman, P., Sobolev, K. (2015). The performance of stress-sensing smart fiber reinforced composites in moist and sodium chloride environments. Compos. Part B Eng., 73: 89-95. https://doi.org/10.1016/j.compositesb.2014.12.028
[11] Wang, X.J., Fu, X.L., Chung, D.D.L. (1999). Strain-sensing characteristics of carbon fiber. Journal of Mateerials Research, 14(3). https://doi.org/10.1557/JMR.1999.0105
[12] Fu, X., Chung, D.D.L. (1997). Effect of curing age on the self-monitoring behavior of carbon fiber reinforced mortar. Cem. Concr. Res., 27(9): 1313-1318. https://doi.org/10.1016/S0008-8846(97)00118-X
[13] Reza, F., Batson, G.B., Yamamuro, J.A., Lee, J.S. (2003). Resistance changes during compression of carbon fiber cement composites. J. Mater. Civ. Eng., 15(5). https://doi.org/10.1061/(ASCE)0899-1561(2003)15:5(476)
[14] Galao, O., Zornoza, E., Baeza, F.J., Bernabeu, A., Garces, P. (2012). Effect of carbon nanofiber addition in the mechanical properties and durability of cementitious materials. Materials de Construcción, 62: 343-357. https://doi.org/10.3989/mc.2012.01211
[15] Konsta-Gdoutos, M.S., Aza, C.A. (2014). Self sensing carbon nanotube (CNT) and nanofiber (CNF) cementitious composites for real time damage assessment in smart structures. Cem. Concr. Compos., 53: 162-169. https://doi.org/10.1016/j.cemconcomp.2014.07.003
[16] Han, B., Yu, X., Kwon, E. (2009). A self-sensing carbon nanotube/cement composite for traffic monitoring. Nanotechnology, 20(44). https://doi.org/10.1088/0957-4484/20/44/445501
[17] Erdem, S., Hanbay, S., Blankson, M.A. (2017). Self-sensing damage assessment and image-based surface crack quantification of carbon nanofibre reinforced concrete. Constr. Build. Mater., 134: 520-529. https://doi.org/10.1016/j.conbuildmat.2016.12.197
[18] D’Alessandro, A., Ubertini, F., Materazzi, A.L., Laflamme, S., Cancelli, A., Micheli, L. (2016). Carbon cement-based sensors for dynamic monitoring of structures. In EEEIC 2016 - International Conference on Environment and Electrical Engineering, Florence, Italy. https://doi.org/10.1109/EEEIC.2016.7555628
[19] Howser, R.N., Dhonde, H.B., Mo, Y.L. (2011). Self-sensing of carbon nanofiber concrete columns subjected to reversed cyclic loading. Smart Mater. Struct., 20(8). https://doi.org/10.1088/0964-1726/20/8/085031
[20] van de Werken, N., Reese, M.S., Taha, M.R., Tehrani, M. (2019). Investigating the effects of fiber surface treatment and alignment on mechanical properties of recycled carbon fiber composites. Compos. Part A Appl. Sci. Manuf., 119: 38-47. https://doi.org/10.1016/j.compositesa.2019.01.012
[21] Xiong, B., Wang, Z., Wang, C., Xiong, Y., Cai, C. (2019). Effects of short carbon fiber content on microstructure and mechanical property of short carbon fiber reinforced Nb/Nb5Si3 composites. Intermetallics, 106: 59-64. https://doi.org/10.1016/j.intermet.2018.12.010
[22] Cholker, A.K., Tantray, M.A. (2019). Materials Today: Proceedings Micro carbon fiber based concrete as a strain-damage sensing material. Mater. Today Proc., 19(Part 2): 152157. https://doi.org/10.1016/j.matpr.2019.06.629
[23] Han, B., Zhang, L., Zhang, C., Wang, Y., Yu, X., Ou, J. (2016). Reinforcement effect and mechanism of carbon fibers to mechanical and electrically conductive properties of cement-based materials. Construction and Building Materials, 125: 479-489. https://doi.org/10.1016/j.conbuildmat.2016.08.063
[24] Baeza, F.J., Galao, O., Zornoza, E., Garcés, P. (2013). Multifunctional cement composites strain and damage sensors applied on reinforced concrete (RC) structural elements. Materials (Basel), 6(3): 841-855. https://doi.org/10.3390/ma6030841
[25] Galao, O., Baeza, F.J., Zornoza, E., Garcés, P. (2014). Strain and damage sensing properties on multifunctional cement composites with CNF admixture. Cem. Concr. Compos., 46: 90-98. https://doi.org/10.1016/j.cemconcomp.2013.11.009
[26] Chen, P.W., Chung, D.D.L. (1996). Concrete as a new strain/stress sensor. Compos. Part B Eng., 27(1): 11-23. https://doi.org/10.1016/1359-8368(95)00002-X
[27] Ding, Y., Chen, Z., Han, Z., Zhang, Y., Pacheco-Torgal, F. (2013). Nano-carbon black and carbon fiber as conductive materials for the diagnosing of the damage of concrete beam. Construction and Building Materials, 43: 233-241. https://doi.org/10.1016/j.conbuildmat.2013.02.010