Hayat Belmecheri* | Tahar Seghier | Mohammed Belkheiri | Boubakeur Zegnini
OPEN ACCESS
Power transformers are of the key and the most expensive devices used in electrical power transmission systems. Maintenance is essential in increasing the life time of these devices [1]. Degradation and aging of the insulation is recognized as one of the major causes of transformer breakdowns [2]. Characterization and analysis of the dielectric fluid quality level are used to ensure the proper functioning of the insulation [3-5]. This helps understanding the causes of possible internal defects [1, 6]. The purpose of this study is to investigate on service-aged oil transformers as well as on oil aged ones in laboratory conditions. Accelerated thermal and chemical aging procedures were performed in the laboratory [7]. IDA 200 was used to evaluate the frequency scan of insulation material properties. The dissipation factor, conductivity, real, imaginary part of permittivity, were measured as function of the temperature and the frequency. Through this study, it was found that despite the approximation of test conditions, the results obtained for these samples are different. However, the results indicate that the accelerated aging in the laboratory conditions does not really reflect the state of the oil.
power transformer, mineral oil, dielectrics, aging, degradation, frequency domain
Heat dissipation and insulation are necessary for the continued function of power transformers Together, oil and paper constitute the transformer's insulation system with two important functions: dielectric and cooling [1]. Recent techniques used to monitor the condition of the power transformer are based on diagnosis of transformer oil [4]. Mineral oils serve as the dielectric fluids widely used for power transformers. Determination of dielectric characteristics of insulating liquids in frequency and time domain can be used to identify the quality of the oil [8].
In order to obtain results with practical relevance to transformers used in industrial applications, we performed tests on samples taken from various power transformers in operation where Kraft paper is used as a solid insulation system and mineral oil as liquid insulation. These samples were taken according to NFC27475 (liquid dielectric sampling method) [3, 6]. Detailed analysis of the transformer oil provides important information about the condition of the device and its electrical insulation. We compared transformer oils in service with artificial aging oils as a function of temperature and frequency; and the influence of power on the degradation of this oil. The findings shed new light on oil aged in laboratory, it does not accurately represent or simulate the real behavior of the oil in the power transformer. The remainder of this paper is organized as follows: Section 2 introduces the frequency domain spectroscopy to characterize the insulation in the transformer. Section 3 describes the experimental setup. Section 4 is devoted to results and discussions. Finally we end up with a conclusion in section 5.
The technique used is Diagnostic by Frequency Domain Spectroscopy (FDS) [7, 9, 10] which is a relatively new frequency domain diagnostic tool. It is used to characterize the insulation in the transformer. The monitoring of real, and imaginary permittivity and the dissipation factor of transformer insulation, as function of frequency provides key information concerning the state of insulation within the component [3]. Shayegani et al. [8] reported the variation of the dielectric response of mineral oil in response to frequency changes. This revealed that during the space charge polarization on the surface of electrodes charge carriers in the insulating oil can decrease [1, 5]. The result is a complex spectrum that must be analyzed to extract different information. An analytical transition from time to frequency domain can be made using the Laplace- or Fourier transformation by rewriting polarization equations [7]. Since single frequency component is considered at a time, the current can be written as follows:
$I(\omega)=\frac{c_{0} \sigma U(\omega)}{\varepsilon_{0}}+j \omega C_{0} \cdot U(\omega)[1+F(\omega)]$ (1)
$F(\omega)=\int_{0}^{\infty} f(t) \cdot \exp (-j \omega t) d t $ (2)
where, J(t) is the total current density (A/m2), σ is the conductivity, E is the electric field, ε0 is the vacuum permittivity, ω is the angular frequency and C0 is the geometrical capacitance of the test object. The Fourier transform for a convolution product is given as:
$F(\omega)=\varepsilon_{0} U(\omega) \chi(\omega)$ (3)
where, χ(ω) is the complex susceptibility given by:
$\chi(\omega)=\chi^{\prime}(\omega)-j \chi^{\prime \prime}(\omega)=\varepsilon_{r}^{\prime}(\omega)-1-\varepsilon_{r}^{\prime \prime}(\omega)$(4)
From (2) and (4) the current of polarization frequency domain is given by:
$I(\omega)=C_{0} \omega\left[\frac{\sigma}{\omega s_{0}}+\varepsilon_{r}^{\prime \prime}(\omega)+j \varepsilon_{r}^{\prime}(\omega)\right] U(\omega)$ (5)
where, $\varepsilon^{\prime}$ and $\varepsilon^{\prime \prime}$ is the real and the imaginary part of permittivity, $\frac{\sigma}{\omega \varepsilon_{0}}$ represent the loss per conduction produced by free charges.where, and is the real and the imaginary part of permittivity, represent the loss per conduction produced by free charges.
The loss factor (tan δ) is very important in quality control and quality change indications resulting from contamination or damage in use or handling [7] and can be defined as follows:
$\tan (\delta)=\frac{\varepsilon_{r}^{\prime \prime}(\omega)}{\varepsilon_{r}^{\prime}(\omega)}$ (6)
Tests were carried out on Borak 22 type oils: new oil, oils taken from the same type of power transformer (ENEL) in service and oil aged in laboratory. Oils A and B have a lifetime of over 15 years, sample A operating at 100 kVA and sample B at 250 kVA, sample C has 20 years of service at 250 kVA.
Insulating oil in service is subjected to electrical discharge, heat, and oxygen exposure which may lead to its degradation [1]. The life of the insulation is normally determined by measuring the time until failure. The rate of aging is a function of temperature and moisture [3, 6, 7]. Oil will age rapidly at high temperatures and moisture acts as a catalyst for its aging [7]. Real-time measurement can be time-consuming, as transformer isolation systems should last several decades before a failure occurs. Accelerated ageing procedures can be performed in the laboratory to significantly reduce the service life of liquid and/or solid insulation systems. An accelerated oil ageing procedure is faster and less expensive. To simulate the effects of the transformer's metal components, metal catalysts (3 g/l of zinc, copper, aluminum and iron) were introduced into a filter paper immersed in oil. The 81 x 81 mm² paper samples were placed in beakers containing two liters of oil. The entire system was placed in the furnace at 115°C. The samples were heated for 500 hours.
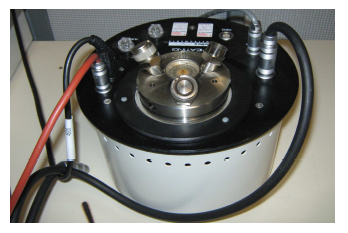
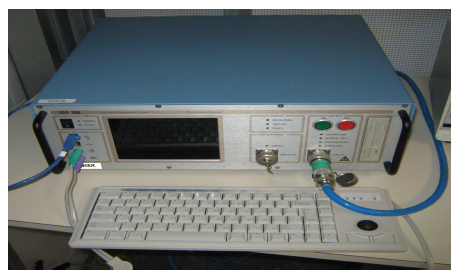
The dielectric response in the frequency domain was performed with the Insulation Diagnostics Analyzer (IDA200) equipment. The IDA system uses liquid test cell types 29033,10 as shown in Figure 1 and Figure 2.
Figure 1. Test cell 2903
Figure 2. Insulation diagnostics analyser
Many studies [3, 6, 7, 11, 12] have been published on the subject of separating aging and moisture from FDS results. These studies, which contributed to the development of the FDS technique, are used in diagnosing the insulation conditions of field power transformers. However, we have noticed the absence of studies in applying the FDS technique to quantitatively diagnose the aging state of field power transformers. As has been well described in the literature, the dielectric relaxation of materials is revealed by permittivity [3, 13].
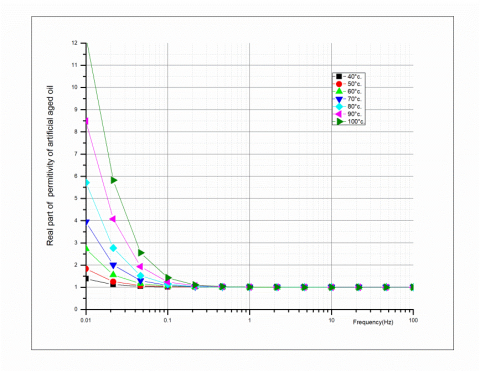
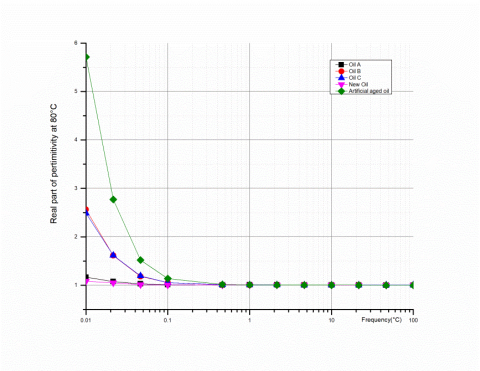
Therefore, we measured the real and imaginary part of permittivity for the different oil samples at various temperatures. For this reason, IDA200 was used to evaluate the frequency scan of insulating oils properties at different temperatures from 40°C to 100°C, as shown in the Figure 3.
Figure 3. Real part of the permittivity of artificial aged oil as function of frequency
We note that the permittivity of the dielectric increases substantially with temperature. The change of real part of permittivity is important for frequencies lower than 0.1 Hz and is practically invariable in higher frequencies as shown in Figure 3 for the artificial aged oil.
For all samples, the change in permittivity is significant for lower frequencies. Liao et al. [7] have studied the FDS behavior of oil-paper insulation samples with different moisture content. They did a series of aging experiments on oil-paper insulations under controlled laboratory conditions. Their observations stated that relative permittivity values of oil impregnated pressboards increase in low frequencies.
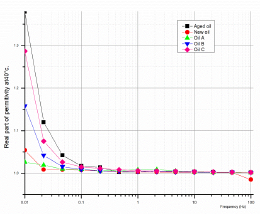
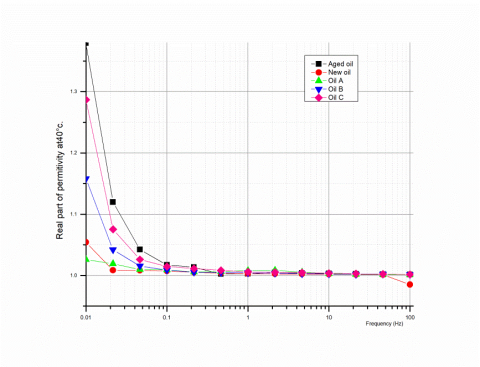
For frequencies below 1Hz, relative permittivity decreases considerably for the artificially aged oil sample with a rise in temperature compared to other samples as shown in Figure 4 and Figure 5, respectively. The permittivity decreases in oil B and it was considerably greater compared to oil A when the temperature increases. Therefore we can deduce that oil B is more contaminated than oil A and this is true for temperatures lower than 60°C.
Figure 4. Real part of the permittivity of different samples as function of frequency at T=40 °C
Figure 5. Real part of the permittivity of different samples as function of frequency at T=60 °C
Figure 6. Real part of the permittivity of different samples as function of frequency at T=80 °C
Despite the different operating times between the oils, their permittivity decreases in the same way when the temperature increases above 80 °C. This suggests that the condition of the insulating oils deteriorates at higher temperatures [6, 14]. As can be seen from the Figure 6, the oils undergo the same changes; the curve of the oil A extracted from the 100 kVA transformer is very close to that of the new oil.
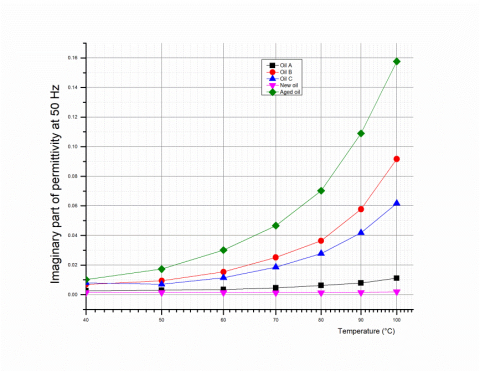
As it is known, the dielectric relaxation of materials is revealed by the real and imaginary part of the permittivity [7, 10], we have performed the frequency scanning of the imaginary part of the permittivity for the samples at temperature 80 °C and at frequency 50 Hz. This is represented in Figures 7 and 8 respectively. Figure 7 shows that the imaginary part of permittivity decreases with frequency and increases with temperature. The most significant changes are observed for temperatures above 80 °C for all Samples.
We note the change is more significant for artificially aged oil compared to the other samples while for the new oil permittivity is almost constant for high temperatures as shown in Figure 8.
Figure 7. Imaginary part of permittivity of the artificial aged oil at different temperatures
Figure 8. Imaginary part of permittivity of different samples at 50Hz
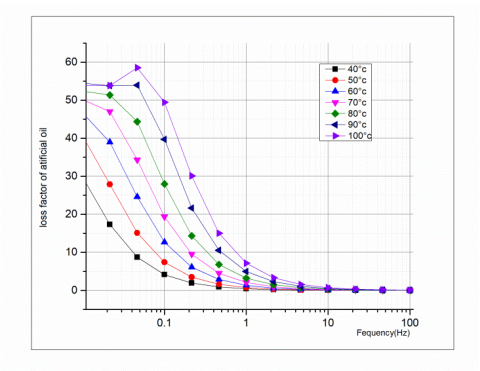
These results are in agreement with those reported by Fofana et al. [15]. In their work, they launched a series of aging experiments and observed a definite influence of oil/pressboard ratios on oil properties due to the oxidation and moisture migration. Indeed, during the thermal aging process, moisture transfers from the paper to the oil via diffusion. At higher temperatures non negligible parts of water migrate out of cellulose into oil, while an amount of the oxidation products is absorbed by the pressboard surface. During accelerated thermal aging, thermal stress changes the microscopic structure of cellulose in the amorphous region and weakens intermolecular interactions. Therefore, mineral oil can soak into pressboards more easily. As a result, numerous oil-paper interfaces form, this enhances the intensity of interfacial polarization and increases Loss factor values in low frequencies. It is widely accepted that aging by-products such as micromolecular acid, furan, and water with strong polarity particle can greatly intensify the conductivity together with polarization behaviors in dielectric materials, especially the conductivity behavior [7]. The loss factor can provide useful information about the quality of the oil [1], Betie [6] revealed that frequency domain spectroscopy parameters are more sensitive to moisture than aging. They also discovered that an increase in moisture or aging causes an increase in the dielectric loss factor. For more precision and to distinguish the width of the frequency range influenced by different moisture content and aging we studied the variation of the loss factor as a function of frequency and that for different values of temperature for the same oil samples which allowed us to have the Figures 9, 10, 11 and 12.
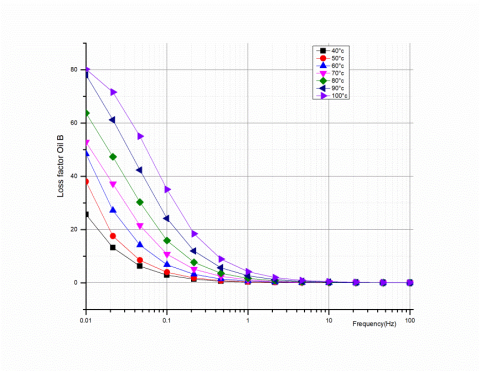
Figure 9. Loss factor curves of artificial Oil as function of frequency at different temperatures
Figure 10. Loss factor curves of Oil B as function of frequency at different temperatures
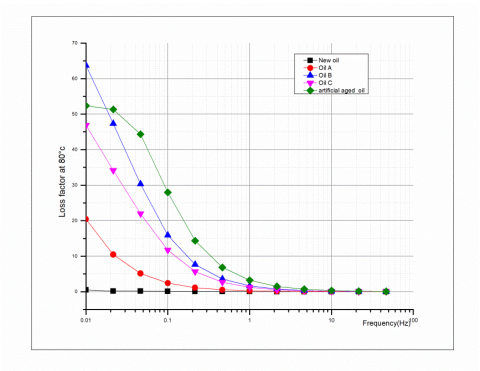
Figure 11. Loss factor curves of different samples as function of frequency at 80 °C
Figure 12. Loss factor of different samples as function of the temperature at frequency 50Hz
Comparing the different curves in which the Loss factor evolution can be considered as an aging sign [3, 6, 12] as a function of the frequency for the studied samples. We notice that the change of loss factor is significant for low frequencies and is practically invariable in the high-frequency range. As can be seen in Figure 9, for the artificial aged oil, the change of loss factor is important for frequencies lower than 1 Hz compared to the sample B for frequencies lower than 0.1 Hz as shown in Figure 10. Loss factor of the oil decreases with temperature and increases with frequency as shown in Figure 11.
The loss factor in the aged oil in laboratory is inferior to the one in sample B as it can be seen Figure 11. This leads us to conclude that the oil B aged more rapidly than other samples. Figure 12 shows the loss factor of the samples as a function of temperature at the industrial frequency 50 Hz, this parameter increases with temperature as in the case of permittivity, the change is more important for artificially aged oil. We note that the loss factor is significant for oil B compared to oil C for frequencies inferior to 1 Hz. Despite the difference in service time, oil B has aged faster than the oil C.
Results reported by Liao et al. [7] revealed that the sensitive frequency range in the Loss factor curve caused by moisture is 10-3<f<102 Hz. on the other hand, the sensitive frequency range in the Loss factor curve caused by aging is 10-3<f<10-1 Hz. These results are consistent with the results obtained in the present study. The moisture content significantly affects the conductivity of the insulating liquid. This conductivity increases with temperature and with frequency as shown in Figure 13, reducing the dielectric rigidity of the oil; despite the fact that both samples (oil A and oil B) have the same time service.
Figure 13. The conductivity of the different samples at T=80 °C
We have found that oil B has aged more rapidly than the oil A because of the presence of polar elements (water molecules) and the formation of impurities due to the complex chemical reactions between paper. The oil and metals contaminating the oil promote leakage currents by increasing the loss factor tan δ [15]. As a result, we deduce that the oil aged in laboratory does not accurately represent or simulate the behavior of the oil in the power transformer as there are many important factors which have not been taken into consideration affect it.
The technique used in this study for monitoring the state of the transformer in service is based on an analysis of the oil, which is intended to compare the dielectric parameters and the influence of temperature and frequency variation on these parameters. We made a comparison between oil samples taken from in-service transformers, new oil and artificial aged oil by varying temperature and frequency. We also observed the influence of power on the degradation of this oil. We concluded that the loss factor tan δ and the real part of the permittivity of the dielectric liquid decreases with an increase in frequency. On the other hand the electrical conductivity increases due to the deterioration of the insulating paper which affects the oil quality by the presence of electric charges that favor conduction. At the moment of writing these lines, the separation of moisture and aging effects on FDS results is remains a difficult problem and still a challenging issue.
This work was performed in the ISOLIME laboratory at Chicoutimi University - Canada. The authors would like to thank the personelle for their support in materials as well as all the collaborators of this work.
|
IDA |
Insulation Diagnostics Analyser |
|
FDS |
Frequency domain spectroscopy |
|
χ(ω) |
the complex susceptibility |
|
χ'(ω) |
Real part of susceptibility |
|
χ''(ω) |
Imaginary part of susceptibility |
|
J(t) |
Total current density (A/m2) |
|
F(ω) |
Fourier transform for a convolution product |
|
I(ω) |
Current of polarization |
|
tan δ |
Loss factor |
|
σ |
The conductivity (S/m) |
|
E |
The electric field |
|
C0 |
Geometrical capacitance of the test object |
|
T |
Temperature (°C) |
|
F |
Frequency (Hz) |
|
Greek symbols
|
|
|
χ |
The susceptibility |
|
ω |
The angular frequency |
|
ε0 |
The vacuum permittivity (8.85×10⁻¹²F/m.) |
|
ε' |
Real part of permittivity |
|
ε'' |
Imaginary part of permittivity |
[1] Sanchez, J. (2011). Aide au diagnostic de défauts des transformateurs de puissance. Doctorat thesis, Université de Grenoble, France.
[2] Baka, N.A., Abu-siada, A., Islam, S., El-Naggar, M.F. (2015). A new technique to measure interfacial tension of transformer oil using UV-Vis spectroscopy. IEEE Transactions on Dielectrics and Electrical Insulation, 22(2): 1275-1282. https://doi.org/10.1109/TDEI.2015.7076831
[3] Abdelghafour, B. (2014). Contribution à l’application de techniques traditionnelles et modernes au diagnostic des transformateurs de puissance. Doctorat thesis, Université du Québec à Chicoutimi.
[4] Bandara, K., Ekanayake, C., Saha, T.K. (2015). Modelling the dielectric response measurements of transformer oil. IEEE Transactions on Dielectrics and Electrical Insulation, 22(2): 1283-1291. https://doi.org/10.1109/TDEI.2015.7076832
[5] Asif, Z., Chen, Z. (2016). Multimedia environmental analysis of PCBs fate and transport mechanism through a case study of transformer oil leakage. International Journal of Environmental Science and Technology, 13(3): 793-802. https://doi.org/10.1007/s13762-016-0935-1
[6] Betie, A. (2012). Contribution à l'amélioration de l'interprétation des techniques de diagnostic des transformateurs de puissance par Spectroscopie diélectrique. Université du Québec à Chicoutimi.
[7] Liao, R.J., Hao, J., Chen, G., Yang, L.J. (2015). Quantitative analysis of insulation condition of oil-paper insulation based on frequency domain spectroscopy. IEEE Transactions on Dielectrics and Electrical Insulation, 22(1): 322-334. https://doi.org/10.1109/TDEI.2012.6215085
[8] Shayegani, A.A., Mohseni, H., Borsi, H., Gockenbach, E. (2005). Diagnostics of power transformers with dielectric response measurements. 20th Int’l. Power System Conf. Amsterdam, Netherlands, pp. 1-8.
[9] Eryilmaz, S., Akdemir, N., İnkaya, E. (2017). The investigation of the structural properties of 3-nitrophthalonitrile using spectroscopic and quantum chemical computational methods. International Journal of Computational and Experimental Science and Engineering, 3(2): 37-40. https://dergipark.org.tr/tr/pub/ijcesen/issue/31604/346633
[10] Güçlü, Ç.Ş., Özdemir, A.F., Kökce, A., Altindal, Ş. (2016). Frequency and voltage-dependent dielectric properties and AC electrical conductivity of (Au/Ti)/Al2O3/n-GaAs with Thin Al2O3 interfacial layer at room temperature. Acta Physica Polonica Series A, 130(1): 325-330. https://doi.org/10.12693/APhysPolA.130.325
[11] Betie, A., Meghnefi, F., Fofana, I., Yeo, Z., Ezzaidi, H. (2015). Neural network approach to separate aging and moisture from the dielectric response. IEEE Transactions on Dielectrics and Electrical Insulation, 22(4): 2176-2184. https://doi.org/10.1109/TDEI.2015.004731
[12] Seghier, T., Benabed, F., Fofana, I., Boudraa, S., Zegnini, B. (2014). Low frequency dielectric study of oil impregnated paper insulation used in power transformer. In Proceeding 9eme Conférence de la Société Française d’Électrostatique, Toulouse, France, pp. 53-58.
[13] Baka, N.A., Abu-siada, A., Islam, S., El-naggar, M.F. (2015). A new technique to measure interfacial tension of transformer oil using UV-vis spectroscopy. IEEE Transactions on Dielectrics and Electrical Insulation, 22(2): 1275-1282. https://doi.org/10.1109/TDEI.2015.7076831
[14] Boubakeur, A. (2011). Claquage des isolants liquides- vieillissement thermique de l’huile de transformateur borak22 (utilisée par sonelgaz). Ecole National Polytechniquen, Algier, Algeria.
[15] Fofana, I., Bouaïcha, A., Farzaneh, M. (2011). Quantitative Characterization of aging transformer oil–pressboard insulation using some modern diagnostic. Techniques. European Transactions on Electrical Power, 21: 1110-1127. http://dx.doi.org/10.1002/etep.499