Rui Han* | Dan Shao | Lihua Wang | Mingjie Wang
OPEN ACCESS
This paper attempts to develop a highly reliable security monitoring system for integrated utility tunnel (IUT). For this purpose, a minimum integrated system (MIS) with multiple sensors was designed to acquire the main parameters in the IUT, including air composition, temperature, pipeline pressure, humidity, and shot video/image of the IUT. Then, each MIS was connected to the software system on the ground via a wired network, forming a wire-based IUT communication and monitoring system. Next, three subsystems were designed on Java, including pipeline operation monitoring subsystem, internal environment monitoring subsystem and security monitoring subsystem. The test results show that the data measured by our method agree well with the actual data in the IUT, indicating that the proposed system can effectively monitor various parameters in the IUT. The research findings lay the basis for intelligent monitoring in smart cities, and mark the future trend of IUT management in Chinese cities.
integrated utility tunnel (IUT), environmental monitoring, communication system, minimum integrated system (MIS)
Integrated utility tunnel (IUT) is a livelihood project that enhances the overall carrying capacity of the city and the quality of urbanization [1]. In recent years, the demand for the IUT continued to increase, due to the growing population, awareness of environment protection and need for energy efficiency [2]. China has already piloted the IUT in a batch of cities. From 2015 to 2016, the number of pilot cities increased from 10 to 15. Currently, IUT construction is in full swing in about 150 districts, small towns and cities. For example, Zhangzhou Shuangyu Island was the first in China to build the management and control platform for the IUT. With the aid of this platform, the management server can manage and control the IUT in a unified manner. In this way, three levels of needs are combined into an organic whole, namely, security management, communication and resource sharing [3].
The boom of the IUT has aroused great interests in integrated operation and maintenance management [4-5]. Multiple technologies have been integrated to create integrated management systems, such as the intelligent management system of Lize pilot project in Jinhua, Zhejiang Province, the automatic patrol system in Gui’an New District, Guizhou Province, and the IUT management system in Jiangbei New District, Nanjing, Jiangsu Province [6-7]. All these systems shed new light on the IUT construction across China and lay a solid basis for future development of the IUT [8-10].
In the past few decades, much research has been done on the digitization and intelligence of utility tunnels. For instance, Wang et al. [2] introduced the existing and planned utility tunnels in China from 1959 to 2020. Canto-Perello et al. [11-12] pointed out the advantages of utility tunnels, calling for sustainable solutions to service congestion, and developed an expert system that uses color-coded scales, Delphi and analytic hierarchy process (AHP) to analyze criticality and threats on utility tunnels. Hunt et al. [13] explored the effects of short planning cycle and minimum initial cost on economic viability of various IUTs.
The IUT is faced with a complex underground environment. The main hazards for the underground sections include toxic gas, explosion and contamination. To ensure the tunnel safety, it is necessary to acquire the real-time states of various environmental parameters. This calls for a highly reliable tunnel security monitoring system. As a result, this paper designs a minimum integrated system (MIS) with multiple sensors to acquire the main parameters in the IUT, including air composition, temperature, pipeline pressure, humidity, and shot video/image of the IUT. Then, each MIS was connected to the software system on the ground via a wired network, forming a wire-based IUT communication and monitoring system. The wired network was adopted because the popular Zigbee-based wireless sensor network (WSN) is not suitable for underground communication. After all, the Zigbee-based WSN cannot support simultaneous high-quality transmission of various data with its narrow bandwidth [14-21]. To sum up, our wire-based IUT communication and monitoring system consists of three parts: the ground management system, the underground wired network and the underground monitoring system containing multiple MISs.
The network design directly bears on the communication effect of the entire system. Considering the long, straight features of the main tunnel, the wired network structure was designed by chain topology. According to Chinese national standards on industrial design, a manhole was set up every 200m along the IUT.
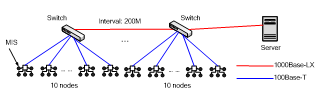
As mentioned before, a wired network was used to link up the MISs in the underground monitoring system and the ground management system. In the underground monitoring system, the MISs were designed as data acquisition source nodes. Each MIS is responsible for collecting and interpreting data with its multiple sensors. The MISs were arranged at an interval of 20m. Every 10 adjacent MISs were connected to a switch through unshielded twisted pair (UTP), which collects the data from the MISs and transmit them to the server of the ground management system. The switches were linked up with each other, and connected to the server via optical fibers. Upon receiving the data, the server will classify the data and display them on the 3D visualization interface. The data contain the IP addresses of the source nodes, making it possible to pinpoint the risks in the IUT and make early warning of potential hazards.
Figure 1. Structure of the wired network. (Black dots: sensors; White dots: The MISs (source nodes); Server: the server in the ground management system)
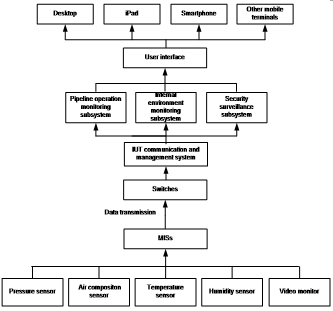
Each MIS continuously monitors the surrounding environment and collects the environmental parameters. The collected data are continuously sent to the ground management system via the wired network. Once a parameter exceeds the preset limit, the MIS will trigger an alarm to ensure tunnel safety. After receiving the real-time data, the computer software in the ground management system will display them on the 3D visualization interface. In view of the contents of communication and management, three subsystems were set up, namely, pipeline operation monitoring subsystem, internal environment monitoring subsystem and security monitoring subsystem. Overall, the designed system realized accurate monitoring of the IUT state, robust interpretation and classification of the captured data, remote transmission of the data to the ground, and intuitive display of the operation state. The overall framework of the entire system is shown in Figure 2 below.
Figure 2. The overall framework of the entire system
4.1 The MIS
The MIS was designed in the principles of simplicity, convenience and efficiency. As shown in Figure 3, each MIS consists of a sensor module, a processor module and a communication module.
Figure 3. The internal structure of minimum integrated system
4.2 Sensor module
Table 1. Details of the sensor module
|
Sensor/ monitor |
Type |
Target |
Range |
Result |
Status |
|
|
Safe |
Dangerous |
|||||
|
Air composition sensor |
MQ-2 air composition sensor |
Air composition |
0~500ppm |
>500ppm |
315ppm |
Safe |
|
Humidity sensor |
DHT11 humidity sensor |
Humidity |
20%~95% |
>45% |
21.5% |
Safe |
|
Temperature sensor |
DS18B20 temperature sensor |
Temperature |
-20℃ ~60℃ |
<0℃ |
21℃ |
Safe |
|
>50℃ |
||||||
|
Pressure monitor |
MIK-P310-2.5MPA-AS |
Pressure |
2.5MPa~60MPa |
<15 MPa |
45 MPa |
Safe |
|
>50 MPa |
||||||
4.3 Design of the processor module
The processor module uses the Raspberry 3.0 development board, which integrates the Linux operating system (OS). Compared with single chip microcomputer (SCM), the development board boasts high hardware integration, stable performance, easy server configuration and strong expansibility.
4.4 Design of the communication module
The communication module of the MIS is connected to the wired network. On the one hand, the module transmits the data collected by the sensors and the monitor; on the other hand, it receives the control signals from the server in the ground management system. The data transmission and reception are performed according to the Ethernet II protocol. Moreover, the communication module is powered by the UTP cable from the power over Ethernet (POE) switch.
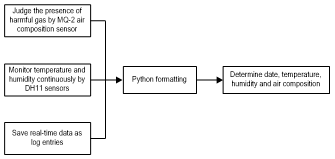
(1) Data formatting
The data acquired by the sensors and the monitor are GPIOs on different levels. The data on air composition were directly displayed. Those on temperature and humidity were processed by Python slice method into 8bit data, after data ratioing and removal of extreme values. The data formatting is illustrated in Figure 4 below.
Figure 4. Data formatting of the MIS
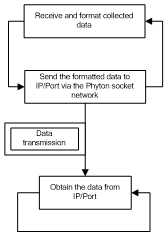
(2) Communication
Figure 5. Real-time data transmission
The communication module follows the transmission control protocol (TCP) to realize the real-time data transmission, including receiving the commands from the server in the ground management system and accepting the data collected by the sensor module. The real-time data transmission is explained in Figure 5.
5.1 Data acquisition module
The data on tunnel environment and pipeline operation are acquired in two steps: initializing the SCM pins, calling the data lines of sensors and monitor through Python’s GPIO class library. To inspect a tunnel section, the administrator only needs to observe the data collected by the MISs in that specific section. The data acquisition process is provided in Figure 6 below.
Figure 6. Data acquisition
5.2 Data processing module
After being transmitted to the ground management system via the Phyton socket network, the data are sliced for separate storage. Then, the MySQL database is checked through Python’s SymSQL class library, and the MySQL command is called to insert the obtained data into the table in the library. The data processing is shown in Figure 7 below.
5.3 Data transmission module
The data transmission module is detailed in Figure 8 below.
5.4 Visualization module
Figure 7. Database operation
The data outputted by the data processing module are sent to the visualization module. To highlight the parameter variation, the processed data are magnified before visualization. The visualization module has a user-friendly human-machine interface (HMI), which is developed in two steps. First, the building information modeling (BIM) model is employed to obtain the basic 3D model. Then, the basic model is post-processed and the function buttons are designed by Unity3D. The main interface of the visualization module is presented in Figure 9.
Figure 9. The main interface of the visualization module
6.1 Performance testing of the MISs
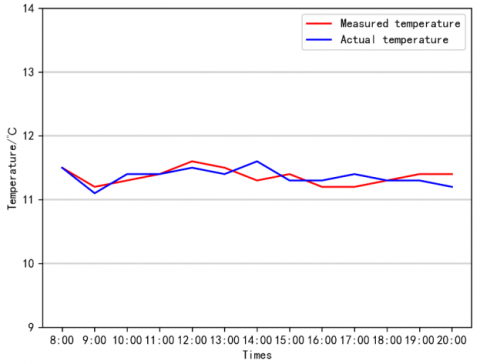
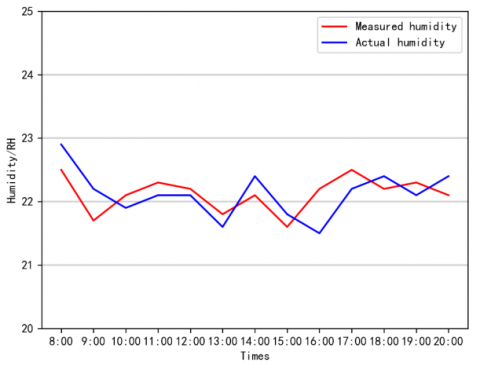
The performance of the MISs was tested by comparing the temperature and humidity measured by our system with the actual values of the two parameters in the IUT. Figure 10 gives both the measured results and the actual values. The measured results agree well with the actual values, indicating the successful operation of the MISs.
(a)
(b)
Figure 10. The measured results and the actual values of (a) temperature and (b) humidity
6.2 Performance testing of management system
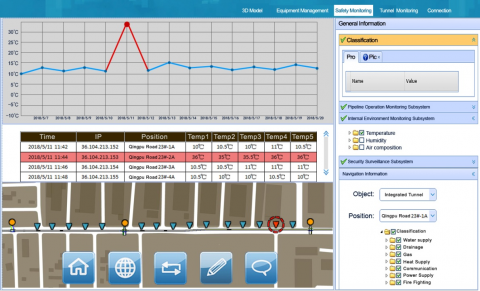
We can check the construction information of the specified tunnel section by clicking on the model, and access the monitoring perception data by clicking on the relay node and the MISs. The data acquired by the subsystems are displayed graphically. After entering the subsystem interface, the monitoring data of a period of time will be displayed by selecting the relay node location or MIS location. When an MIS detects an abnormal change in temperature, the alarm display of the system is shown in Figure 11. Each data carries such information as time, location, and IP address of the source MIS. The graphics table can be printed out after the administrator logged in with his/her ID, or be captured by screenshot. The user can add marks and edit texts on the graphic and share it with mobile terminals. The huge amount of data accumulated in the system operation exists as a valuable data source for the research of similar projects.
Figure 11. Alarm display of abnormal temperature
Considering the features of the IUT, this paper presents a novel method based on the MIS, aiming to aggregate the data captured by remote, dispersed sensors. Then, the MIS hardware and the software for the ground management system were developed, and a wired network was adopted to link up the two systems. The captured data can be displayed visually on the main interface of the management system, and an alarm will be released once a parameter exceeds the preset limit. The test results show that the data measured by our method agree well with the actual data in the IUT, indicating that the proposed system can effectively monitor various parameters in the IUT.
Based on the MIS-based system, the author designed three subsystems on Java, including pipeline operation monitoring subsystem, internal environment monitoring subsystem and security monitoring subsystem. In this way, the states of the IUT can be monitored, transmitted, interpreted, classified and displayed accurately. The user interface of the ground management system was developed by BIM model and 3D engine software, which further enhances the practicability and maneuverability of our system. Overall, our system is user-friendly, convenient, clear in structure and rational in functional division. The research findings lay the basis for intelligent monitoring in smart cities, and mark the future trend of IUT management in Chinese cities.
This work was supported by The Science and Technology Department of Jilin Province [20170204031SF], Ministry of Housing and Urban-Rural Development of the PRC [2017-K4-031], Ministry of Education of the PRC [S2017001], The Education Department of Jilin Province [JJKH20170264SK], The project of Educational Science Planning in Jilin Province (Normal project: Research on Innovation and Entrepreneurship Practicing teaching of Architects based on Virtual Simulation Platform) [GH180378].
[1] Ji, R., Su, Y.Y., Yu, M., Zhang, D.Z. (2018). Construction of an integrated system for data acquisition, supervisory control and operation of smart urban utility tunnel based on BIM+GIS platform. Jiangsu Construction, (2): 103-106.
[2] Wang, T.Y., Tan, L.X., Xie, S.Y., Ma, B.S. (2018). Development and applications of common utility tunnels in China. Tunnelling and Underground Space Technology, 76: 92-106. https://doi.org/10.1016/j.tust.2018.03.006
[3] Yang, H. (2018). Innovation intelligence tunnel. Construction Informatization in China, (9): 12-15.
[4] Valdenebro, J.V., Gimena, F.N. (2018). and Gimena Faustino N: "Urban utility tunnels as a long-term solution for the sustainable revitalization of historic centres: The case study of Pamplona-Spain. Tunneling and Underground Space Technology, 81: 228-236. https://doi.org/10.1016/j.tust.2018.07.024
[5] Han, R., Gao, Y.Q., Shao, D. (2016). Research on the application of building information model technology in the design of urban residential buildings in cold region. International Journal of Smart Home, (5): 183-194. https://doi.org/10.14257/ijsh.2016.10.5.17
[6] Li, Y., Meng, W. (2016). Research on Li Ze pilot intelligent underground tunnel. Investment in Beijing, (5): 58-60.
[7] Wu, S. (2017). Research and discussion on the layout of integrated pipeline tunnel: A case study of Guizhou GUI in new area. Construction of Science and Technology, (11): 91-94. https://doi.org/10.16116/j.cnki.jskj.2017.11.011
[8] Zheng, K., Zhong, S., Wang, G.M., Li, Z.G. (2018). Intelligent operation and maintenance management system of SIEMENS integrated pipe tunnel. Modern Building Electric, (5): 69-72.
[9] Yang, D.F., Liu, X.D., Su, F., Wu, P.P., Huang, Y. (2017). Research and application of intelligent operation management of urban utility tunnel. Journal of Information Technology in Civil Engineering and Architecture, 9(6): 28-33. https://doi.org/10.16670/j.cnki.cn11-5823/tu.2017.06.05
[10] Ye, T. (2017). The implementation plan of the intelligent operation management platform of the second stage of utility tunnel project in Jiangbei district of Nanjing. Value Engineering, (12): 79-83.
[11] Canto-Perelloa, J., Curiel-Esparza, J. (2013). Assessing governance issues of urban utility tunnels. Tunnelling and Underground Space Technology, 33(1): 82-87. https://doi.org/10.1016/j.tust.2012.08.007
[12] Canto-Perello, J., Curiel-Esparza, J., Calvo, V. (2013). Criticality and threat analysis on utility tunnels for planning security policies of utilities in urban underground space. Expert Systems with Applications, 40(11): 4707-4714. https://doi.org/10.1016/j.eswa.2013.02.031
[13] Hunt, D.V.L., Nash, D., Rogers, C.D.F. (2014). Sustainable utility placement via multi-utility tunnels. Tunnelling and Underground Space Technology, 39: 15-26. https://doi.org/10.1016/j.tust.2012.02.001
[14] He, X.W., Wang, Y. (2012). The design of tungsten mine environment monitoring system based on wireless sensor networks. 2012 International Conference on Intelligent System Design and Engineering Applications, pp. 1319-1322. https://doi.org/10.1109/ISdea.2012.513
[15] Moridi, M., Sharifzadeh, M., Kawamura, Y., Jang, H.D. (2018). Development of wireless sensor networks for underground communication and monitoring systems (the cases of underground mine environments). Tunnelling and Underground Space Technology, 73: 127-138. https://doi.org/10.1016/j.tust.2017.12.015
[16] Sharma, M., Maity, T. (2018). Low cost low power smart helmet for real-time remote underground mine environment monitoring. Wireless Personal Communications, 102(1): 149-162. https://doi.org/10.1007/s11277-018-5831-1
[17] Sun, H.G., Yan, X., Li, X.L., Zhao, T.J. (2009). Application of fuzzy-evaluation-based information fusion in coal mine environment monitoring system. 2009 9th International Conference on Electronic Measurement & Instruments, pp. 3980-3984. https://doi.org/10.1109/ICEMI.2009.5274141
[18] Peixoto, J.P.J., Costa, D.G. (2017). Wireless visual sensor networks for smart city applications: A relevance-based approach for multiple sinks mobility. Future Generation Computer Systems, 76: 51-62. https://doi.org/10.1016/j.future.2017.05.027
[19] Ou, Y.Y. (2018). Design of intelligent tunnel integrated monitoring system based on 5G wireless sensor network. Industrial Innovation, (1): 28-33.
[20] Yang, D.F. (2018). Application of intelligent management system for comprehensive pipe tunnel construction based on iS3. Water Conservancy Planning and Design, (9): 151-154. https://doi.org/10.3969/j.issn.1672-2469.2018.02.039
[21] Rao, S.K., Prasad, R. (2018). Impact of 5G technologies on smart city implementation. Wireless Personal Communications, 100: 161-176. https://doi.org/10.1007/s11277-018-5618-4