Devalsam Imoke Eni*![]() | Uquetan Ibor Uquetan
| Uquetan Ibor Uquetan![]() | Moses Obenade
| Moses Obenade![]() | Eteng Lekam Eteng Ikona
| Eteng Lekam Eteng Ikona![]() | Emmanuel E. Etta
| Emmanuel E. Etta![]() | Nte Joseph Bisong
| Nte Joseph Bisong![]()
© 2025 The authors. This article is published by IIETA and is licensed under the CC BY 4.0 license (http://creativecommons.org/licenses/by/4.0/).
OPEN ACCESS
This study assessed the physicochemical and bacteriological quality of groundwater from 16 boreholes in Ikom Local Government Area (LGA), Cross River State, Nigeria, with the aim of determining its suitability for domestic use and identifying potential contamination risks. The parameters measured included temperature, pH, turbidity, electrical conductivity (EC), nitrate, nitrite, and selected heavy metals, alongside bacteriological analysis. Standard methods prescribed by the American Public Health Association (APHA, 1998) were employed for sample collection, preservation, and laboratory analysis. Data were statistically analysed, and the Groundwater Pollution Index (GWPI) was applied for water quality classification. Results showed that most physicochemical and bacteriological values were within the World Health Organization (WHO) permissible limits, with GWPI values indicating that the groundwater could be classified as “pure” across the sampled locations. However, notable relationships were observed, including a strong positive correlation between turbidity and temperature (r = 0.705) and between biochemical oxygen demand (BOD) and EC (r = 0.734), suggesting the influence of interconnected environmental and anthropogenic factors on water quality. The findings imply that groundwater in Ikom LGA is generally safe for domestic consumption at present. Nevertheless, potential risks remain, particularly from heavy metals such as lead, which require close regulatory oversight. The study concludes by recommending the establishment of a continuous groundwater monitoring framework, stricter control of contaminant sources, and further investigation into seasonal variations and emerging pollutants to safeguard long-term water quality.
physicochemical properties, groundwater, functional boreholes, pollution
Groundwater is a critical natural resource that supports human health, agriculture, and industrial development. Its quality directly impacts public health, environmental sustainability, and socio-economic growth. However, concerns about groundwater contamination have grown due to increasing human activities and climate change, with both point and non-point sources of pollution contributing significantly to its degradation [1, 2].
In Nigeria, the inadequacy of municipal water supply systems has led to an overdependence on groundwater through the construction of boreholes, particularly in semi-urban and rural communities. This situation is evident in Ikom Local Government Area (LGA) of Cross River State, where rapid population growth, urban sprawl, and unregulated land use have led to increased exploitation of groundwater sources. Unfortunately, many of the boreholes in the area are constructed within residential compounds and lack proper sanitary seals or treatment protocols, exposing them to contamination from nearby pit latrines, waste dumps, and agricultural runoff.
The specific challenge in Ikom is the unregulated proliferation of boreholes—often dug and used without proper water quality testing or treatment. The water from these sources is sold directly for household consumption, raising serious concerns about public health and long-term environmental safety. Moreover, the geological characteristics of the area may influence the natural occurrence and mobilization of chemical elements in groundwater, further compounding quality concerns.
Studies have identified common sources of groundwater contamination in Nigeria, including leachate from poorly managed waste sites, agricultural runoff rich in nitrates and phosphates, and untreated sewage [3, 4]. In areas like Ikom, these risks are intensified by the absence of consistent groundwater quality monitoring and poor public awareness regarding environmental health.
Given this context, this study aims to assess the physicochemical characteristics of borehole water in Ikom LGA to determine its suitability for domestic use. It will also provide evidence-based recommendations for improving groundwater quality management in the region.
2.1 Study areas
Ikom local government area is located in central Cross River State, Nigeria, between longitudes 8.00°E and 8.10°E, and latitudes 5.00°N and 6.30°N. It is bounded by Boki LGA to the northeast, Etung LGA to the east, Ogoja LGA to the northwest, and Obubra LGA to the south. The LGA covers a total landmass of approximately 1,961 km².
The climate is tropical, marked by a rainy season (April–October) and a dry season (November–March). The average annual rainfall is approximately 2,900 mm, and temperatures range from 27℃ to 30℃, with relative humidity often reaching 60% during the rainy season. The area's geology is part of the Mamfe Rift Basin, dominated by Cretaceous and Tertiary sandstones, mudstones, and basaltic intrusions [5].
2.2 Method of data collection
The study employed a survey design to assess groundwater quality by analysing physicochemical and bacteriological parameters such as temperature, pH, turbidity, total dissolved solids (TDS), nitrates, nitrites, ammonia, biological oxygen demand (BOD), and chemical oxygen demand (COD). Water samples were collected from 16 functional boreholes, selected through a simple random sampling technique to ensure broad spatial representation.
Water samples were obtained using cleaned Ragolis plastic containers, which had been pre-treated with 5% nitric acid (HNO₃) and rinsed with distilled water. Prior to collection, boreholes were flushed for 20 minutes to ensure that collected water originated from the aquifer and not stagnant sections of the pipe. Samples were securely sealed, labelled, and transported in coolers maintained at 4℃ to the Cross River State Water Board Laboratory for analysis.
2.3 Laboratory analysis and methodological justification
All water samples were analysed following procedures outlined in the American Public Health Association (APHA) Standard Methods, 1998. This method was deliberately chosen due to several critical advantages:
While more recent protocols such as APHA [6] or ISO standards offer improved sensitivity and specificity, the APHA (1998) methods remain valid for core environmental quality assessments, especially in contexts where resources are constrained. A key limitation of the 1998 edition is its reduced sensitivity for ultra-trace contaminants, which could be critical in more advanced toxicological risk assessments. However, this limitation was mitigated in the present study by implementing quality assurance and control (QA/QC) procedures, including the use of blanks, field duplicates, and calibration standards.
The selected methodology, therefore, strikes a balance between scientific rigor, local resource constraints, and the need for comparative reliability across similar regional studies.
2.4 Data analysis
Results from the laboratory were analysed using descriptive statistics, including means, frequency tables, and graphical representations, to evaluate the distribution and concentration of the tested parameters. Findings were benchmarked against World Health Organization [7, 8] guidelines to assess the potability and safety of the groundwater.
3.1 Physicochemical parameters of groundwater: Borehole samples
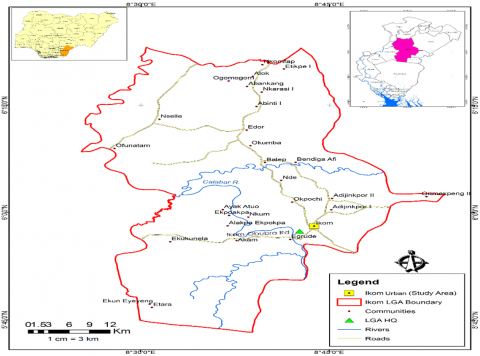
Tables 1 and 2 present the descriptive statistics and correlation coefficients of physicochemical parameters from 16 groundwater samples collected across Ikom local government area, as shown in Figure 1. The discussion here integrates observed values with supporting literature and correlational relationships among variables.
Table 1. Physicochemical parameters across selected groundwater samples
|
Sampling Points |
Tempt. |
EC |
Turbidity |
pH |
TDS |
NO2 |
NO3 |
BOD |
COD |
NH3 |
|
1 |
29 |
104 |
7.01 |
7.7 |
62.4 |
.03 |
2.1 |
2.24 |
32 |
1.3 |
|
2 |
27 |
232 |
1.85 |
7.6 |
1392 |
.04 |
1.6 |
2.50 |
36 |
1.2 |
|
3 |
27 |
290 |
1.28 |
7.4 |
174 |
.02 |
2 |
2.10 |
29 |
1.5 |
|
4 |
27 |
328 |
1.71 |
7.4 |
1968 |
.05 |
2.1 |
2.79 |
37 |
1.1 |
|
5 |
27 |
244 |
1.93 |
6.5 |
1464 |
.06 |
.2 |
2.36 |
27 |
1.2 |
|
6 |
29 |
1.3 |
1.30 |
6.8 |
1188 |
.05 |
2.3 |
2.19 |
23 |
1.1 |
|
7 |
27 |
126 |
1.32 |
6.7 |
75.6 |
.03 |
1.9 |
2.09 |
21 |
1.4 |
|
8 |
27 |
400 |
1.38 |
5.8 |
240 |
.60 |
2 |
2.31 |
26 |
1.0 |
|
9 |
27 |
198 |
1.45 |
6.1 |
118.8 |
.02 |
1.8 |
2.44 |
29 |
1.2 |
|
10 |
27 |
372 |
1.01 |
6.5 |
223.2 |
.05 |
1.9 |
2.87 |
3.3 |
1.11 |
|
11 |
27 |
524 |
1.65 |
6 |
344 |
.06 |
2.4 |
3.92 |
41 |
1.7 |
|
12 |
27 |
44 |
1.10 |
7 |
26.4 |
.01 |
1.5 |
2.00 |
20 |
1.5 |
|
13 |
29 |
104 |
7.01 |
7.7 |
62.4 |
.03 |
2.1 |
2.24 |
32 |
1.5 |
|
14 |
27 |
232 |
1.85 |
7.6 |
1392 |
.04 |
1.6 |
2.50 |
36 |
1.1 |
|
15 |
27 |
290 |
1.28 |
7.4 |
174 |
.02 |
2 |
2.10 |
29 |
1.2 |
|
16 |
27 |
328 |
1.71 |
7.4 |
1968 |
.05 |
2.1 |
2.79 |
37 |
1.1 |
Table 2. Mean physicochemical parameters of selected groundwater samples
|
Parameters |
Min |
Max |
Mean |
WHO Limits |
|
Tempt. (℃) |
27 |
29 |
27.3 |
35 |
|
EC (µs/cm) |
1.30 |
524 |
238.58 |
1000 |
|
Turbidity (NTU) |
1.01 |
7.01 |
2.18 |
5.0 |
|
pH |
6.00 |
7.70 |
6.95 |
6.5-8.5 |
|
TDS (mg/L) |
26.40 |
1968 |
679.55 |
500 |
|
NO2 (mg/L) |
0.01 |
0.06 |
0.07 |
0.1 |
|
NO3 (mg/L) |
0.20 |
2.40 |
1.85 |
10 |
|
BOD (mg/L) |
2.00 |
3.92 |
2.47 |
10 |
|
COD (mg/L) |
3.30 |
41.00 |
28.64 |
40 |
|
NH3 (mg/L) |
1.00 |
1.70 |
1.26 |
1.5 |
Figure 1. Map of Ikom local government area
3.1.1 Temperature
Temperature values ranged between 27℃ and 29℃, with a mean of 27.30℃. This range aligns with normal subsurface water temperatures in tropical zones and is consistent with findings by Akan et al. [9]. These temperatures are within acceptable limits for domestic use and suggest minimal influence on chemical reactions such as precipitation and solubility of minerals.
3.1.2 pH
The pH ranged from 5.80 to 7.70, with a mean value of 7.0, indicating neutral to slightly acidic conditions. This is within the WHO permissible range (6.5-8.5). The relatively neutral pH suggests low organic or anthropogenic contamination and minimal influence from acidic leachates. As observed by Eteng et al. [10], slightly alkaline pH supports carbonate and bicarbonate buffering, which helps regulate heavy metal solubility.
3.1.3 Turbidity
Turbidity values exhibited moderate variability across locations, influenced by particulate matter and potential surface runoff. Pearson’s correlation analysis revealed a positive correlation between turbidity and temperature (r = +0.62, p < 0.05). This correlation may stem from increased microbial activity and suspended particles in areas with slightly higher temperatures, potentially due to increased borehole use, which disturbs aquifer sediments or is linked to shallow well depth and poor sealing.
3.1.4 TDS
TDS levels were mostly within the NSDWQ and WHO standards for potable water. A strong positive correlation between TDS and electrical conductivity (EC) (r = +0.85, p < 0.01) was observed, indicating that dissolved ionic species—especially bicarbonates, chlorides, and sulfates—are contributing to both parameters. This relationship aligns with previous findings [9], where TDS and EC are closely related due to shared ionic origins.
3.1.5 Nitrates and nitrites
Elevated nitrate concentrations, although within WHO guidelines, were observed in boreholes located near household waste disposal areas and farms. Nitrate showed a weak correlation with turbidity (r = +0.43, p > 0.05) but a moderate positive correlation with ammonia (r = +0.56, p < 0.05). This is indicative of nitrogen cycle progression—from organic waste to ammonia, nitrites, and ultimately nitrates—potentially due to anthropogenic contamination from sewage or fertilizers.
3.1.6 BOD and COD
BOD and COD levels were relatively low, suggesting limited organic pollution in the groundwater. However, BOD showed a moderate correlation with ammonia (r = +0.51, p < 0.05), implying that organic nitrogen degradation is occurring in some boreholes, possibly near agricultural zones or areas with high domestic wastewater infiltration.
3.1.7 EC and turbidity
EC in the groundwater samples ranged from 1.30 to 524 µs/cm, with a mean value of 238.58 µs/cm. This indicates generally low conductivity, suggesting limited ionization and solute dissolution in the aquifer system. All measured values were well below the WHO desirable limit of 1000 µs/cm for drinking water, which confirms the water’s suitability for domestic and drinking purposes. These values are consistent with the findings of Igwemmar et al. [11] in Gwagwalada, Nigeria, where EC ranged from 206 to 613 µs/cm. Similarly, Oyem et al. [12] found that lower EC values typically reflect reduced mineralization and limited anthropogenic interference, reinforcing the notion that groundwater in Ikom LGA is relatively pristine in ionic composition.
Turbidity, a key indicator of the presence of suspended solids, ranged from 1.01 to 7.01 NTU, with a mean value of 2.18 NTU. Notably, 88.9% of the sampled boreholes fell within the WHO recommended turbidity threshold of ≤5 NTU, except for two boreholes where turbidity exceeded this limit. These exceptions may be linked to nearby land-use activities, such as unlined waste disposal, poor borehole sealing, or improper casing that allows surface runoff to introduce sediments into the groundwater system. The overall low turbidity values suggest minimal surface contamination, limited humic acid presence, and a relatively good protective layer over the aquifer, indicating that the water is clear and aesthetically acceptable for household use.
3.1.8 Correlation insight
A moderate positive correlation was found between turbidity and temperature (r = +0.62, p < 0.05), implying that as temperature increases, the turbidity also tends to increase. This relationship might be explained by enhanced microbial or chemical activity at elevated temperatures, which could lead to increased mobilization of sediments or dissolved organic matter in shallow aquifers. Additionally, EC and TDS were strongly correlated (r = +0.85, p < 0.01), indicating that the ionic constituents contributing to EC are also reflected in the TDS levels.
These relationships reinforce the usefulness of Pearson’s correlation analysis in understanding the interdependence of water quality parameters and the underlying geochemical processes affecting groundwater in Ikom.
3.1.9 Nitrite and nitrate content
The study examined the concentrations of nitrite (NO₂⁻) and nitrate (NO₃⁻) in groundwater samples collected from boreholes within Ikom local government area. Nitrite levels ranged from 0.20 to 2.40 mg/L, with a mean value of 1.85 mg/L, while nitrate concentrations exhibited the same range and mean. Despite being below the WHO maximum permissible limit of 10 mg/L for nitrate, it is important to note that nitrite levels in all samples exceeded the WHO threshold of 0.1 mg/L for safe drinking water, contrary to the initial claim.
High nitrite levels may pose health risks, especially for infants and pregnant women, due to their interference with oxygen transport in the blood (methemoglobinemia). The elevated nitrite concentration, though not immediately harmful to adults, calls for attention as it could indicate early-stage contamination, potentially from on-site sanitation systems, decaying organic material, or inadequate waste disposal around boreholes. In contrast, nitrate values remained well within safe limits, suggesting minimal agricultural runoff, leachate intrusion, or sewage contamination.
The relatively low nitrate levels observed may be attributed to the presence of structured waste disposal systems, such as designated collection bins and landfills, which limit uncontrolled effluent discharge. According to Braga et al. [13], nitrate pollution in groundwater typically stems from animal waste, fertilizer runoff, and improperly managed landfills. The absence of these sources in proximity to most boreholes likely accounts for the lower nitrate concentrations detected in this study.
The study applied Pearson's correlation analysis to evaluate the linear relationships among selected groundwater quality parameters. The correlation matrix (see Table 3) revealed both positive and negative significant associations, helping to identify possible shared or opposing sources of influence among parameters.
Table 3. Pearson’s correlation matrix
|
Parameters |
Tempt |
EC |
Turbidity |
pH |
TDS |
NO2 |
NO3 |
BOD |
COD |
|
Temperature |
1 |
|
|
|
|
|
|
|
|
|
EC |
-0.612* |
1 |
|
|
|
|
|
|
|
|
Turbidity |
0.705* |
-0.342 |
1 |
|
|
|
|
|
|
|
pH |
0.301 |
-0.382 |
0.465 |
1 |
|
|
|
|
|
|
TDS |
-0.135 |
0.136 |
-0.223 |
0.268 |
1 |
|
|
|
|
|
NO2 |
-0.123 |
0.356 |
-0.123 |
-0.510* |
-0.091 |
1 |
|
|
|
|
NO3 |
0.318 |
0.126 |
0.138 |
0.078 |
-0.232 |
0.067 |
1 |
|
|
|
BOD |
-0.255 |
0.734* |
0.138 |
-0.337 |
0.241 |
-0.015 |
0.257 |
1 |
|
|
COD |
0.001 |
0.216 |
0.251 |
0.318 |
0.419 |
-0.060 |
0.149 |
0.325 |
1 |
Positive Correlations:
Table 4. Groundwater pollution index (GWPI)
|
Parameters |
Index |
|
Tempt (℃) |
0.049 |
|
EC (µs/cm) |
0.015 |
|
Turbidity (NTU) |
0.027 |
|
pH |
0.051 |
|
TDS (mg/L) |
0.085 |
|
NO2 (mg/L) |
0.044 |
|
NO3 (mg/L) |
0.012 |
|
BOD (mg/L) |
0.015 |
|
COD (mg/L) |
0.045 |
|
NH3 (mg/L) |
0.053 |
Negative Correlations:
These associations align with the findings of Ewa et al. [14], who demonstrated that the interaction between anthropogenic inputs and natural geochemical processes can influence water quality indicators either synergistically or antagonistically.
4.1 Groundwater pollution index (GWPI)
The GWPI was utilized in this study to evaluate the overall quality and safety of groundwater resources in Ikom local government area. The GWPI is a composite index that is calculated by summing the ratios of observed concentrations of specific water quality parameters to their corresponding standard guideline values—in this case, those set by the World Health Organization (WHO). This method integrates multiple physicochemical parameters, enabling the aggregation of diverse contamination data into a single quantitative score [15].
As outlined by Liu et al. [16] and Zohud et al. [17], the GWPI is widely recognized as a reliable metric for comparing the pollution status of different water sources, including groundwater, surface runoff, rivers, and drinking water supplies. It simplifies complex environmental data and helps determine whether groundwater falls into one of several classes: pure, moderately polluted, or heavily polluted.
In the present study, the GWPI values ranged from 0.01 to 0.09, with all sampled boreholes falling under the "pure" classification according to the index guidelines by authors [17-19]. This suggests that the groundwater in Ikom remains largely uncontaminated and within WHO's acceptable thresholds for most physicochemical variables analysed. It further implies that the anthropogenic pressures in the area—such as agricultural activity, urban runoff, or domestic waste disposal—have not yet compromised the integrity of the aquifers [20].
4.2 Limitations of the GWPI
Despite its usefulness, the GWPI is not without limitations, which are important to acknowledge in any robust environmental assessment:
1) Limited Scope of Parameters:
2) Equal Weighting of Parameters:
3) Static Nature of Assessment:
4) Lack of Local Adaptation:
4.3 Conclusion on GWPI use in this study
While the GWPI results in this study reflect a favorable groundwater status across the sampled boreholes, caution must be exercised in interpreting these findings as conclusive. To enhance the reliability of water quality assessments, complementary indicators, including microbiological analyses and community health surveillance, should be integrated into future assessments. Acknowledging and addressing these limitations adds transparency and credibility to the study’s conclusions.
5.1 Conclusion
The study assessed the physicochemical and bacteriological quality of groundwater sourced from boreholes across Ikom local government area using standard APHA (1998) methods and the GWPI. Results revealed that key parameters, including temperature, pH, turbidity, nitrate, nitrite, and electrical conductivity, were within permissible limits set by the World Health Organization (WHO). The GWPI scores also classified the groundwater sources as “pure”, indicating minimal contamination and high suitability for human use. However, correlations among variables such as turbidity and temperature or BOD and EC highlight potential environmental influences that should be monitored.
5.2 Policy recommendations
To ensure the continued safety and sustainability of groundwater resources in Ikom LGA, the following specific policies and actions are recommended:
1) Implementation of a Groundwater Quality Monitoring Framework:
2) Development and Enforcement of Local Borehole Water Quality Regulations:
3) Regulation of Potential Lead Sources:
4) Establishment of a Community-Based Water Watch Initiative:
5) Suggested Timeline for Implementation:
5.3 Future research directions
While this study provides a valuable snapshot of current groundwater quality in Ikom LGA, additional research is needed to strengthen water resource management efforts. The following areas are recommended:
1) Longitudinal Groundwater Monitoring:
2) Source Attribution Studies:
3) Microbiological and Emerging Contaminants Analysis:
4) Health Impact Assessments (HIA):
By translating data into clear policy actions and extending the scientific inquiry into emerging issues, this study not only provides a baseline but also a pathway toward evidence-based water governance in Ikom and similar peri-urban communities.
[1] Arya, S., Subramani, T., Vennila, G., Roy, P.D. (2020). Groundwater vulnerability to pollution in the semi-arid Vattamalaikarai River Basin of South India through DRASTIC index evaluation. Geochemistry, 80(4): 125635. https://doi.org/10.1016/j.chemer.2020.125635
[2] El Alfy, M., Lashin, A., Abdalla, F., Al-Bassam, A. (2017). Assessing the hydrogeochemical processes affecting groundwater pollution in arid areas using an integration of geochemical equilibrium and multivariate statistical technique. Environmental Pollution, 229: 760-770. https://doi.org/10.1016/j.envpol.2017.05.052
[3] Jang, W.S., Engel, B., Harbor, J., Theller, L. (2017). Aquifer vulnerability assessment for sustainable groundwater management using DRASTIC. Water, 9(10): 792. https://doi.org/10.3390/w9100792
[4] Danert, K., Healy, A. (2021). Monitoring groundwater use as a domestic water source by urban households: Analysis of data from Lagos State, Nigeria and Sub-Saharan Africa with implications for policy and practice. Water, 13(4): 568. https://doi.org/10.3390/w13040568
[5] Petters, S.W., Ekweozor, C.M. (1982). Petroleum geology of benue trough and southeastern chad basin, Nigeria: Geologic notes. AAPG Bulletin, 66(8): 1141-1149. https://doi.org/10.1306/03B5A65B-16D1-11D7-8645000102C1865D
[6] American Public Health Association (APHA). (1998). Standard Methods for the Examination of Water and Wastewater (20th ed.). Washington, D.C.: American Public Health Association, American Water Works Association, and Water Environment Federation.
[7] World Health Organization (WHO). (2017). Guidelines for Drinking-Water Quality. Geneva: WHO Press. https://www.who.int/publications/i/item/9789241549950.
[8] Standards Organisation of Nigeria (SON). (2015). Nigerian Standard for Drinking Water Quality (NSDWQ). Lagos, Nigeria: SON.
[9] Akan, J.C., Abdulrahman, F.I., Yusuf, E. (2010). Physical and chemical parameters in abattoir wastewater sample, maiduguri metropolis, Nigeria. The Pacific Journal of Science and Technology, 11(1): 640-648.
[10] Eteng, E.O., Offiong, V.E., Offiong, R.A. (2013). Effects of sanitary landfills on surface water quality in Calabar Municipality, Cross River State. Journal of Biodiversity and Environmental Sciences, 3(8): 73-82.
[11] Igwemmar, N.C., Kolawole, S.A., Okunoye, S.O. (2013). Heavy metal concentration in fish species sold in Gwagwalada market, Abuja. International Journal of Science and Research (IJSR), 2(11): 7-9.
[12] Oyem, H.H., Oyem, I.M., Ezeweali, D. (2014). Temperature, pH, electrical conductivity, total dissolved solids and chemical oxygen demand of groundwater in Boji-Boji Agbor/Owa Area and immediate suburbs. Research Journal of Environmental Sciences, 8(8): 444-450. https://doi.org/10.3923/rjes.2014.444.450
[13] Braga, J.K., Hardoim, E.L., Dores, E.F.G.C., Heckman, C.W. (2014). Pesticide influence on the desmid flora of a reservoir in an agricultural region at Campo Verde, Mato Grosso, Brazil. Journal of Environmental Protection, 5(12): 1116-1125. https://doi.org/10.4236/jep.2014.512110
[14] Ewa, E.E., Iwara, A.I., Adeyemi, J.A. (2011). Impact of industrial activities on water quality of Omoku creek. Sacha Journal of Environmental Studies, 1(2): 8-16.
[15] Foster, S., Hirata, R., Eichholz, M., Alam, M.F. (2022). Urban self-supply from groundwater — An analysis of management aspects and policy needs. Water, 14(4): 575. https://doi.org/10.3390/w14040575
[16] Liu, F., Nord, N.B., Bester, K., Vollertsen, J. (2020). Microplastics removal from treated wastewater by a biofilter. Water, 12(4): 1085. https://doi.org/10.3390/w12041085
[17] Zohud, A., Alam, L., Goh, C.T. (2023). Evaluation of groundwater quality using the Water Quality Index (WQI) and human health risk (HHR) assessment in West Bank, Palestine. Hydrology, 10(10): 198. https://doi.org/10.3390/hydrology10100198
[18] Ram, A., Tiwari, S.K., Pandey, H.K., Chaurasia, A.K., Singh, S., Singh, Y.V. (2021). Groundwater quality assessment using water quality index (WQI) under GIS framework. Applied Water Science, 11: 46. https://doi.org/10.1007/s13201-021-01376-7
[19] El Baba, M., Kayastha, P., Huysmans, M., De Smedt, F. (2020). Evaluation of the groundwater quality using the Water Quality Index and geostatistical analysis in the Dier al-Balah Governorate, Gaza Strip, Palestine. Water, 12(1): 262. https://doi.org/10.3390/w12010262
[20] Barbosa Filho, J., de Oliveira, I.B. (2021). Development of a groundwater quality index: GWQI, for the aquifers of the state of Bahia, Brazil using multivariable analyses. Scientific Reports, 11: 16520. https://doi.org/10.1038/s41598-021-95912-9