Isnella Maella Dago![]() | Kasi Njeudjang*
| Kasi Njeudjang*![]() | Hassan Ibrahim Abakar
| Hassan Ibrahim Abakar![]() | Darel Fouazong Sontia
| Darel Fouazong Sontia![]() | Noel Nyang Kibanya
| Noel Nyang Kibanya![]() | Philippe Njandjock Nouck
| Philippe Njandjock Nouck![]()
© 2024 The authors. This article is published by IIETA and is licensed under the CC BY 4.0 license (http://creativecommons.org/licenses/by/4.0/).
OPEN ACCESS
The well called X (for confidential reasons) put into production in 2003 presents excessive water inflows a few years after it was put into production. The aim of this paper is to reduce this water flow through the chemical injection method. The available PVT, reservoir, and completion data are analyzed by using the nodal and sensitivity analysis methods. The results obtained show that initially the well X produced 509.1 STB/d of liquid, i.e. 71.3 STB/d of oil and 437.9 STB/d of water for a water cut of 86%. After flooding the tank with 80,000 ppm of polymers and 2,000 ppm of gels, the variation in viscosity followed by the decrease in oil saturation and the increase in water saturation will lead to a decrease in water cut (percentage of water production) up to 0%. This reduction in water cut is lighten the hydrostatic column so the liquid production rate is 2,572.5 STB/d of liquids, i.e. 2,058 STB/d of oil and 514.5 STB/d of water for a water cut of 20%. The economic report shows a minimum profit of $55,923,628 with a return on investment over a period of 1 month after the project is put into operation.
excessive water inflows, polymers and gels, production flow, saturation, temperature, economic report
For the past seven decades, oil has greatly been of use in homes, industries and for automobiles in most developed countries [1-6]. The existence of an adverse factor affecting oil production could have an impact on a country's economy and way of life [7, 8]. Several studies have shown that excessive water production is one of the main causes of a producing well's economic downfall, since the cost of separating, treating and disposing of produced water is a heavy burden on oil industry budgets [9, 10]. More than 40 billion dollars are spent annually on disposing of the excess water produced by the world's oil industry [11]. Excessive water inflow into an oil well has a negative impact on the well. Firstly, it leads to reservoir pressure decline which means the pressure available to drive oil towards the wellbore is lower than normal [12]. Secondly, water coning and channeling can take place whereby water from an underlying aquifer is drawn into the wellbore, leading to reduced oil recovery. Also, an increase in water production decreases the proportion of oil in the produced fluids. This high water cut means less oil is being produced [13]. In addition, treating, handling and disposing of produced water add to operational expenses since facilities must be designed or adapted to separate and manage the water, which can be costly. Moreover, in fields where waterflooding or other water-based enhanced oil recovery (EOR) techniques are used, managing excessive water production becomes even more critical. EOR refers to a set of techniques used to increase the amount of crude oil that can be extracted from an oil field. These techniques are employed after the primary and secondary recovery methods become ineffective. The primary method relies on natural reservoir pressure, and the secondary method typically involves water flooding to displace oil. EOR methods include thermal recovery, gas injection and chemical injection. Thermal recovery involves the introduction of heat, such as steam injection, to reduce the viscosity of the oil, making it easier to extract. Chemical injection involves injecting gases like carbon dioxide (CO₂), nitrogen, or natural gas to mix with the oil, reduce its viscosity, and push it towards production wells whereas chemical injection involves the injection of chemicals like polymers or surfactants to improve the mobility of the oil and increase its flow towards the production wells. Balancing the injected and produced fluids to optimize oil recovery can be challenging when there is excessive water inflow. High water production can mask the true performance of an oil reservoir, making it difficult to accurately assess reservoir properties and predict future production [14]. This complicates reservoir management and the design of production strategies. On the other hand, excessive water production during oil production can limit the life of oil and gas wells and can cause several problems including tubular corrosion due to high water salinity, fine migration and hydrostatic loading [15]. Therefore, a better understanding of water formation leads to a better perception of scientific progress and technological development in the oil and gas industry [16, 17]. Based on the hypothesis that the variation of the water cut (percentage of water production) would be an optimal parameter for justifying the phenomenon of water influx in a production well. This is the case for well X, and as soon as it came on stream in 2003, the oil production rate fell rapidly as a result of excessive water production. Several techniques can be used to improve production and the lifespan of well X. These include: the mechanical solution; the chemical solution and the completion solution [18-20].
Two researchers worked on water flow in the Jake field in south-east Sudan [21]. A few months after it came on stream, the water cut was up to 60%. This had an impact on oil production. A total of 14 MMBBL of water was produced up to the end of 2014. They injected nitrogen and lead into the reservoir to mitigate the inflow of water. This method reduced overall water production in the field from 60% to around 30%. But after a short period, water production started up again. So, to control the production rate from well X, would chemical injection be the best method of mitigating water inflow? The main aim of this paper is to test chemical injection as an effective method of mitigating water ingress. The specific objectives linked to achieving this aim are: to analyze the performance of the well prior to implementation of the method; to implement the method for controlling water inflow; to evaluate the performance of the well after implementation; and to evaluate the economics of the project. Two approaches are adopted for this study: nodal analysis and sensitivity analysis using Reveal and Prosper software. This paper is structured in 5 sections. Section 1 presents the introduction. Section 2 presents the methodology. Section 3 presents the data, the software used to achieve the objectives and the various results. Section 4 presents the results and discussion, and section 5 presents the conclusion.
The production, reservoir, pressure-volume-temperature (PVT) and completion data for well X are collected over a number of years. In each case, the amount of oil produced as well as the water accompanying it are recorded. The percentage of water present is also calculated. This is done over a period ranging from July 2003 to March 2010. Then, nodal and sensitivity analysis of the production, PVT, reservoir and completion data is done to compare the oil production with the amount of water produced. Gel is then injected into the well and the oil saturation and water saturation studied. The flow rate of liquid produced, the flow rate of water produced and the flow rate of oil produced, the mass of gel produced and the viscosity of water produced are evaluated in order to have an idea of how the injection of polymers and gels affects the well. Then, the variation in the quantity of water produced as a function of the quantity of polymer injected is studied. The various IPR and VLP curves are plotted to evaluate the global impact of the injection of chemicals well production and water cut. Finally, the NPV curve permits us to analyze whether the project is profitable or not and also the time required to achieve and return on investment and start making profit.
Production, reservoir, pressure-volume-temperature (PVT) and well or completion data are presented in Tables 1 and 2.
Table 1. Production data of well X
|
Year |
Oil Production |
Water Production |
Water Percentage |
|
01/07/2003 |
17,917 |
359 |
2.0% |
|
01/08/2003 |
74,160 |
2,059 |
2.7% |
|
01/09/2003 |
61,566 |
3,727 |
5.7% |
|
01/10/2003 |
88,121 |
3,884 |
4.3% |
|
01/11/2003 |
75,216 |
9,531 |
11.2% |
|
01/12/2003 |
75,658 |
10,025 |
11.7% |
|
01/01/2004 |
70,887 |
12,295 |
14.8% |
|
01/02/2003 |
65,846 |
20,132 |
23.4% |
|
01/03/2004 |
64,557 |
26,853 |
29.4% |
|
01/04/2004 |
62,520 |
26,602 |
29.8% |
|
01/05/2004 |
56,636 |
24,083 |
29.8% |
|
01/06/2004 |
53,969 |
30,888 |
36.4% |
|
01/07/2004 |
51,795 |
40,827 |
44.1% |
|
01/08/2004 |
58,207 |
60,036 |
50.8% |
|
01/09/2004 |
52,491 |
51,082 |
49.3% |
|
01/10/2004 |
51,020 |
35,237 |
40.9% |
|
01/11/2004 |
48,608 |
51,431 |
51.4% |
|
01/12/2004 |
50,631 |
70,123 |
58.1% |
|
01/01/2005 |
47,932 |
77,356 |
61.7% |
|
01/01/2005 |
45,919 |
78,489 |
63.1% |
|
01/03/2005 |
48,699 |
89,442 |
64.7% |
|
01/04/2005 |
46,222 |
92,246 |
66.6% |
|
01/05/2005 |
45,707 |
89,374 |
66.2% |
|
01/06/2005 |
45,221 |
83,134 |
64.8% |
|
01/07/2005 |
42,839 |
100,835 |
70.2% |
|
01/08/2005 |
42,249 |
94,916 |
69.2% |
|
01/09/2005 |
41,486 |
106,905 |
72.0% |
|
01/10/2005 |
38,921 |
106,627 |
73.3% |
|
01/11/2005 |
34,835 |
109,478 |
75.9% |
|
01/12/2005 |
35,644 |
114,267 |
76.2% |
|
01/01/2006 |
36,469 |
113,852 |
75.7% |
|
01/01/2006 |
36,123 |
114,659 |
76.0% |
|
01/03/2006 |
34,549 |
117,980 |
77.3% |
|
01/04/2006 |
33,680 |
123,944 |
78.6% |
|
01/05/2006 |
33,258 |
124,281 |
78.9% |
|
01/06/2006 |
32,535 |
124,027 |
79.2% |
|
01/07/2006 |
37,085 |
135,868 |
78.6% |
|
01/08/2006 |
35,301 |
134,674 |
79.2% |
|
01/09/2006 |
33,469 |
123,397 |
78.7% |
|
01/10/2006 |
31,849 |
119,926 |
79.0% |
|
01/11/2006 |
32,370 |
120,685 |
78.9% |
|
01/12/2006 |
31,085 |
124,726 |
80.0% |
|
01/01/2007 |
30,435 |
139,222 |
82% |
|
01/02/2007 |
30,353 |
132,193 |
81% |
|
01/03/2007 |
30,804 |
145,846 |
83% |
|
01/04/2007 |
27,850 |
143,886 |
84% |
|
01/05/2007 |
26,384 |
139,261 |
84% |
|
01/06/2007 |
24,685 |
132,182 |
84% |
|
01/07/2007 |
23,850 |
133,821 |
85% |
|
01/08/2007 |
24,975 |
133,191 |
84% |
|
01/09/2007 |
24,890 |
130,490 |
84% |
|
01/10/2007 |
25,058 |
127,979 |
84% |
|
01/11/2007 |
23,756 |
127,540 |
84% |
|
01/12/2007 |
22,943 |
141,960 |
86% |
|
01/01/2008 |
22,419 |
149,653 |
87% |
|
01/02/2008 |
21,955 |
153,247 |
87% |
|
01/03/2008 |
21,291 |
143,794 |
87% |
|
01/04/2008 |
20,945 |
141,407 |
87% |
|
01/05/2008 |
21,304 |
150,522 |
88% |
|
01/06/2008 |
20,690 |
148,146 |
88% |
|
01/07/2008 |
20,209 |
139,682 |
87% |
|
01/08/2008 |
18,553 |
132,981 |
88% |
|
01/09/2008 |
18,131 |
130,035 |
88% |
|
01/10/2008 |
18,285 |
131,722 |
88% |
|
01/11/2008 |
17,724 |
130,487 |
88% |
|
01/12/2008 |
17,953 |
137,108 |
88% |
|
01/01/2009 |
17,915 |
144,542 |
89% |
|
01/02/2009 |
17,012 |
139,731 |
89% |
|
01/03/2009 |
17,346 |
141,122 |
89% |
|
01/04/2009 |
17,964 |
150,643 |
89% |
|
01/05/2009 |
21,249 |
155,106 |
88% |
|
01/06/2009 |
21,752 |
146,064 |
87% |
|
01/07/2009 |
21,905 |
153,624 |
88% |
|
01/08/2009 |
20,233 |
154,238 |
88% |
|
01/09/2009 |
17,561 |
140,281 |
89% |
|
01/10/2009 |
17,447 |
140,599 |
89% |
|
01/11/2009 |
19,224 |
141,084 |
88% |
|
01/12/2009 |
20,784 |
146,426 |
88% |
|
01/01/2010 |
23,911 |
138,317 |
85% |
|
01/02/2010 |
22,319 |
132,947 |
86% |
|
01/03/2010 |
20,923 |
127,124 |
86% |
Table 2. PVT, reservoir and completion data of well X
|
Parameters |
Values |
|
Tank level |
M1-M10 |
|
Tank temperature (°F) |
140 |
|
Oil density (API) |
25.1 |
|
Gas density (sg) |
0.584 |
|
Water density (sg)/salinity (ppm) |
500 |
|
Bubble point pressure (psi) |
446 |
|
CO2 (%) |
0.7 |
|
N2 (%) |
1.75 |
|
Tank height (ft) |
30 |
|
Cross porosity (ft) |
0.229 |
|
Water saturation (%) |
0.377 |
|
Reservoir permeability (darcy) |
3.2 |
|
Reservoir porosity (%) |
0.23 |
|
Tank pressure (psi) |
1801 |
|
GOR in solution |
48 |
|
Oil volumetric factor |
1.0586 |
|
Oil viscosity (Cp) |
31.37 |
|
Skin |
10 |
|
Standard tubes |
3.958 |
|
Standard casing |
8.679 |
The production data shown in Table 1 illustrate the variations in water and oil production as a function of time. This will give a superficial idea of reservoir depletion and the monthly quantities of oil and water production. PVT, reservoir and completion data of well X are presented in Table 2.
The data in Tables 1 and 2 are analyzed using Reveal and Prosper software.
3.1 Nodal and sensitivity analyses
This subsection presents the results of the analysis of production, PVT, reservoir and completion data using nodal and sensitivity analysis methods. The study of initial well performance is presented in Figure 1.
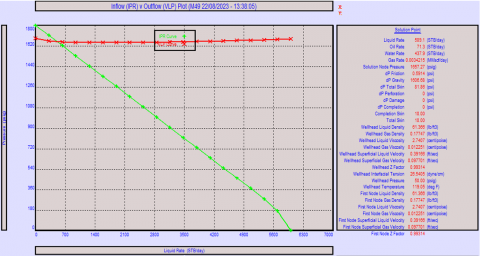
Figure 1. IPR and VLP of well X in the initial state
Figure 1 shows that 509.1 STB/day of liquid is initially produced, i.e., 71.3 STB/day of oil and 437.9 STB/day of water. It is clear that the water production rate is much higher than the oil production rate. Hence the problem of water coming in, which requires a chemical injection method to mitigate it. During the chemical injection method, 80,000 ppm of polymers and 2,000 ppm of gel are injected into well X over a period of 120 days. It is important to note that the injection operation is carried out at the same time as production. Figure 2 shows an illustrative model of the injection of polymers and gels into the reservoir.
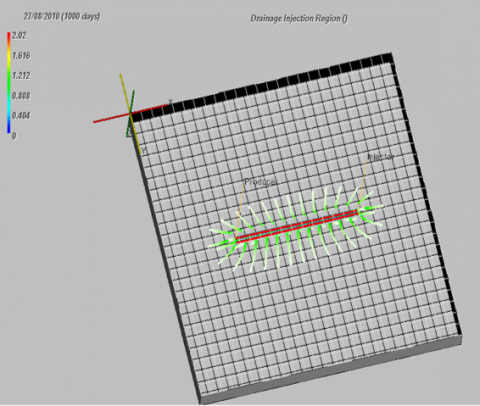
Figure 2. Illustration of the injection of polymers/gels into the reservoir
The injection well is placed below the production well to make it easier to carry out the operation, as shown in Figure 2. This injection varies a number of parameters, in particular in: the well and the reservoir. This makes it possible to determine the impact of polymer and gel injection on the oil production rate. Figure 3 shows the variations in water and oil saturation as a function of time.
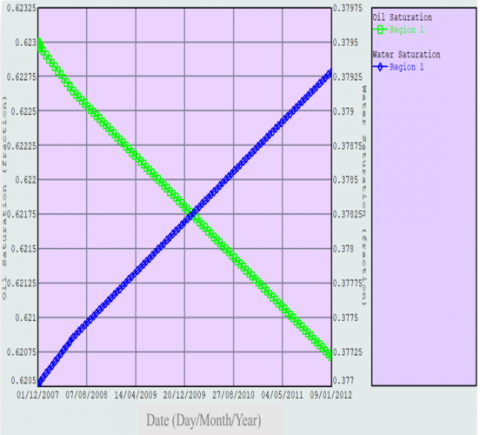
Figure 3. Variations in water saturation and oil saturation
The increase in productivity as a function of time will lead to an increase in water saturation and a decrease in oil saturation as the reservoir is depleted, as shown in Figure 3. As in the reservoir, the injection of polymers and gels will also have a remarkable influence in the well. The impact of injecting polymers and gels into well X is characterized by the variation in 3 main parameters, namely: the flow rate of liquid produced, the flow rate of water produced and the flow rate of oil produced, the mass of gel produced and the viscosity of water produced. The variation in the quantity of water produced as a function of the quantity of polymer injected is illustrated in Figure 4.
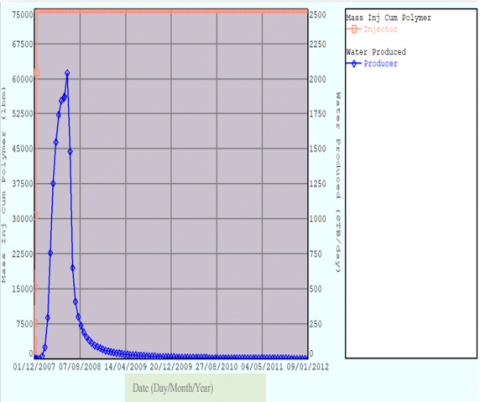
Figure 4. Variation in water production as a function of the quantity of polymers injected
When polymers are injected, the viscosity of the water increases due to the gelling of the water by the polymers. This increase will therefore have an impact on water production (see Figure 4). The increase in the quantity of polymers injected results in a decrease in the water production rate, as shown in Figure 4. This leads to an increase in the oil production rate. The variation in water viscosity as a function of time is illustrated in Figure 5.
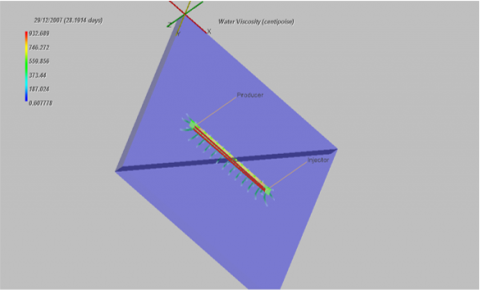
Figure 5. Variation in produced water viscosity
The viscosity of the water here reflects the ability of the water to move from the reservoir to the production well and then from the production well to the surface (see Figure 5). It is important to note that 29 days after chemical injection, the viscosity of the water varies between 373.44 Cp and 746.27 Cp. This makes it difficult to displace the water in favor of the oil, as shown in Figure 5. The variation in the flow rate of oil produced and the water cut (percentage of water production) as a function of time is illustrated in Figure 6.
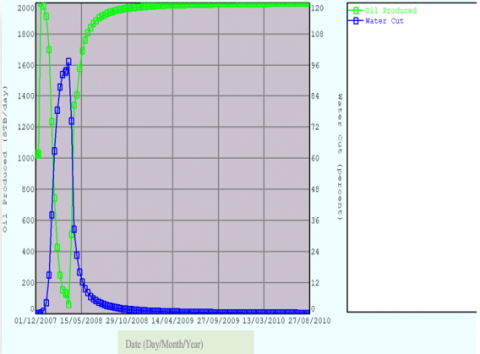
Figure 6. Variation in oil flow rate and water cut as a function of time
Figure 6 shows that on 31/03/2008, the water production flow rate is estimated at 3.6125 STB/day and the water cut at 72.25%, indicating high water production. However, after this date, it is important to note that oil production will increase considerably compared to the water cut due to water gelation. The variation in the flow rate of water produced and the mass flow rate of gel produced as a function of time is illustrated in Figure 7.
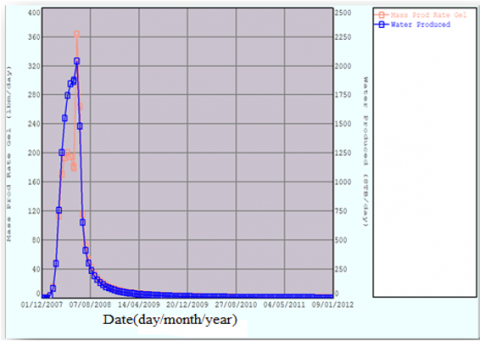
Figure 7. Variation in the mass flow rate of gel produced and water produced as a function of time
It is important to note in Figure 7 that gel injection takes effect from 31/03/2008. This translates into gel production of 2,252.5 BM/d and 360 STB/d of water. These different production rates at the operating point can be quantified using the RPN and VLP curves. Figure 8 shows the IPR and VLP curves after injection of the polymers and gels.
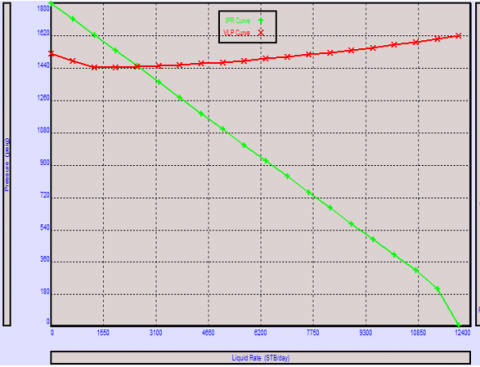
Figure 8. IPR and VLP curve after injection of polymers and gels
Figure 8 shows that the oil production rate is much higher than the water production rate. For in 2,572.5 STB/day of liquid produced, there are 2,058 STB/day of oil and 514.5 STB/day of water with a water cut of 20%. This phenomenon is due to the lightening of the hydrostatic column as a result of the reduction in head losses and the increase in oil density.
3.2 Economic analysis
Table 3 shows total expenditures of the project.
Table 3. Total expenditures of the project
|
Items |
Expenditure ($) |
|
Cost of water treatment over 5 years |
1,408,444 |
|
Equipment installation |
14,000,000 |
|
Cost of operation |
8,000,000 |
|
Price of oil production |
3,320,665 |
|
Price of employee salaries + platform maintenance |
400,451 |
|
Total |
27,129,560 |
Total project expenditure is estimated at $27,129,560 in Table 3. Table 4 shows the net present value (NPV) as a function of three selling prices per barrel of oil: $50, $78 and $90.
Table 4. Variation in NPV as a function of three selling prices per barrel of oil
|
Base NPV |
Medium NPV |
High NPV |
|
-17,112,523.12 |
-16,515,959.12 |
-1,5919,395.12 |
|
1,817,745.091 |
2,741,772.364 |
3,665,799.636 |
|
1,519,439.067 |
2,303,112.092 |
3,086,785.117 |
|
1,519,295.751 |
2,290,165.923 |
3,061,036.096 |
|
1,419,582.786 |
2,136,638.978 |
2,853,695.169 |
|
1,241,432.198 |
1,872,507.758 |
2,503,583.318 |
|
1,174,143.103 |
1,767,147.171 |
2,360,151.239 |
|
1,026,656.763 |
1,548,494.694 |
2,070,332.626 |
|
970,935.0847 |
1,461,262.024 |
1,951,588.963 |
|
848,716.6919 |
1,280,089.366 |
1,711,462.039 |
|
802,790.2975 |
1,208,173.591 |
1,613,556.884 |
|
701,878.8042 |
1,058,579.986 |
1,415,281.167 |
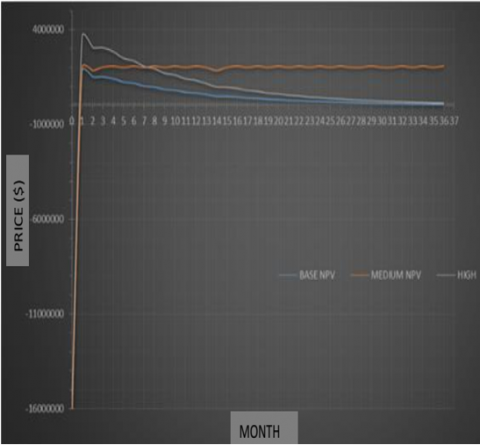
The results obtained in Table 4 are used to plot the variation in NPV as a function of time in Figure 9.
Figure 9. Variation of NPV with time
Figure 9 shows that the project's return on investment will be 1 month after the well comes on stream. After the well is put into production, the project is profitable regardless of the selling price of a barrel of oil, as shown by the variations in profit: $55,923,628 (selling price of a barrel of oil at $50), $93,557,825 (selling price of a barrel of oil at $78) and $131,192,022 (selling price of a barrel of oil at $90).
When polymers are added to water, they increase its viscosity. This thickened water can more effectively push the oil through the reservoir. The increased viscosity of the water helps to improve the mobility ratio, which is the ratio of the displacing fluid's mobility (water) to the displaced fluid's mobility (oil). A favorable mobility ratio ensures that the water pushes the oil more evenly and reduces the fingering effect, where water bypasses oil and reduces sweep efficiency. By making the injected water more viscous, polymers help in achieving a more uniform displacement of oil. This results in better sweep efficiency and more oil being pushed towards the production wells. The increased viscosity also helps to delay the breakthrough of water, allowing more oil to be produced before significant amounts of water are produced.
On the other hand, the gels block high-permeability zones or fractures within the reservoir. These zones tend to allow water to flow through preferentially, bypassing oil-rich areas. By blocking these zones, gels redirect the flow of injected fluids (water, polymers, or CO₂) to less permeable, oil-rich areas. They modify the injection profile by plugging high-permeability streaks or fractures, which helps to distribute the injected fluids more evenly throughout the reservoir. By blocking high-permeability zones, gels force the injected fluids to sweep through more of the reservoir, improving the displacement of oil. Gels help to reduce water production from high-permeability zones, which significantly improves the oil-to-water ratio in the produced fluids.
The combination of gels and polymers is very effective. The polymers improve the mobility control of the injected water, while the gels provide conformance control by blocking high-permeability zones. This combined approach enhances sweep efficiency and oil recovery more effectively than using either method alone.
Now, let us look at the relative advantages of the chemical method oil other EOR methods. Primary recovery relies on natural reservoir pressure and typically recovers only about 10-20% of the original oil in place (OOIP). Chemical EOR can significantly increase this recovery factor. While waterflooding can improve recovery to around 30-50% OOIP, it can suffer from poor sweep efficiency and early water breakthrough. Chemical EOR addresses these limitations by improving mobility control and sweep efficiency. Thermal methods like steam flooding require significant energy input, making them less suitable for reservoirs with low permeability or high depth. Chemical methods can be more energy-efficient and applicable in a wider range of reservoirs. Thermal methods are not suitable for all types of reservoirs, particularly those with high water saturation or low oil viscosity. Chemical methods can be more versatile in different reservoir conditions.
The effectiveness of gas injection depends on the availability and cost of gases like CO₂. Chemical methods, particularly in regions with limited gas resources, can be more viable. This method can suffer from poor sweep efficiency due to gas channeling. Chemical EOR methods, particularly with the use of polymers and gels, can provide better sweep efficiency.
By leveraging the specific advantages of chemical injection methods, operators can enhance oil recovery more effectively and economically, particularly in challenging reservoirs where other methods may fall short.
The aim of the paper was to mitigate water ingress by injecting polymers and gels into well X, which has a water cut of 86%. Using production, PVT, reservoir and completion data, the nodal analysis, control method implementation, sensitivity analysis and economic evaluation methods were applied and the following results were obtained.
The initial well performance curve was obtained with a water production rate of 437.9 STB/d and an oil production rate of 71.3 STB/d for 509.1 STB/d of liquid produced with a water cut of 86%.
After injecting the polymers and gels, the viscosity of the water increased. This led to a reduction in the water cut and an increase in oil production. In the reservoir, water saturation increased correlatively with the drop in oil due to the high productivity of the well. The liquid production rate increased remarkably, to 2,572.5 STB/d, due to the reduction in head losses and the lightening of the hydrostatic column. The oil production flow rate will vary upwards while that of the water will vary downwards. In this case, 2,058 STB/d of oil are produced and 514 STB/d of water.
The validity of the project was demonstrated by the positive net present value 1 month after well X started producing and a minimum net cash flow of $55,923,628. When polymers and gels are injected into the oil well, the polymers improve the mobility control of the injected water, while the gels provide conformance control by blocking high-permeability zones. This combined approach enhances sweep efficiency and oil recovery more effectively than using either method alone. The study however has some limitations. For a better prediction of water inflows during production, it would be preferable to: monitor the aquifer volume before production to better predict inflows and monitor the decline curve to know exactly when the well will stop production.
[1] John, S. (2018). Forecasting Oil and Gas Producing for Unconventional Wells. Petro, Denver.
[2] Kamga Ngankam, R.M., Dongmo, E.D., Nitcheu, M., Matateyou, J.F., Kuiatse, G., Takougang Kingni, S. (2022). Production step-up of an oil well through Nodal analysis. Journal of Engineering, 2022(1): 6148337. https://doi.org/10.1155/2022/6148337
[3] Miller, R.G., Sorrell, S.R. (2014). The future of oil supply. Philosophical Transactions of the Royal Society A: Mathematical, Physical and Engineering Sciences, 372(2006): 20130179. https://doi.org/10.1098%2Frsta.2013.0179
[4] Guliev, I.S., Kerimov, V.Y., Etirmishli, G.D., Yusubov, N.P., Mustaev, R.N., Huseynova, A.B. (2021). Modern geodynamic processes and their impact on replenishment of hydrocarbon resources in the Black Sea-Caspian Region. Geotectonics, 55: 393-407. https://doi.org/10.1134/S0016852121030055
[5] Fanchi, J.R., Christiansen, R.L. (2016). Introduction to Petroleum Engineering. John Wiley & Sons, New York, USA.
[6] Matateyou, J.F., Karga, L.T., Nitcheu, M., Kom, O.G.D., Ngueyep, L.L.M., Kingni, S.T. (2022). Activation of a non-eruptive well by using gas lift method and step-up of its productivity: Sensitivity and economical analysis. International Journal of Petroleum Engineering, 4(1): 65-79. https://doi.org/10.1504/IJPE.2022.127212
[7] Abdullah, T., Amani, M. (2019). Overview in water shutoff operation in oil and gas well; chemical and machanical solutions. ChemEngineering, 3(2): 51-85. https://doi.org/10.3390/chemengineering3020051
[8] Bakke, T., Klungsøyr, J., Sanni, S. (2013). Environmental impacts of produced water and drilling waste discharges from the Norwegian offshore petroleum industry. Marine Environmental Research, 92: 154-169. https://doi.org/10.1016/j.marenvres.2013.09.012
[9] Armenta, M. (2003). Mechanisms and control of water inflow to wells in gas reservoirs with bottom-water drive. Ph.D. dissertation. Department of Petroleum Engineering, Louisiana State University and Agricultural & Mechanical College, Baton Rouge, LA, USA.
[10] Bailey, B., Crabtree, M., Tyrie, J., Elphick, J., Kuchuk, F., Romano, C., Roodhart, L. (2000). Water control. Oilfield Review, 12(1): 30-51.
[11] Mohammadi, H.A. (2018). Diagnostique and attacking excessive water production. Data Science, 49-65.
[12] Crumpton, H. (2018). Well Control for Completions and Interventions. Gulf Professional Publishing, Oxford, United Kingdom.
[13] Wang, M., Fan, Z., Zhao, W., Ming, R., Zhao, L., Tan, C., Zhang, J., Li, W. (2021). Inflow performance analysis of a horizontal well coupling stress sensitivity and reservoir pressure change in a fractured-porous reservoir. Lithosphere, 2021(Special 1): 7024023. https://doi.org/10.2113/2021/7024023
[14] Scanlon, B.R., Ikonnikova, S., Yang, Q., Reedy, R.C. (2020). Will water issues constrain oil and gas production in the United States? Environmental Science & Technology, 54(6): 3510-3519. https://doi.org/10.1021/acs.est.9b06390
[15] Aminian, K. (2003). Water production problems and solutions-Part I. Dissertation, Petroleum & Natural Gas Engineering Department, West Virginia University, Morgantown, West Virginia, USA.
[16] Kozyrev, I., Zyatikov, P.N., Deeva, V.S. (2016). Solving excess water production problems in productive formation. In MATEC Web of Conferences. Vol. 72: Heat and Mass Transfer in the System of Thermal Modes of Energy-Technical and Technological Equipment (HMTTSC-2016). Les Ulis, France, p. 1049.
[17] Emhanna, S., Andalrhman, G., Mukhtar, W., Mohamed, A. (2021). Effect of associated produced water with crude oil on groundwater. University Bulletin, 3(23): 247-268.
[18] Al-Kayiem, H.H., Jamil, I.E. (2017). Fundamental investigation of the oil/water flow emulsion in the downhole by CFD simulation. WIT Transactions on Ecology and the Environment, 224: 541-551. http://doi.org/10.2495/ESUS170501
[19] Bedaiwi, E., Al-Anazi, B.D., Al-Anazi, A.F., Paiaman, A.M. (2009). Polymer injection for water production control through permeability alteration in fractured reservoir. Nafta, 60(4): 221-231.
[20] Kolher, N., Lessi, J., Tabary, R. (1995). Successful application cases of water control treatments in Russia. Revue de lInstitut Francais du Petrole, 50.
[21] Mahgoup, M., Khair, E. (2015). Excessive water production diagnostic and control-case study Jake oil field-Sudan. International Journal of Sciences: Basic and Applied Research (IJSBAR), 23(2): 81-94.