Apollinaire Bouba*![]() | Kasi Njeudjang
| Kasi Njeudjang![]() | Mono Jean Aime
| Mono Jean Aime![]() | Abdou Raouf
| Abdou Raouf![]() | Franck Eitel Kemgang Ghomsi
| Franck Eitel Kemgang Ghomsi![]() | Luan Thanh Pham
| Luan Thanh Pham![]()
© 2024 The authors. This article is published by IIETA and is licensed under the CC BY 4.0 license (http://creativecommons.org/licenses/by/4.0/).
OPEN ACCESS
In the context of geological research, the delineation of structural lineaments beneath sedimentary basins is pivotal for understanding subsurface features. This study presents a comprehensive analysis of the Garoua sedimentary basin (GSB) utilizing the high-resolution SGG-UGM-2 model, which offers a refined depiction of the Earth's gravity field. The primary objective was to elucidate the structural lineaments underpinning the basin. To achieve this, a suite of advanced edge-detection filters was employed, including the analytical signal, the total horizontal gradient, a modified version of the tilt angle, the gradient amplitude’s tilt angle, and the fast sigmoid function. Each method was meticulously applied to the gravity data covering the Garoua basin. The application of these techniques was critically evaluated, focusing on their effectiveness in enhancing the resolution and clarity of the detected structural features. The results indicated that the fast sigmoid function filter exhibited superior performance, delineating more distinct edges with a notable absence of fictitious anomalies. This filter demonstrated a unique capability in balancing the anomalies attributed to both shallow and deep sources, thereby providing a more precise localization of edge structures within the basin. The ensuing structural map, primarily oriented along the NW-SE and ENE-WSW axes, emerges as a crucial resource. It offers invaluable insights for further investigations into potential hydrocarbon accumulations and groundwater sources. By pinpointing favorable locations for the existence or emergence of these resources, this map enhances the efficiency of exploratory efforts in the Garoua basin. The findings underscore the efficacy of the fast sigmoid function filter in geological studies, particularly in the context of gravity data analysis. This approach not only refines the understanding of subsurface structures but also paves the way for more targeted and effective exploration strategies in sedimentary environments.
gravity data, sedimentary basin, SGG-UGM-2, structural lineaments, edge detection filters
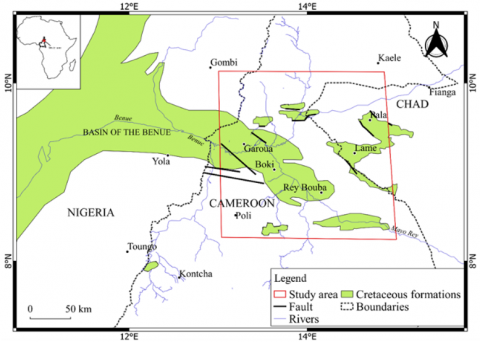
The Benue Trough's genesis is traced back to the South Atlantic's opening, following Gondwana's fragmentation. This geological feature initiates at the Gulf of Guinea, bifurcating into two distinct branches: the Gongola branch, extending into Nigeria, and the Yola-Garoua branch, which spans into Cameroon, encompassing the GSB and its associated satellite basins, namely, Babouri-Figuil, Mayo Oulo-Léré, Hamakoussou, and Koum (Figure 1).
Figure 1. Location map of the study area
Extensive studies have been conducted on the subsurface structure of the entire Benue Trough, leveraging magnetic and gravity data for interpretation. Previous works [1-5] have significantly contributed to this domain. The GSB, noted as one of Cameroon's most critical sedimentary basins, has been the focus of successful oil and gas exploration campaigns. In the realm of geology, comprehensive studies encompassing faciological, petrographic, mineralogical, and geochemical analyses have been undertaken to reconstruct sedimentary deposits' paleoenvironments, identify diverse sources, and evaluate the chemical alteration intensity in rocks. Concurrently, geophysical investigations [6-13] have revealed a central positive gravity anomaly flanked by two parallel negative anomalies in the GSB. The GSB's formation as a graben is attributed to the differential stresses induced by continental division [6, 14]. Further, gravity data from the study by Cratchley and Jones [13] was reinterpreted, suggesting that the central positive anomaly is due to basic rock composition injections [15].
Gravity data-based geological modeling in the GSB has been highlighted as a pivotal geophysical study [16]. These models are characterized by significant sandstone accumulation in the basin, with sediment thickness estimated at approximately 4 kilometers, likely influenced by the Cretaceous basin's extensional processes. The 2D modeling revealed dense bodies intruding the region's basement, posited as potential hydrocarbon exploration sites.
Magnetic and gravity data have been instrumental in deducing the depth, density, and geological boundaries of subsurface structures. In recent years, the application of edge detection techniques in deciphering geological boundaries has gained prominence [17-23]. Techniques such as the horizontal gradient, the total gradient, the tilt angle of the analytical signal amplitude (TAS), the Modified Theta Map (MTM), an enhanced logistic function, and the fast sigmoid function have proved effective. This study introduces an advanced edge detector filter, utilizing a modified fast sigmoid function to augment the total horizontal gradient of potential field anomalies. The efficacy of this novel method is demonstrated through gravity data analysis using the SGG-UGM-2 gravity model in the GSB.
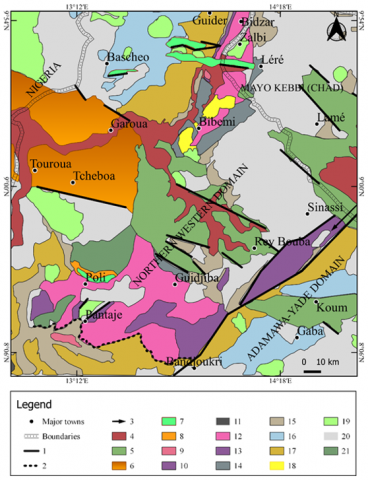
Spanning over 1,000 kilometers in the NE-SW direction, the Benue Trough, with widths ranging from 50 to 150 kilometers, represents a significant intraplate tectonic structure in Africa. It extends from the Niger Delta to Lake Chad, characterized by a sedimentary pile not exceeding 6,500 meters in depth [24] (Figure 2). The Trough is underlain by Precambrian granitic and metamorphic bedrock, which underwent reactivation during the Pan-African orogeny. Its formation is linked to the South Atlantic Ocean's opening in the Cretaceous period, consequent to Gondwana's disintegration [25]. The Trough's structural collapse is attributed to the development of folds and fractures [26].
Figure 2. Geological sketch map of the study area (modified from the studies [25-27])
Note: 1-Fault; 2-Thrust; 3-Sinistral strike-slip fault; 4-Quaternary alluvial deposition; 5-Cretaceous Benue Sandstone; 6-Cretaceous Garoua Sandstone; 7-Variety of Cretaceous Sediments; 8-Andesitic Type, 9-Acidic Type; and 10-Mafic Type; 11-Amphibolite; 12-Upper Micaschist; 13-Lower Micaschist; 14-Upper Gneiss; 15-Lower Gneiss; 16-Migmatitic Gneiss; 17-Embrechitic type; 18-post-tectonic granitoid; 19-pre-to syn-tectonic granitoid; 20-syn-to post-tectonic granitoid; 21-Grabbro
The GSB, situated within the Benue Trough, is a key feature in Northern Cameroon's geological landscape. The basin aligns predominantly in an E-W to N120 direction and is filled with Middle to Upper Cretaceous marine sandstones [27]. The basin comprises conglomerates, sandstones, and clay sediments, rich in fossils including dinosaur remains, vertebrates, and crustaceans [28]. Studies [29-32] have identified mud cracks in argillite beds, indicative of frequent emersion during sedimentation in shallow water environments. These studies also correlate the cessation of sedimentation with dry seasons, as evidenced by the ferruginous encrustations in Garoua sandstones [28]. The basin's foundation comprises syn-tectonic granites, referred to as porphyroid granites, and metamorphic rocks including gneiss and quartzites. Morphoscopic analysis of detrital quartz grains reveals lustrous and sub-sharp figured elements [29]. The northern and eastern parts of the basin are characterized by a basement of mylonites bands. The area is intersected by a network of veins and dykes, exhibiting volcanic occurrences within migmatites and granites. In the northern region, quartzo-feldspathic veins disrupt pyroxene gneisses, with occasional intrusions of garnet gneisses that have undergone deformation. Basalt, commonly found as surface intrusions, is the predominant volcanic rock in the region [33].
3.1 Data
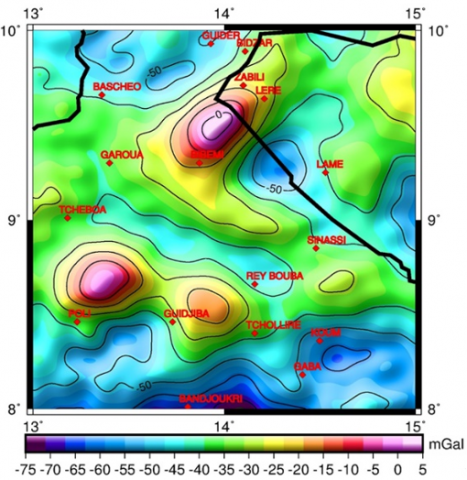
Recently, satellite gravity data have emerged as the most effective tools for the detection of potential field source data for the delineation of boundaries and geological structures [34-38]. In this study, we utilized gravity data derived from the SGG-UGM-2 model of the Earth's gravity field. By combining the observations of the Gravity Field and Steady-State Ocean Circulation Explorer (GOCE), the normal equation of the Gravity Recovery and Climate Experiment (GRACE), marine gravity data derived from satellite altimetry data, and EGM2008-derived continental gravity data, this model is constructed up to degree 2,190 and order 2,159. It is derived from the theory underlying the ellipsoidal harmonic analysis and coefficient transformation (EHA-CT) method for calculating the spherical harmonic coefficients from grid area-mean and point gravity anomalies on the ellipsoid [39, 40]. On the basis of numerical experiments, the derived formulas are evaluated successfully. GOCE models are more representative of geoid undulations and gravity anomalies in Africa than GRACE models. The SGG-UGM-2 model showed best performance in the GPS/leveling validation. This model provided high resolution data than all models of GRACE mission like GGM02, EGM2008 etc. The National Geospatial-Intelligence Agency (NGIA) provides the gravity data frequently used for investigating shallow and deep crustal structures and analyzing tectonic and dynamic processes. Figure 3 depicts the Bouguer gravity map corresponding to the study area. This map shows two main zones of anomalies: low and high zones. The low anomalies with the minimum of -75 mGal are observed in the south, north and east of the study area while the high anomalies with maximum of 5 mGal are observed in Bibemi, Poli and Garoua. These various gravity anomalies are separated by significant gradients which would represent the discontinuities materializing the fractures zones. The majority of figures are produced by computer using Generic Mapping Tools for reasons of objectivity [41].
Figure 3. Bouguer gravity map of the study area
3.2 Methodology
In this section, we describe the theoretical basis of the filters used for edge detection of potential fields in the GSB.
The analytical signal (AS) is one of the popular methods that [42] introduced. The AS is applied to enhance the boundaries of geological structures. For the gravity data F, AS is defined as follows:
$A S=\sqrt{\left(\frac{\partial F}{\partial x}\right)^2+\left(\frac{\partial F}{\partial y}\right)^2+\left(\frac{\partial F}{\partial z}\right)^2}$ (1)
where, $\frac{\partial F}{\partial x}, \frac{\partial F}{\partial y}$ and $\frac{\partial F}{\partial z}$ represent the gravity data gradients F.
The total horizontal gradient (THG) is a filter that produces maxima above the horizontal boundaries of the source and accentuates the edges. It can be stated as follows, according to the study by Cordell and Grauch [43]:
$T H G=\sqrt{\left(\frac{\partial F}{\partial x}\right)^2+\left(\frac{\partial F}{\partial y}\right)^2}$ (2)
where, $\frac{\partial F}{\partial x}$ and $\frac{\partial F}{\partial y}$ represent the gravity data gradients F.
The study by Cooper and Cowan [44] were the pioneers in developing the modified version of the tilt angle (TDX). This filter makes it possible to delineate the locations of lateral edges and source boundaries directly above its maximum values. The mathematical expression as follows:
$T D X=\arctan \left(\frac{T H G}{\left|\frac{\partial F}{\partial z}\right|}\right)$ (3)
The tilt angle of the gradient amplitude (TAHG) is calculated using the arctangent function and gradient amplitude derivatives. According to the study by Ferreira et al. [45], the TAHG is:
$T A H G=\arctan \left(\frac{\frac{\partial H G}{\partial z}}{\sqrt{\left(\frac{\partial H G}{\partial x}\right)^2+\left(\frac{\partial H G}{\partial y}\right)^2}}\right)$ (4)
where, $\frac{\partial H G}{\partial x}, \frac{\partial H G}{\partial y}$ and $\frac{\partial H G}{\partial z}$ are the horizontal gradient amplitude gradients that result from:
$H G=\sqrt{\left(\frac{\partial F}{\partial x}\right)^2+\left(\frac{\partial F}{\partial y}\right)^2}$ (5)
The fast sigmoid function (FSEG) of the horizontal gradient was introduced by Oksum et al. [46]. This filter increases the resolution and accuracy of edges from an enhancement of the horizontal gradient of the potential field anomalies. The proposed method provides maximum amplitudes and produces balanced image on the edges from deep and shallow geological sources. FSEG filter described by the equation below:
$F S E G=\frac{R-1}{1+|R|}$ (6)
where, $R=\frac{\frac{\partial T H G}{\partial z}}{\sqrt{\left(\frac{\partial T H G}{\partial x}\right)^2+\left(\frac{\partial T H G}{\partial y}\right)^2}}$.
Figure 4 depicts the flowchart used to map the structural lineaments of the GSB.
Figure 4. Flowchart for mapping the structural lineaments of the sedimentary basin of Garoua
4.1 Results
The study area is located in Northern Cameroon. The structures of this area are asymmetrical syn-sedimentary synclines superimposed on graben [16, 47]. In this area, however, there are insufficient studies devoted to the detection of subsurface structures. The gravity data used in this study were obtained from the SGG-UGM-2 model of the Earth’s gravity field. The SGG-UGM-2 data have a higher resolution and less error than EIGEN6C3 and EGM2008 [18]. Figure 3 depicts the Bouguer gravity map of the study area with free-air corrections applied. In addition, filters including the analytical signal (AS), the total horizontal gradient (THG), the modified version of the tilt angle (TDX), The tilt angle of the gradient amplitude (TAHG), and fast sigmoid function (FSEG) were applied to the gravity data.
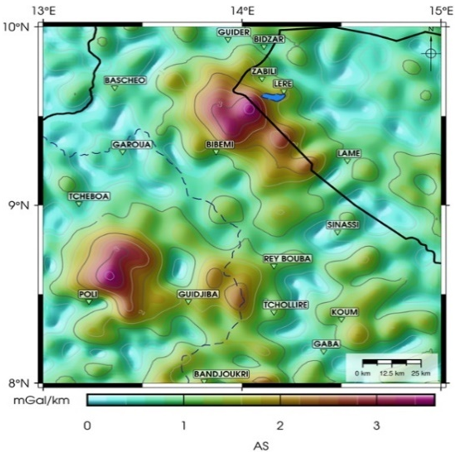
Figure 5 indicates the map of the AS filter. This filter does not adequately extract gravity lineaments and is unable to distinguish fracture zones from the dominant signal in the study area, which is a result of sedimentary formations. It makes the delineation of geological features extremely challenging.
Figure 5. Map of the analytical signal
Figure 6 illustrates the THG of gravity data. This filter is unable to detect a well-balanced image of the subsurface structures' lineaments. It produces unclear peaks and confusing information regarding geologic features.
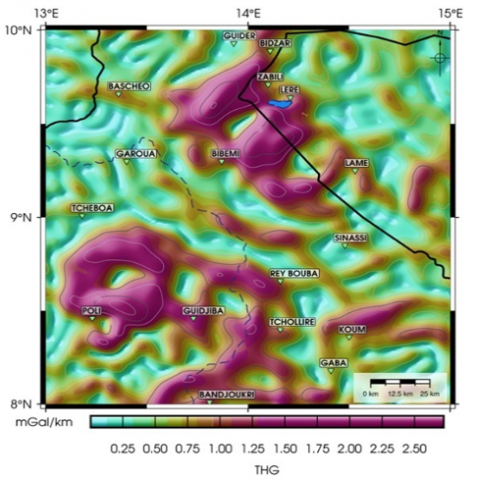
Figure 6. Map total horizontal gradient
Figure 7 depicts the TDX method. This filter is able to differentiate all source edges, but with low resolution. It is suited to outlining the edges of geological features, but the results it produces are fuzzy. The edges produced by this filter can make interpretation more difficult.
Figure 7. Map of modified tilt angle
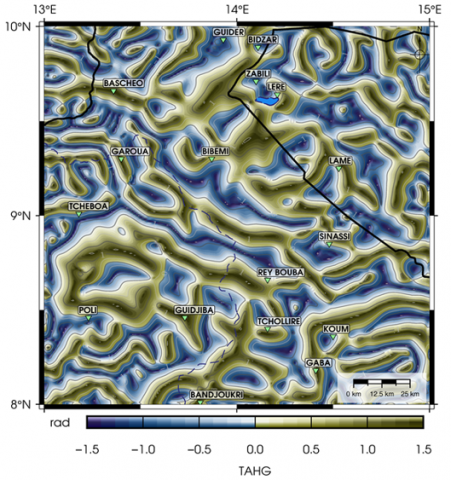
Figure 8 indicates the TAHG of gravity data. This method produces more effective lineaments than AS, THG, and TDX. Nonetheless, it is impossible to determine the precise outlines of the subsurface structures.
Figure 8. Map tilt angle of the horizontal gradient
Figure 9 shows the lineaments identified by the FSEG technique. Comparable to the TAHG method, the FSEG method is a balanced detector; consequently, detected boundaries are more distinct than with other methods. However, the FSEG method produces a more detailed map of lineaments.

Figure 9. Map of fast sigmoid function
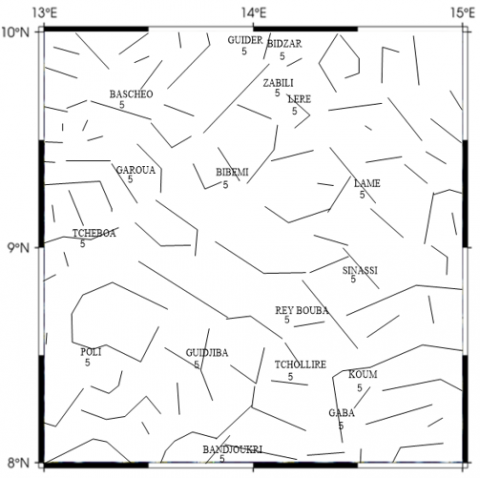
In addition, compared to the TAHG and other methods, this filter generates an image with improved resolution and more defined responses along the edges of the gravity sources in the GSB. The FSEG filter can eliminate any ambiguous results. Figure 10 displays all the tectonic characteristics associated with shallow and deep-seated geological entities with a dominant NE-SW trending lineament in the study area.
Figure 10. Lineaments extracted from the gravity data fast sigmoid function map
4.2 Discussion
The results of this study, which involved the analysis of gravity data, allowed us to point out numerous geological features present in the region that are sometimes partially or entirely concealed by sedimentary cover. In the past, advanced edge-detection methods applied to potential field data were quite effective [17-22]. These techniques have enabled us to identify a number of lineaments throughout the study area. In general, shorter-wavelength lineaments are associated with shallower depths, whereas longer-wavelength lineaments are associated with the deep interior of the Earth. Figures 5, 6, and 7 show that AS, THG, and TDX filters correspond to the short-wave lineaments in this study. The TAHG and FSEG filters are strongly correlated with the longer wavelength lineaments (Figures 8 and 9). In addition, they were more effective than the AS, THG, and TDX methods at enhancing the gravity lineaments. The FSEG produces more distinct lineaments and reveals the presence of numerous dense lineaments covered up by Cretaceous sediments. This filter improves and provides an image of the source edges with higher resolution. The obtained image maps from the application of the FSED filter allow us to highlight the source edges, and display the edges of the large and small amplitude anomalies clearly. The sharpness and performance in enhancing edges is better than the others. The lineaments extracted by the FSEG map are shown in Figure 10. This map depicts a number of significant lineaments, shows NW-SE and ENE-WSW trending gravity structures with many maximum values indicating the boundaries of basaltic formations and presents a good correlation with the faults in the study area.
Figure 11. Rose diagram of the lineaments
Comparing the geological map (Figure 1) and the structural lineament map (Figure 10) of the GSB showed that structural lineaments are most common in the Pre-Cambrian basement rocks (migmatite, gneiss, and older granite). The various detected lineaments can be interpreted as tectonic forces inserting intrusive rocks (gneiss and granite) into sedimentary rocks or Precambrian formations. These lineaments support the hypothesis that, during the Cretaceous, the Benue Trough and the GSB were connected via lineaments [27]. They serve as a guide for the selection of exploration sites for underground water layers and mineral resources, as well as for the assessment of environmental hazards. In addition to the lineaments, we observe a circular-shaped lineament anomaly, which may be an intrusion of heavy rock likely granite gneissic into the fault-bounded Cretaceous sediments of the Garoua series. Figure 11 depicts a rose diagram of the lineaments shown in Figure 10. Based on the sedimentary basin of Benue, the analysis of this diagram reveals that there are two major NW-SE and ENE-WSW lineament trends, respectively. The lineaments of subsurface structures in the GSB must be investigated further to determine whether or not they are faults, despite the fact that the FSEG filter is a good and highly regarded filter. However, for future investigation, we will apply an upward continuation filter of 1 kilometer to the data in order to reduce the noise effect prior to applying the methods.
In this study, we applied filters such as AS, THG, TAHG, TDX, and FSEG to highlight the geological source edges in the gravity data. The key results of this study reveal significant lineaments in a variety of directions. Geological structures indicate that tectonic activity is still occurring in this region. At the edges of the deep gravity structures, the AS and THG filters showed poor performance. Although the TDX and TAHG filters yield pseudo-boundaries in their results, the gravity sources identified by these filters are either larger or smaller than the real sources. In contrast to other boundary detectors, the FSEG method provides greater precision and a more distinct response for the boundaries in the GSB. The FSEG filter provided the best resolution and delineated the edges more clearly compared with the other utilized edge detection methods. The obtained results from the application of this filter to the gravity data of GSB showed the lineaments with predominant NW-SE and ENE-WSW directions. In addition, the results of this study revealed the presence of structural unit faults in particular that had not been identified in previous geological and geophysical studies of the GSB. These faults increase the possibility of hydrocarbon accumulation and thermomineral sources in the area. The results also indicate the presence of numerous trends corresponding to the principal tectonic directions of the region. However, for future research we will reduce the noise effect to the data before applying the filters.
We would like to thank the National Geospatial-Intelligence Agency (NGIA) of the USA for making the dataset used in this study available. We also appreciate the helpful suggestions and comments made by the anonymous reviewers.
[1] Stephen, E.E., Anthony, E.A., Ebong, D.E. (2019). Enhancement and modelling of aeromagnetic data of some inland basins, southeastern Nigeria. Journal of African Earth Sciences, 155: 43-53. https://doi.org/10.1016/j.jafrearsci.2019.02.030
[2] Omietimi, E.J., Chouhan, A.K., Lenhardt, N., Yang, R., Bumby, A.J. (2021). Structural interpretation of the south-western flank of the Anambra Basin (Nigeria) using satellite-derived WGM 2012 gravity data. Journal of African Earth Sciences, 182: 104290. https://doi.org/10.1016/j.jafrearsci.2021.104290
[3] Ngene, T., Mukhopadhyay, M., Ampana, S. (2022). Reconnaissance investigation of geothermal resources in parts of the Middle Benue Trough, Nigeria using remote sensing and geophysical methods. Energy Geosciences, 3(4): 360-371. https://doi.org/10.1016/j.engeos.2022.06.002
[4] Osinowo, O.O., Akanji, A.O., Sanuade, O.A., Esho, O.O. (2023). Hydrocarbon potential evaluation of Middle Benue Basin, East Central Nigeria using high resolution aeromagnetic data. Results in Geophysical Sciences, 14: 100058. https://doi.org/10.1016/j.ringps.2023.100058
[5] Lar, U.A., Bata, T., Dibal, H., Yusuf, S.N., Lekmang, I., Goyit, M., Yenne, E. (2023). Potential petroleum prospects in the middle Benue trough, central Nigeria: Inferences from integrated applications of geological, geophysical and geochemical studies. Scientific African, 19: e01436. https://doi.org/10.1016/j.sciaf.2022.e01436
[6] Wright, J.B. (1968). South Atlantic continental drift and the Benue Trough. Tectonophysics, 6(4): 301-310. https://doi.org/10.1016/0040-1951(68)90046-2
[7] Olade, M.A. (1975). Evolution of Nigeria’s Benue Trough (Aulacogen): A tectonic model. Geological Magazine, 112(6): 575-583. https://doi.org/10.1017/S001675680003898X
[8] Offodile, M.E., Reyment, R.A. (1976). Stratigraphy of the Keana–Awe area of the Middle Benue region of Nigeria. Bulletin géologique de l’Institut Universitaire Upsala, 7: 37-66.
[9] Adighije, C. (1979). Gravity field of Benue Trough, Nigeria. Nature, 282: 199-201. https://doi.org/10.1038/282199a0
[10] Benkhelil, J., Guiraud, R. (1980). La Bénoué (Nigéria): Une chaîne intracontinentale de style atlasique. Compte rendu de l’Academie des Sciences de Paris, 290: 1517.
[11] Ofoegbu, C.O. (1984). A model for the tectonic evolution of the Benue Trough of Nigeria. International Journal of Earth Sciences, 73: 1007-1018. https://doi.org/10.1007/BF01820885
[12] Ofoegbu, C.O., Mohan, N.L. (1990). Interpretation of aeromagnetic anomalies over part of Southeastern Nigeria using three-dimensional Hilbert transformation. Pure and Applied Geophysics, 134: 13-29. https://doi.org/10.1007/BF00878077
[13] Cratchley, C.R., Jones, G.P. (1965). An Interpretation of the Geology and Gravity Anomalies of the Benue Valley, Nigeria, London: H.M.S.O., UK. https://discovered.ed.ac.uk/permalink/44UOE_INST/7g3mt6/alma991482823502466.
[14] Stoneley, R. (1966). The Niger delta region in the light of the theory of continental drift. Geological Magazine, 103(5): 385-397. https://doi.org/10.1017/S0016756800053978
[15] Burke, K., Dessauvagie, T., Whiteman, A. (1970). Geological History of the Benue Valley and Adjacent Areas. In: Dessauvagie, T.F.J., Whiteman, A.J. (eds) African Geology. Ibadan University Press, Ibadan, pp. 187-205.
[16] Kamguia, J., Manguelle-Dicoum, E., Tabod, C.T., Tadjou, J.M. (2005). Geological models deduced from gravity data in the Garoua basin, Cameroon. Journal of Geophysics and Engineering, 2(2): 147-152. https://doi.org/10.1088/1742-2132/2/2/009
[17] Dung, N.K., Thanh, D.D. (2016). Using the analytic signal method of gravity gradient tensor (GGT) to determine the location and depth of the faults in the Pre-Cenozoic basement rocks of the Red River trough. Vietnam Journal Earth Science, 38(2): 143-152. https://doi.org/10.15625/0866-7187/38/2/8597
[18] Pal, S.K., Narayan, S., Majumdar, T.J., Kumar, U. (2016). Structural mapping over the 85°E Ridge and surroundings using EIGEN6C4 high-resolution global combined gravity field model: An integrated approach. Marine Geophysical Research, 37: 159-184. https://doi.org/10.1007/s11001-016-9274-3
[19] Narayan, S., Sahoo, S.D., Pal, S.K., Kumar, U., Pathak, V.K., Majumdar, T.J., Chouhan, A. (2017). Delineation of structural features over a part of the Bay of Bengal using total and balanced horizontal derivative techniques. Geocarto International, 32(4): 351-366. https://doi.org/10.1080/10106049.2016.1140823
[20] Oliveira, S.P., Ferreira, F.J.F., Souza, J.D. (2017). EdgeDetectPFI: An algorithm for automatic edge detection in potential field anomaly images – application to dike-like magnetic structures. Computer & Geosciences, 103: 80-91. https://doi.org/10.1016/j.cageo.2017.02.006
[21] Kumar, U., Pal, S.K., Sahoo, S.D., Narayan, S., Saurabh, Mondal, S., Ganguli, S.S. (2018). Lineament mapping over Sir Creek offshore and its surroundings using high resolution EGM2008 gravity data: An integrated derivative approach. Journal of the Geological Society of India, 91: 671-678. https://doi.org/10.1007/s12594-018-0922-x
[22] Eldosouky, A.M., Pham, L.T., El-Qassas, R.A., Hamimi, Z., Oksum, E. (2021). Lithospheric structure of the Arabian–Nubian shield using satellite potential field data. In: Hamimi, Z., Fowler, A.R., Liégeois, J.P., Collins, A., Abdelsalam, M.G., Abd EI-Wahed, M. (eds) The Geology of the Arabian-Nubian Shield. Regional Geology Reviews. Springer, Cham, pp. 139-151. https://doi.org/10.1007/978-3-030-72995-0_6
[23] Raouf, A., Yue, J., Njeudjang, K., Soh Tamehe, L., Onibudo, O.O. (2023). Remote sensing and geophysical methods for delineating groundwater resources in schists hard rocks of the Adamawa Yadé Domain, Cameroon. The Egyptian Journal of Remote Sensing and Space Science, 26(1): 217-230. https://doi.org/10.1016/j.ejrs.2023.02.006
[24] Maluski, H., Coulon, C., Popoff, M., Baudin, P. (1995). AR/39 chronology, petrology and geodynamic setting of Mesozoic to early Cenozoic magmatism from the Benue Trough, Nigeria. Journal of the Geological Society, 152: 311-326.
[25] Guiraud, R., Maurin, J. (1992). Early Cretaceous rifts of western and central Africa: An overview. Tectonophysics, 213(1-2): 153-168. https://doi.org/10.1016/0040-1951(92)90256-6
[26] Duperon, L.M. (1991). Les flores ligneuses mésozoïques et cénozoïques d’Afrique nord équatoriale (Tchad et Cameroun). Ph.D. dissertation. Université Pierre et Marie Curie, Paris.
[27] Maurin, J.C., Guiraud, R. (1989). Relations entre tectonique et sédimentation dans les bassins barrémo-aptiens du Nord Cameroun. Comptes rendus de l'Académie des sciences. Série 2, Mécanique, Physique, Chimie, Sciences de l'univers, Sciences de la Terre, 308(8): 787-792.
[28] Maurin, J.C., Guiraud, R. (1990). Relationships between tectonics and sedimentation in the Barremo-Aptian intracontinental basins of Northern Cameroon. Journal of African Earth Sciences (and the Middle East). 10(1-2): 331-340. https://doi.org/10.1016/0899-5362(90)90064-L
[29] Dessauvagie, T.F.J. (1975). Explanatory note to the geological map of Nigeria. Scale 1: 1,000,000. Journal of Mining and Geology. 9(1-2): 1-28.
[30] Allix, P., Popoff, M. (1983). Le Crétacé inférieur de la partie nord-orientale du fossé de la Bénoué (Nigéria): Un exemple de relation étroite entre tectonique et sédimentation. Bulletin des centres de recherches exploration-Production Elf-Aquitaine, 7(1): 349-359.
[31] Brunet, M., Coppens, Y., Dejax, J., Flynn, L., Heintz, E., Hell, J., Jacobs, L., Jehenne, Y., Mouchelin, G., Pilbeam, D., Sudre J. (1990). Nouveaux mammifères du Crétacé inférieur du Cameroun, Afrique de l’Ouest. Compte Rendu de l’Academie des Sciences de Paris, 310: 1139-1146.
[32] Bessong, M. (2012). Paléoenvironnements et diagenèse dans un réservoir gréseux d’âge crétacé du fossé de la Bénoué au Nord Cameroun: les grès de Garoua. Ph.D. dissertation. Université de Poitiers, France.
[33] Ngounouno, I., Nkoumbou, C., Loulé, J. (1997). Relationships between tectono-sedimentary evolution and magmatism of the Garoua rift (Northern Cameroon). African Geosciences Review, 4(3-4): 451-460.
[34] Pal, S.K., Vaish, J., Kumar, S., Priyam, P., Bharti, A.K., Kumar, R. (2017). Downward continuation and tilt derivative of magnetic data for delineation of concealed coal fire in East Basuria Colliery, Jharia coal field, India. Journal of Earth System Science, 126: 1-17. https://doi.org/10.1007/s12040-017-0826-y
[35] Pham, L.T., Do, T.D., Öksüm, E. (2018). A new method for edge detection in interpretation of potential field data. Mühendislik Bilimleri Ve Tasarım Dergisi, 6(4): 637-642. https://doi.org/10.21923/jesd.441090
[36] Pham, L.T., Eldosouky, A.M., Oksum, E., Saada, S.A. (2022). A new high resolution filter for source edge detection of potential field data. Geocarto International, 37(11): 3051-3068. https://doi.org/10.1080/10106049.2020.1849414
[37] Pham, L.T., Nguyen, D.A., Eldosouky, A.M., Abdelrahman, K., Van-Vu, T., Al-Otaibi, N., Ibrahim, E., Kharbis, S. (2021). Subsurface structural mapping from high-resolution gravity data using advanced processing methods. Journal of King Saud University-Sciences, 33(5): 101488. https://doi.org/10.1016/j.jksus.2021.101488
[38] Ghomsi, F.E.K., Pham, L.T., Tenzer, R., Esteban, F.D., Van Vu, T., Kamguia, J. (2022). Mapping of fracture zones and structural lineaments of the Gulf of Guinea passive margins using marine gravity data from CryoSat-2 and Jason-1 satellites. Geocarto International, 37(25): 10819-10842. https://doi.org/10.1080/10106049.2022.2040602
[39] Liang, W., Xu, X.Y., Li, J.C., Zhu, G.B. (2018). The determination of an ultra-high gravity field model SGG-UGM-1 by combining EGM2008 gravity anomaly and GOCE observation data. Acta Geodaetica et Cartographica Sinica, 47(4): 425-434. https://doi.org/10.11947/j.AGCS.2018.20170269
[40] Liang, W., Li, J., Xu, X., Zhang, S., Zhao, Y. (2020). A high-resolution Earth’s gravity field model SGG-UGM-2 from GOCE, GRACE, satellite altimetry, and EGM2008. Engineering, 6(8): 860-878. https://doi.org/10.1016/j.eng.2020.05.008
[41] Wessel, P., Lui, J.F., Uieda, L., Scharroo, R., Wobbe, F., Smith, W.H.F., Tian, D. (2019). The generic mapping tools version 6. Geochemical, Geophysical, Geosystem, 20(11): 5556-5564. https://doi.org/10.1029/2019GC008515
[42] Roest, W.R., Verhoef, J., Pilkington, M. (1992). Magnetic interpretation using the 3-D analytic signal. Geophysics, 57(1): 116-125. https://doi.org/10.1190/1.1443174
[43] Cordell, L., Grauch, V.J.S. (1985). Mapping basement magnetization zones from aeromagnetic data in the San Juan basin, New Mexico. In: Hinze, W.J., Kane, M.F., O'Hara, N.W., Reford, M.S., Tanner, J., Weber, C. (eds) The Utility of Regional Gravity and Magnetic Anomaly Maps. Society of Exploration Geophysicists, Houston, Texas, pp. 181-197. https://doi.org/10.1190/1.0931830346.ch16
[44] Cooper, G.R.J., Cowan, D.R. (2011). A generalized derivative operator for potential field data. Geophysical Prospecting, 59(1): 188-194. https://doi.org/10.1111/j.1365-2478.2010.00901.x
[45] Ferreira, F.J.F., Souza, J., Bongiolo, A., Castro, L.G. (2013). Enhancement of the total horizontal gradient of magnetic anomalies using the tilt angle. Geophysics, 78(3): J33-J41. https://doi.org/10.1190/geo2011-0441.1
[46] Oksum, E., Le, D.V., Vu, M.D., Nguyen, T.H.T., Pham, L.T. (2021). A novel approach based on the fast sigmoid function for interpretation of potential field data. Bulletin of Geophysics and Oceanography, 62(3): 543-556. https://doi.org/10.4430/bgta0348
[47] Mouzong, M.P., Kamguia, J., Nguiya, S., Shandini, Y., Manguelle-Dicoum, E. (2014). Geometrical and structural characterization of Garoua sedimentary basin, Benue Trough, North Cameroon, using gravity data. Journal of Biology and Earth Sciences, 4(1): E25-E33.