Mustafa Emre Yetkin*![]() | Muharrem Kemal Özfırat
| Muharrem Kemal Özfırat![]() | Hayati Yenice
| Hayati Yenice![]() | Turgay Onargan
| Turgay Onargan![]()
© 2024 The authors. This article is published by IIETA and is licensed under the CC BY 4.0 license (http://creativecommons.org/licenses/by/4.0/).
OPEN ACCESS
In underground mining, stresses within the rock mass are initially in a state of equilibrium. Excavation disrupts this balance, necessitating the establishment of a new stress equilibrium. The reinforcement of mine galleries is contingent upon an understanding of the geomechanical properties of the rock mass. Furthermore, the dimensions of these galleries significantly influence the distribution of stresses around them. This study investigates the normal and horizontal stresses surrounding galleries of varying dimensions, excavated under identical rock mass conditions. The findings facilitate the recommendation of optimal gallery sizes that minimize stress concentrations. Consequently, these recommendations are instrumental in enabling the selection of gallery sizes that enhance mining safety and ensure sustainable production.
finite element method, stress distribution, underground galleries, mining
The design and execution of mine galleries are pivotal to mining operations, underpinning critical functions such as occupational safety, ventilation, water management, and the movement of personnel and materials. Appropriately dimensioned galleries are imperative for a productive and secure work environment. The determination of these dimensions is influenced by a myriad of factors, including underground stress conditions, the transportation demands for heavy machinery, and the operational requirements for personnel and equipment. Informed selection of gallery dimensions, guided by these parameters, is essential for optimizing occupational safety and operational efficiency.
Historically, research efforts have been directed toward modeling stresses and failure potentials associated with circular cross-section tunnels within rock masses. The response of these underground structures to static loads has been extensively examined through numerical simulations [1-6].
In the present study, gallery models measuring 4×4 meters and 5×5 meters were developed within an identical geological setting. The selection process for the gallery dimensions was informed by the strength characteristics of the local rock mass and the prevalent dimensions within existing mining operations. Consequently, dimensions of 4×4 and 5×5 meters were identified as optimal for further investigation. The stress profiles, both vertical and horizontal, associated with these gallery dimensions were scrutinized. Initially, a representative model of the field was constructed, enabling the estimation of stress distributions. Subsequently, the computed stress values were imposed upon the gallery models to determine the stress patterns that would manifest around these structures. Based on the stress distributions obtained, recommendations pertaining to the most advantageous gallery dimensions were formulated.
The data of the rock material considered in the created field model are provided in Table 1. The underground quarry under investigation in this study is located 70 km east of İzmir and 15 km northwest of Bayındır.
Table 1. Data related to rock material [7]
|
Rock Material |
Deadrock |
|
|
Uniaxial Compressive Strength |
UCS (MPa) |
35.67 |
|
Geological Strength Index |
GSI |
60 |
|
Rock Mass Constant |
mi |
20 |
|
Density |
ɣ (t/m3) |
2.7 |
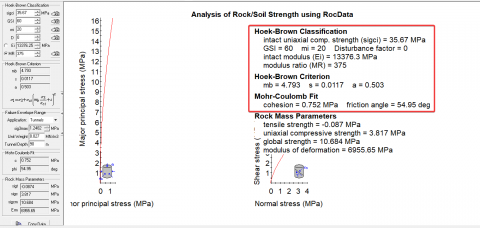
During the creation of the field model, a depth of 90 meters from the surface was considered for excavating the galleries. In the subsequent stage, using the rock material properties provided in Table 1 and considering the depth, the parameters related to the rock mass were calculated using RocData software [8]. The process of obtaining the rock mass data is illustrated in Figure 1.
Figure 1. Obtaining rock mass data
The data related to the rock mass calculated using the RocData software are provided in Table 2.
Table 2. Rock mass data used in the model
|
Rock Mass |
Deadrock |
|
|
Elastic Modulus |
EM (MPa) |
6955.650 |
|
Cohesion |
C (MPa) |
0.752 |
|
Tensile Strength |
σt (MPa) |
0.087 |
|
Internal Friction Angle |
ο (Derece) |
54.950 |
|
Density |
ɣ (t/m3) |
2.700 |
|
Poisson's Ratio |
ν |
0.300 |
The horizontal and vertical stress values that will occur at a working depth of 90 meters under the selected rock mass conditions, considering the Poisson's ratio of the dominant rock structure in the field, have been calculated using the following equations [9]:
$\sigma \mathrm{h}=\mathrm{k} . \sigma \mathrm{v}$ (1)
$\mathrm{k}=0,25+7 . \mathrm{E} .(0,001+1 / \mathrm{z})$ (2)
Here is a brief explanation of the variables: σv: Vertical stress in megapascals (MPa); σh: Horizontal stress in megapascals (MPa); k: Ratio of horizontal stress to vertical stress (no units); E: Average modulus of elasticity of the rock mass in the vertical direction up to the working depth in gigapascals (GPa); z: Working depth in meters (m).
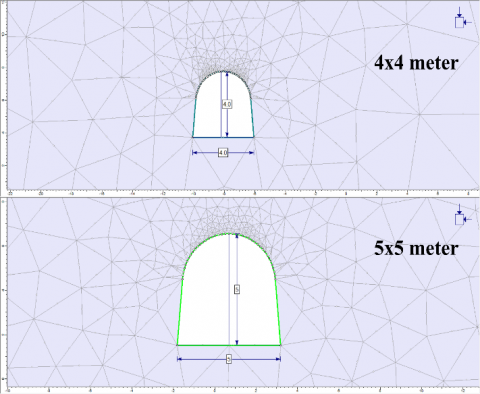
The vertical stress at a working depth of 90 m was calculated as 2.33 MPa using Eq. (1). Considering the rock mass properties given in Table 2 and the calculated coefficient k as 0.84 based on the rock mass ’s modulus of elasticity and depth (Eq. (2)), the expected horizontal stress in the field was calculated as 1.96 MPa. The calculated coefficient k was incorporated into the field model, ensuring an accurate representation of stress conditions within the rock mass environment where the galleries will be excavated. Field models with dimensions of 4×4 meters and 5×5 meters were created using Phase2D software [10]. A visual representation of the models is provided in Figure 2.
Figure 2. Different gallery size models
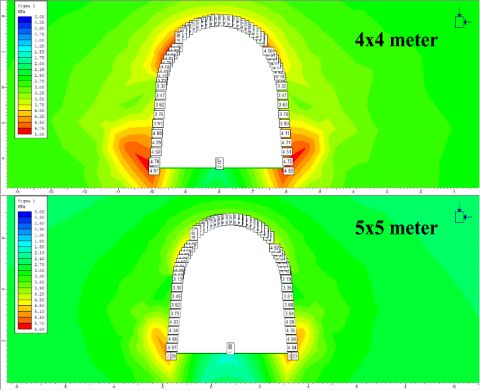
After entering the data the models, the models were run, and normal and horizontal stresses around the galleries were calculated for different gallery sizes. The stresses around the galleries with gallery sizes of 4×4 and 5×5 meters in the same rock mass environment are shown in Figure 3.
Figure 3. Normal stresses occurring around galleries of different sizes
The calculated stress values are detailed in Table 3. Normal stresses occurring immediately above the gallery were measured along an approximately 14-meter line. The horizontal stress values on the right and left walls were recorded by measurements along an approximately 4-meter line. The measurements were conducted using measurement lines placed on models established within the software. These measurement lines are structures permitted to be generated by the software, allowing the user to obtain results of their desired intervals and types in the regions they pass through. The measurements were taken just above the gallery and on the side walls.
Table 3. Normal and horizontal stresses occurring around galleries of different sizes
|
Gallery Size |
||||||
|
4×4 meter |
5×5 meter |
4×4 meter |
5×5 meter |
|||
|
Top of Gallery |
Horizontal Stresses (MPa) |
|||||
|
Normal Stresses (MPa) |
Left Wall |
Right Wall |
Left Wall |
Right Wall |
||
|
3.321 |
3.194 |
-0.325 |
-0.360 |
-0.183 |
-0.221 |
|
|
3.764 |
4.103 |
-0.201 |
-0.227 |
-0.102 |
-0.130 |
|
|
4.140 |
4.425 |
-0.077 |
-0.095 |
-0.021 |
-0.038 |
|
|
4.425 |
4.607 |
0.047 |
0.037 |
0.061 |
0.053 |
|
|
4.570 |
4.687 |
0.172 |
0.170 |
0.142 |
0.145 |
|
|
4.771 |
4.842 |
0.397 |
0.399 |
0.362 |
0.368 |
|
|
4.814 |
4.927 |
0.724 |
0.726 |
0.720 |
0.723 |
|
|
4.910 |
4.917 |
1.052 |
1.052 |
1.078 |
1.078 |
|
|
4.902 |
4.919 |
1.379 |
1.378 |
1.436 |
1.433 |
|
|
4.878 |
4.893 |
1.706 |
1.705 |
1.794 |
1.788 |
|
|
4.807 |
4.819 |
Mean |
||||
|
4.755 |
4.770 |
0.487 |
0.479 |
0.529 |
0.520 |
|
|
4.679 |
4.698 |
|||||
|
4.629 |
4.638 |
|||||
|
4.578 |
4.580 |
|||||
|
4.510 |
4.521 |
|||||
|
4.452 |
4.469 |
|||||
|
4.417 |
4.429 |
|||||
|
4.384 |
4.396 |
|||||
|
4.370 |
4.378 |
|||||
|
4.361 |
4.371 |
|||||
|
4.370 |
4.376 |
|||||
|
4.385 |
4.397 |
|||||
|
4.418 |
4.428 |
|||||
|
4.456 |
4.468 |
|||||
|
4.510 |
4.519 |
|||||
|
4.574 |
4.578 |
|||||
|
4.626 |
4.634 |
|||||
|
4.677 |
4.685 |
|||||
|
4.754 |
4.765 |
|||||
|
4.804 |
4.815 |
|||||
|
4.867 |
4.872 |
|||||
|
4.881 |
4.911 |
|||||
|
4.906 |
4.898 |
|||||
|
4.807 |
4.929 |
|||||
|
4.778 |
4.823 |
|||||
|
4.581 |
4.689 |
|||||
|
4.416 |
4.649 |
|||||
|
4.124 |
4.478 |
|||||
|
3.732 |
4.133 |
|||||
|
3.325 |
3.134 |
|||||
|
Mean |
||||||
|
4.498 |
4.555 |
|||||
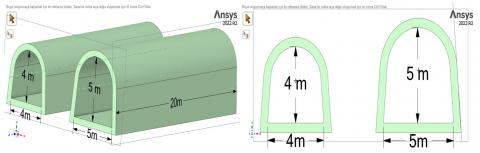
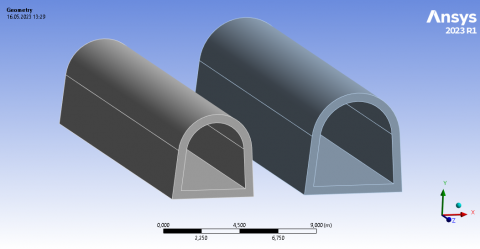
In the context of modeling studies, two galleries have been designed with dimensions of 4×4 meters and 5×5 meters, both with a length of 20 meters. The gallery designs were created using the SpaceClaim [11] solid modeling software. A visual representation of the created models is provided in Figure 4. The purpose of creating three-dimensional models is to examine the normal stresses occurring in the third dimension along the z-axis around the galleries in more detail, as the models created in Phase2D software are two-dimensional.
Figure 4. The created gallery models
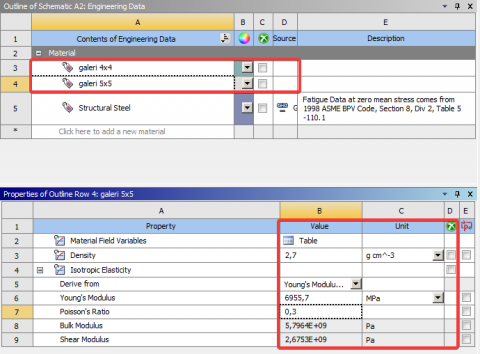
After the creation stage of the gallery models, the models were transferred to the ANSYS [12] stress analysis program. The values provided in Table 2 were used as input parameters for the models in the ANSYS stress analysis program, thus ensuring that the model behaves like a real rock environment. The process of entering rock mass (Elastic Modulus, Density and Poisson's Ratio) data into the models is shown in Figure 5.
Figure 5. Entering input parameters into the gallery models
An image of the gallery models created in the ANSYS stress analysis program is provided in Figure 6.
Figure 6. Gallery models in the 3rd dimension
The average normal stress values applied to the gallery models obtained from the Phase2D program and occurring on the gallery are as follows:
For the 4×4 meter gallery:
Average normal stress on the gallery: 4.498 MPa, Average horizontal stress on the right wall of the gallery: 0.479 MPa, Average horizontal stress on the left wall of the gallery: 0.487 Mpa.
For the 5×5 meter gallery:
Average normal stress on the gallery: 4.555 MPa, Average horizontal stress on the right wall of the gallery: 0.520 MPa, Average horizontal stress on the left wall of the gallery: 0.529 MPa.
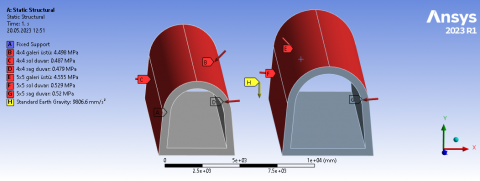
These calculated stress values were applied regionally to the gallery models using the ANSYS stress analysis program. Before proceeding with stress analysis, the models were fixed to the ground and the effect of gravity was applied to the models. This was done to ensure that the models operate as accurately as possible. A visual representation of the models after applying the loads is provided in Figure 7.
Figure 7. Application of normal (vertical) and horizontal (horizontal) stresses to gallery models
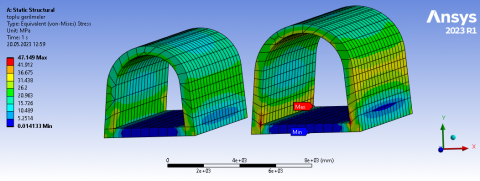
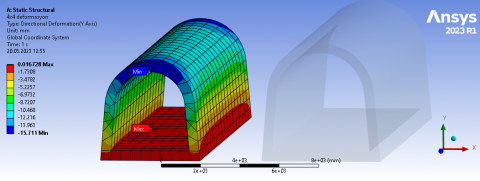
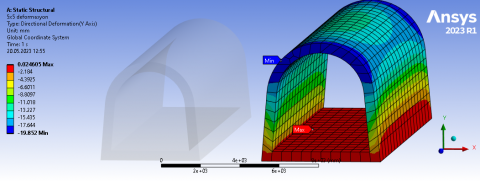
After completing these steps, the stress analysis process for the models was executed. An image showing the stress distribution around galleries of different sizes is provided in Figure 8. For the 4×4 meter gallery, the maximum vertical deformation was calculated to be 15.71 mm, whereas for the 5×5 meter gallery, it was calculated to be 19.85 mm. The distribution of deformations around the gallery is shown in Figure 9 and Figure 10. It is observed that the maximum deformation occurs in the central regions located just above the gallery in both cases.
Figure 8. Stress distribution
Figure 9. Vertical deformations occurring in the 4×4 meter gallery size
Figure 10. Vertical deformations occurring in the 5×5 meter gallery size
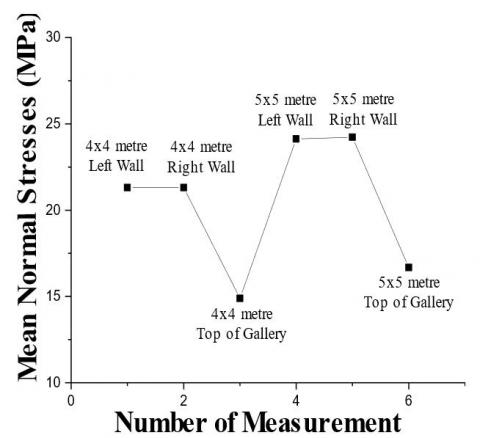
In the ANSYS stress analysis, the combined and graphical representations of the normal stresses occurring around galleries of different sizes are provided in Table 4 and Figure 11.
Table 4. Normal stresses occurring around galleries of different sizes
|
Gallery Size |
||||||
|
4×4 meter |
5×5 meter |
|||||
|
Left Wall |
Right Wall |
Top of Gallery |
Left Wall |
Right Wall |
Top of Gallery |
|
|
Normal Stresses (MPa) |
||||||
|
24.973 |
24.991 |
16.322 |
27.986 |
28.089 |
17.075 |
|
|
24.869 |
24.890 |
16.444 |
28.178 |
28.276 |
17.543 |
|
|
24.861 |
24.885 |
16.567 |
28.450 |
28.545 |
18.013 |
|
|
24.571 |
24.597 |
16.438 |
28.315 |
28.408 |
17.949 |
|
|
23.571 |
23.596 |
16.310 |
27.256 |
27.349 |
17.887 |
|
|
22.597 |
22.622 |
16.047 |
26.229 |
26.323 |
17.711 |
|
|
21.951 |
21.973 |
15.785 |
25.462 |
25.557 |
17.535 |
|
|
21.467 |
21.485 |
15.449 |
24.821 |
24.918 |
17.298 |
|
|
20.991 |
21.005 |
15.113 |
24.192 |
24.289 |
17.061 |
|
|
20.780 |
20.789 |
14.778 |
23.838 |
23.936 |
16.789 |
|
|
20.573 |
20.578 |
14.445 |
23.491 |
23.589 |
16.517 |
|
|
20.403 |
20.404 |
14.165 |
23.194 |
23.292 |
16.255 |
|
|
20.299 |
20.296 |
13.887 |
22.990 |
23.089 |
15.994 |
|
|
20.199 |
20.193 |
13.687 |
22.792 |
22.890 |
15.783 |
|
|
20.131 |
20.121 |
13.488 |
22.643 |
22.742 |
15.572 |
|
|
20.080 |
20.068 |
13.371 |
22.522 |
22.621 |
15.437 |
|
|
20.033 |
20.018 |
13.254 |
22.405 |
22.504 |
15.302 |
|
|
20.003 |
19.987 |
13.216 |
22.331 |
22.430 |
15.255 |
|
|
19.977 |
19.960 |
13.178 |
22.261 |
22.359 |
15.209 |
|
|
19.956 |
19.937 |
13.216 |
22.202 |
22.300 |
15.255 |
|
|
19.941 |
19.921 |
13.254 |
22.162 |
22.260 |
15.302 |
|
|
19.929 |
19.909 |
13.371 |
22.126 |
22.224 |
15.437 |
|
|
19.921 |
19.900 |
13.488 |
22.104 |
22.203 |
15.572 |
|
|
19.916 |
19.895 |
13.687 |
22.092 |
22.190 |
15.783 |
|
|
19.915 |
19.894 |
13.887 |
22.083 |
22.181 |
15.994 |
|
|
19.916 |
19.895 |
14.165 |
22.092 |
22.190 |
16.255 |
|
|
19.921 |
19.900 |
14.445 |
22.104 |
22.203 |
16.517 |
|
|
19.929 |
19.909 |
14.778 |
22.126 |
22.224 |
16.789 |
|
|
19.941 |
19.921 |
15.113 |
22.162 |
22.260 |
17.061 |
|
|
19.956 |
19.937 |
15.449 |
22.202 |
22.300 |
17.298 |
|
|
19.977 |
19.960 |
15.785 |
22.261 |
22.359 |
17.535 |
|
|
20.003 |
19.987 |
16.047 |
22.331 |
22.430 |
17.711 |
|
|
20.033 |
20.018 |
16.310 |
22.405 |
22.504 |
17.887 |
|
|
20.080 |
20.068 |
16.438 |
22.522 |
22.621 |
17.949 |
|
|
20.131 |
20.121 |
16.567 |
22.643 |
22.742 |
18.013 |
|
|
20.199 |
20.193 |
16.444 |
22.792 |
22.890 |
17.543 |
|
|
20.299 |
20.296 |
16.322 |
22.990 |
23.089 |
17.075 |
|
|
20.403 |
20.404 |
23.194 |
23.292 |
|||
|
20.573 |
20.578 |
23.491 |
23.589 |
|||
|
20.780 |
20.789 |
23.838 |
23.936 |
|||
|
20.991 |
21.005 |
24.192 |
24.289 |
|||
|
21.467 |
21.485 |
24.821 |
24.918 |
|||
|
21.951 |
21.973 |
25.462 |
25.557 |
|||
|
22.597 |
22.622 |
26.229 |
26.323 |
|||
|
23.571 |
23.596 |
27.256 |
27.349 |
|||
|
24.571 |
24.597 |
28.315 |
28.408 |
|||
|
24.861 |
24.885 |
28.450 |
28.545 |
|||
|
24.869 |
24.890 |
28.178 |
28.276 |
|||
|
24.973 |
24.991 |
27.986 |
28.089 |
|||
|
Mean |
||||||
|
21.304 |
21.305 |
14.884 |
24.126 |
24.223 |
16.680 |
|
Figure 11. The graphical representation of the stresses
In the scope of this study, vertical stresses expected to occur around galleries of different sizes were calculated through two different stress analyzes in the first stage, the vertical and horizontal stresses that would affect the galleries were calculated using the Phase2D program. In the second stage, the ANSYS stress analysis software was used to measure the vertical stress values around the gallery and the deformation and vertical stress values that would occur in the third dimension within the galleries. Because of the stress analyzes conducted in the first stage, it can be observed from the values given in Table 3 that the stresses increase linearly from the base region of the gallery toward the upper region of the gallery. They decrease slightly, stabilizing, and are influenced by the pressure arch formed on the gallery's upper portion. This situation has also been explained in detailed scientific studies on the subject [13-20]. It is noted that the vertical stresses occurring in the 4×4 meter and 5×5 meter gallery sizes are very close to each other, but the vertical stresses on the gallery's upper portion are particularly lower in the 4×4 meter gallery size.
Looking at the average horizontal stress values around the gallery given in Table 3 because of the first-stage stress analysis, it is observed that the stresses on the left and right walls of the 4×4 meter and 5×5 meter gallery sizes are very close to each other. The lowest average vertical stress value was observed in the upper region of the 4×4 meter gallery size.
Because of the two-stage stress analyzes it was determined that the horizontal stress values occurring in the left and right regions of the gallery are very close to each other. However, especially in the graphical representation shown in Figure 11, it is evident that the normal stresses occurring on the gallery and analyzed in the second and third dimensions are lower in the 4×4 meter gallery size. In addition, it allows for less deformation. Therefore, it has been determined that designing the gallery sizes to be opened in the working area as 4×4 meters would be suitable in terms of both work efficiency and health.
Predicting the behavior of the rock mass in which galleries will be excavated under load is crucial for gallery stability, work efficiency, and safety. Galleries that are excavated in the correct dimensions will result in a more balanced stress distribution, ensuring the stability of the gallery throughout the mining operation. In the scope of this study, galleries designed in sizes of 4×4 meters and 5×5 meters, which are planned to be excavated within the considered rock mass, were analyzed for the stresses occurring around them through three-dimensional analysis.
It is undeniable that three-dimensional models better reflect the mining conditions. According to the obtained results, it was observed that the stresses and vertical deformation values are lower in the 4×4 meter gallery size. Considering the geomechanical parameters of the rock mass and the results of stress analysis, no failure is expected in galleries to be excavated in these dimensions. However, through regular discontinuity control in the field, precautions can be taken to prevent ceiling collapses due to the formation of rock wedges during gallery excavation.
[1] He, B., Yin, G.Z. (2014). Stability analysis of tunnel during the excavation based on ANSYS. Applied Mechanics and Materials, 577: 1135-1138. https://doi.org/10.4028/www.scientific.net/AMM.577.1135
[2] Fakhimi, A., Carvalho, F., Ishida, T., Labuz, J.F. (2002). Simulation of failure around a circular opening in rock. International Journal of Rock Mechanics and Mining Sciences, 39(4): 507-515. https://doi.org/10.1016/S1365-1609(02)00041-2
[3] Hendron, A.J., Engeling, P.D., Paul, S.L., Aiyer, A.K. (1972). Geomechanical model study of the behavior of underground openings in rock subjected to static loads: Report 3: Tests on lined openings in jointed and intact rock. Technical Report N-69-1. Waterways Experiment Station, Vicksburg, Mississippi, US.
[4] Huang, F., Zhu, H., Xu, Q., Cai, Y., Zhuang, X. (2013). The effect of weak interlayer on the failure pattern of rock mass around tunnel-scaled model tests and numerical analysis. Tunnelling and Underground Space Technology, 35: 207-218. https://doi.org/10.1016/j.tust.2012.06.014
[5] Ren, F., Chang, Y., He, M. (2020). A systematic analysis method for rock failure mechanism under stress unloading conditions: A case of rock burst. Environmental Earth Sciences, 79: 1-16. https://doi.org/10.1007/s12665-020-09111-2
[6] Yetkin, M.E. (2022). Metalik Madenlerde Topuk Boyutlarındaki Değişimin Gerilme Dağılımına Etkisi. Afyon Kocatepe Üniversitesi Fen Ve Mühendislik Bilimleri Dergisi, 22(6): 1459-1468. https://doi.org/10.35414/akufemubid.1148884
[7] Mallı, T., Yetkin, M.E., Özfırat, M.K., Kahraman, B.A. Y.R.A.M. (2017). Numerical analysis of underground space and pillar design in metalliferous mine. Journal of African Earth Sciences, 134: 365-372. https://doi.org/10.1016/j.jafrearsci.2017.07.018
[8] RocData. (2014). Rock, Soil and Discontinuity Strength Analysis, Version 5.0. https://www.rocscience.com/software/rsdata#.
[9] Sheorey, P.R. (1994). A theory for in Situ stresses in isotropic and transverseley isotropic rock. International Journal of Rock Mechanics and Mining Sciences & Geomechanics Abstracts, 31(1): 23-34. https://doi.org/10.1016/0148-9062(94)92312-4
[10] Phase2, Version 8.020. (2014). Rocscience Inc, Toronto, Ontario, Canada. https://www.rocscience.com/software/rs2.
[11] SpaceClaim Corporation. (2014). SpaceClaim (2014.0.1.03201), SpaceClaim Corporation. https://www.ansys.com/products/3d-design/ansys-spaceclaim.
[12] Ansys Mechanical. (2018). ANSYS, Inc., Canonsburg PA, USA. https://www.ansys.com/products/structures/ansys-mechanical.
[13] Poulsen, B.A. (2010). Coal pillar load calculation by pressure arch theory and near field extraction ratio. International Journal of Rock Mechanics and Mining Sciences, 47(7): 1158-1165. https://doi.org/10.1016/j.ijrmms.2010.06.011
[14] Wang, S.L., Hao, S.P., Chen, Y., Bai, J.B., Wang, X. Y., Xu, Y. (2016). Numerical investigation of coal pillar failure under simultaneous static and dynamic loading. International Journal of Rock Mechanics and Mining Sciences, 84: 59-68. https://doi.org/10.1016/j.ijrmms.2016.01.017
[15] Basarir, H., Oge, I.F., Aydin, O. (2015). Prediction of the stresses around main and tail gates during top coal caving by 3D numerical analysis. International Journal of Rock Mechanics and Mining Sciences. 76: 88-97. https://doi.org/10.1016/j.ijrmms.2015.03.001
[16] Deng, G., Xie, H., Gao, M. (2023). Fracture mechanisms of competent overburden under high stress conditions: A case study. Rock Mechanics and Rock Engineering, 56: 1759-1777. https://doi.org/10.1007/s00603-022-03169-z
[17] Yetkin, M.E., Özfırat, M.K., Onargan, T. (2024). Examining the optimum panel pillar dimension in longwall mining considering stress distribution. Scientific Reports, 14(6928): 1-12. https://doi.org/10.1038/s41598-024-57579-w
[18] Kang, H., Wu, L., Gao, F. (2019). Field study on the load transfer mechanics associated with longwall coal retreat mining. International Journal of Rock Mechanics and Mining Sciences, 124: 104141. https://doi.org/10.1016/j.ijrmms.2019.104141
[19] Sinha, S., Walton, G. (2019). Investigation of longwall headgate stress distribution with an emphasis on pillar behavior. International Journal of Rock Mechanics and Mining Sciences, 121: 104049. https://doi.org/10.1016/j.ijrmms.2019.06.008
[20] Li, C.C. (2006). Rock support design based on the concept of pressure arch. International Journal of Rock Mechanics and Mining Sciences, 43(7): 1083-1090. https://doi.org/10.1016/j.ijrmms.2006.02.007