Sha Md. Shahan Shahriar*![]() | Meghla Munshi
| Meghla Munshi![]() | Hossain Mohammad Zakir
| Hossain Mohammad Zakir![]() | Md. Jahidul Islam
| Md. Jahidul Islam![]() | Md. Mahtab Ali Mollah
| Md. Mahtab Ali Mollah![]() | Sayed M.A. Salam
| Sayed M.A. Salam![]()
© 2023 IIETA. This article is published by IIETA and is licensed under the CC BY 4.0 license (http://creativecommons.org/licenses/by/4.0/).
OPEN ACCESS
Heavy metal in irrigation water can be absorbed by crops, resulting in their accumulation in edible plant portions. These metals can be ingested through foods produced with contaminated water, which can result in organ damage, concerns with child development, neurological illnesses, and even cancer. This study, therefore, focuses on the estimation of Pb, Cr, Mn, and Cd in irrigation water along with their pollution assessments. Pb, Cr, Mn, and Cd concentrations were found in the range of 0.0211-0.2104, 0.00105-0.00937, 0.0913-0.3701, and 0.0004-0.0222 mg/L, respectively. This study found that 80% of samples for Mn and 55% for Cd exceeded the permissible limit recommended by the Food and Agricultural Organization. Pollution assessments were carried out using the enrichment factor, geoaccumulation index, contamination factor, and modified degree of contamination. This study also revealed that the geoaccumulation index and contamination factor indicated higher levels of Mn and Cd contamination. The government and organizations should establish stringent heavy metals regulations, regular monitoring, public awareness, and robust wastewater management to prevent contamination. However, due to limited metals and samples, further studies with a large number of heavy metals and samples are essential to a more profound understanding of sources, distribution, health impacts, and effective mitigation strategies.
cadmium, chromium, heavy metals, irrigation water, lead, manganese, pollution assessment
Irrigation water may be defined as water that is used in agricultural land to produce crops and sustain livestock’s. Irrigation water sources in Bangladesh are contaminated with heavy metals due to both industrial discharges and agricultural runoff. Water samples collected from irrigation canals and sources near industrial areas and intensive agricultural regions may exhibit higher concentrations of heavy metals.
Bangladesh is a riverine country with rich natural resources, including several long-lived rivers besides reservoirs, tank estuaries and lakes, swamps, and paddy fields. The water from these sources is used for drinking, bathing, sanitation, generating electricity, and irrigation. Agriculture is the most crucial water-using sector. The water used in irrigation can easily affect crops and crop growth. Crop growth in soil irrigated with poor-quality water decreases due to increased osmotic stress and poor physical structure of highly dispersed sodic soils. The degree of harmful effect varies on the crop variety, stages of growth and development, as well as management practices of the crops.
Tchounwou et al. [1] defined heavy metals as metallic elements with a relatively high density compared to water. With the assumption that heaviness and toxicity are interrelated, heavy metals also include metalloids, such as arsenic, that can induce toxicity at a low level of exposure [2]. Wastewaters are contaminated with trace elements such as lead (Pb), copper (Cu), zinc (Zn), boron (B), cobalt (Co), chromium (Cr), arsenic (As), molybdenum (Mo), and manganese (Mn). Many are non-essential and become toxic to plants, animals, and humans if they exceed a certain concentration level [3]. Vegetables irrigated with heavy metal-contaminated water can lead to serious health hazards to the specific community and animals [4]. Heavy metals can enter a water supply through industrial and consumer wastes or even from acidic rain breaking down soils and releasing heavy metals into streams, lakes, rivers, and groundwater [5]. The harmful effects of heavy metals on humans depend on their dosage, rate of emission, and period of exposure. Because of their ubiquitous exposure, cadmium (Cd), lead (Pb), manganese (Mn), and mercury (Hg) have received much attention in recent days [6]. Lead can cause hypertension and affect blood vessels. Lead-blocked blood vessels lead to immediate heart attack and death. Increasing blood lead levels significantly correlated with increased cardiovascular morbidity and mortality [7]. Chronic and acute both types of lead poisoning can cause cardiac dysfunction and vascular damage [8]. Hexavalentchromium [Cr (VI)] is a toxic industrial pollutant that is classified as a human carcinogen by several regulatory and non-regulatory agencies [9]. Cr (VI)-containing compounds is known to cause multiorgan toxicity such as renal damage, allergy, asthma, and cancer of the respiratory tract in humans [10, 11]. Overexposure to Mn can cause adverse health risks, including Parkinson's disease, Huntington's disease, cardiovascular disease, hyperkeratosis, diabetes mellitus, pigmentation changes, Alzheimer's disease, kidney, liver, respiratory, and neurological disorders [12-14].
Exposure to Cd compounds may create serious health problems, including kidney damage [15], effect on reproductive biology [16], osteotoxicity [17], carcinogenesis [18], and cardiovascular abnormality [19]. In addition, Cd acute exposures may lead to inflammation followed by cough, dryness, nose and throat irritation, headache, dizziness, chest pain, pneumonitis, and pulmonary edema [20, 21].
Rajshahi is a major city in Bangladesh and is located on the north bank of the Padma River. There are also some industries located in Rajshahi City and around Rajshahi. Investigations are being carried out in different locations of Bangladesh by different researchers to determine the extent of heavy metals pollution in Midstream of the river, surface water, groundwater, coal mine area water, soil, and sediments [22-26]. Generally, the concentration of heavy metals in water is typically low, but due to human activity, the concentrations of these metals are increase over time. Water used for irrigation in Rajshahi mainly came from the Padma River, groundwater, and surface water. However, the possibility of heavy metal contamination in irrigation water is not negligible. Several previous studies indicated that irrigation water could be a pathway of heavy metal contamination [27-29]. Also, we predict that irrigation water nearby Rajshahi City may lead to metal contamination due to industrialization and different human activities. Some of the industries present in Rajshahi City that could potentially contribute to heavy metal pollution such as battery manufacturing and recycling, automobile repair and maintenance, tanneries and leather processing, metal processing and fabrication, ceramics and pottery, textile and garment manufacturing, pharmaceutical manufacturing, electronic waste recycling, paint and coating manufacturing, small-scale metal and craft industries. Agricultural chemicals, fertilizers, and pesticides used for crop production may also involve heavy metal-containing compounds that can leach into the soil and water. As heavy metals have carcinogenic and non-carcinogenic toxic effects on the human body, it is crucial to determine the pollution level of heavy metals in irrigation water. It is also essential to analyze how metal concentrations change in a study area with time. Based on the literature review, it is hypothesized that industrial activities such as textile and leather processing, metal fabrication, and pharmaceutical manufacturing, as well as inadequate waste management practices in industries like ceramics, battery manufacturing, and electronic waste recycling, result in heavy metal pollution in local water bodies in Rajshahi City. It is expected that irrigation water samples collected from areas proximate to these industries will show higher concentrations of heavy metals, such as Pb, Cr, Mn, and Cd.
No previous studies were found in the literature on the heavy metal levels in this study's selected area. Hence, the current research would represent the pollution level of selected heavy metals in irrigation water of studied areas, and it would aid in comparing the results over time and with other research. Hence, a systematic study is required in order to determine the pollution level around Rajshahi City areas.
Therefore, the main objective of this study was to determine the levels of four heavy metals (i.e., Pb, Cr, Mn, and Cd) in the irrigation water used in different places of Rajshahi City in Bangladesh. In addition, some of the factors, such as the enrichment factor, contamination factor, geological index, and modified degree of contamination, were also studied for complete pollution assessments. Through statistical analysis and data interpretation, it anticipates identifying hotspots of heavy metal contamination where concentrations exceed acceptable regulatory limits. This information can serve as a basis for policy recommendations and the prioritization of clean-up initiatives.
2.1 Date and location of the research
The samples were collected between April 2021 and May 2021 from the Rajshahi City Corporation areas of Bangladesh. Sample analysis was conducted in June 2021 at the Central Science Laboratory of the University of Rajshahi, Rajshahi, Bangladesh.
2.2 Study area
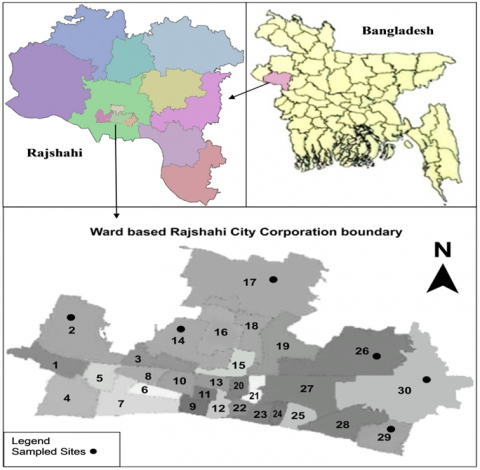
Rajshahi is a metropolitan city and a major urban, commercial and educational center in Bangladesh. It is also the administrative seat of the eponymous division and district, located on the north bank of the Padma River, near the Bangladesh-India border [30]. Rajshahi City Corporation area is 95.56 sq km, located between 24°20' and 24°24' north latitudes and between 88°32' and 88°40' east longitudes. It is bounded by Paba Upazila in all sides [31]. The irrigation water samples were collected from different locations in the Rajshahi City Corporation area of Bangladesh (Figure 1).
Figure 1. Location of the research area
2.3 Collection of water samples
Water samples were collected directly from the field from twenty (20) different sites of Rajshahi City Corporation areas (Figure 1). Three samples (n=3) were collected from each site for the determination of the standard deviation. A total of 60 samples were collected from 20 sites. The samples were collected randomly from wards 2, 14, 17, 26, 29, and 30 of the Rajshahi City Corporation, where cultivation is more. The sample identification number and sample collection locations are given in Table 1. Water samples (400ml) were collected from the field with a standard dipper in triplicate portions and put into a clean glass beaker without filtering. Samples were analyzed for pH immediately after collection by handheld pH meter (Hanna HI9811-51). The samples were acidified with concentrated hydrochloric acid (HCl) and concentrated nitric acid (HNO3) to a pH ranging between 1.5 and 2.0 for the determination of heavy metals [22, 32]. Each portion of the water sample was transferred into clean plastic bottles and labeled. All the samples were stored in ice-packed coolers. The samples were brought to the laboratory using a typical easy bike. The temperature of all the stored samples was maintained at 0-4°C until analysis. The samples were processed for analysis within 1 to 3 days after collection.
Table 1. Sample identification number and sample collection locations
|
Sample Identification Number |
Geographic Location |
Ward Number of Rajshahi City |
|
W1 (n=3) |
24°23'29.3"N 88°33'39.0"E |
2 |
|
W2 (n=3) |
24°23'16.1"N 88°33'34.3"E |
|
|
W3 (n=3) |
24°23'28.0"N 88°34'04.2"E |
|
|
W4 (n=3) |
24°22'34.5"N 88°35'00.9"E |
14 |
|
W5 (n=3) |
24°22'50.4"N 88°34'44.7"E |
|
|
W6 (n=3) |
24°22'37.9"N 88°34'48.1"E |
|
|
W7 (n=3) |
24°24'00.8"N 88°37'24.4"E |
17 |
|
W8 (n=3) |
24°24'03.2"N 88°37'45.0"E |
|
|
W9 (n=3) |
24°24'08.9"N 88°37'46.3"E |
|
|
W10 (n=3) |
24°24'11.3"N 88°37'42.6"E |
|
|
W11 (n=3) |
24°22'59.3"N 88°38'14.2"E |
26 |
|
W12 (n=3) |
24°23'02.6"N 88°38'09.1"E |
|
|
W13 (n=3) |
24°23'00.2"N 88°38'14.0"E |
|
|
W14 (n=3) |
24°21'14.1"N 8°38'48.1"E |
29 |
|
W15 (n=3) |
24°21'20.4"N 88°38'53.0"E |
|
|
W16 (n=3) |
24°21'16.0"N 88°38'56.7"E |
|
|
W17 (n=3) |
24°22'10.5"N 88°39'21.9"E |
30 |
|
W18 (n=3) |
24°22'06.2"N 88°39'48.9"E |
|
|
W19 (n=3) |
24°22'52.7"N 88°39'18.3"E |
|
|
W20 (n=3) |
24°22'53.6"N 88°39'33.3"E |
2.4 Sample preparation
Irrigation water samples were prepared for analysis by adopting the method described in the literature [33-35]. First, 100 ml of each water sample was taken in pyrex beakers, followed by adding 10 ml of concentrated HN03. On a hot plate, all the samples were boiled slowly and then evaporated to the lowest possible volume (about 20 ml). The beakers were allowed to cool, and 5 ml of concentrated HN03 was added. The heating continued at 85℃ with another 5 ml concentrated HN03 until the digested solution was clear and light-colored. The samples were evaporated again to dryness (but not baked) and the beakers were cooled, followed by adding 5 ml of HCl solution (1:1 v/v). The solutions were warmed, and 5 ml of 5 M NaOH was added and filtered through Whatman No. 42 filter paper. The filtrates were transferred to 100 ml volumetric flasks and diluted to the mark with de-ionized water. These solutions were then used for the elemental analysis.
2.5 Analysis of elements
The concentration of Pb, Cr, Mn, and Cd in the filtrate samples was estimated by using an atomic absorption spectrophotometer (SHIMADZU AA-6800) at the Central Science Laboratory of the University of Rajshahi, Bangladesh. The instrument was fitted with a specific lamp of a particular metal. The AAS was calibrated using manually made standard solutions of the relevant heavy metals and drift blanks. Standard stock solutions of 1000 mg/L for all the metals were purchased from Kanto Chemical Co. Inc, Tokyo, Japan. These solutions were diluted to the desired concentrations to calibrate the instrument. Data were analyzed by IBM® SPSS® Statistics of version 17.0 for Windows®. Results are presented as mean± Standard Deviations (SD).
2.6 Pollution assessment
The pollution assessment program is a module for monitoring and preventing pollution that can be used to assess the environmental impact of chemicals and industrial processes. Assessment is intended to provide information to all parties concerned so that the best possible decisions are made. The assessment of heavy metal pollution was derived using the enrichment factor (EF), geoaccumulation index (Igeo), contamination factor (CF), and modified degree of contamination (MDC) were used. These parameters are widely used to assess the pollution level for heavy metal contamination. Some industries and industrial activities in Rajshahi City release heavy metals into the environment, which may cause heavy metal pollution in irrigation water. Because of this, these parameters were chosen for the pollution assessment of this study.
2.6.1 Enrichment factor (EF)
The EF was first carried out by Buat-Menard and Chesselet [36]. It is a useful tool for assessing the magnitude of contamination and distinguishing the sources (anthropogenic or natural sources) of heavy metals calculated in soil and street dust [37]. Recently, the EF value has been broadly used to evaluate the contamination status of heavy metals in environmental samples [37-40]. Based on Buat-Menard and Chesselet [36], the EF Eq. (1) is given below:
$E F=\frac{\left(\frac{C_x}{C_{\text {reference }}}\right)_\,\,\,{\text {sample }}}{\left(\frac{C_x}{C_{\text {reference }}}\right)_\,\,\,{\text {background }}}$ (1)
where, EF is the enrichment factor, $\left(C_x / C_{\text {reference }}\right)_{\text {sample }}$ is the ratio of metal and reference element (Mn) concentrations in the irrigation water, and $\left(C_x / C_{\text {reference }}\right)_{\text {background }}$ is the ratio of the metal and reference element (Mn) concentrations in the background data (subsurface water) of the study area. The elements Fe [41], Al [42], and Mn [43, 44] are common references when computing the EFs of toxic metals in environmental samples. In this study, Mn was selected to represent the reference element. the factor is summarized in Table 2 [36, 40].
2.6.2 Geoaccumulation index (Igeo)
The Igeo was calculated using Eq. (2), as initially proposed by Muller [45]. This index has been widely used to assess the contamination levels by heavy metals, as found in the literature [37, 40, 46, 47].
$I_{g e o}=\ln \frac{C_n}{1.5 \times B_n}$ (2)
where, Cn is the measured concentration of metal and Bn is the geochemical background concentration of the corresponding metal of the average continental shale. In this study, the average values of soil samples of the study regions are taken as a reference point and considered as Bn values [48]. A factor of 1.5 is used to include a possible variation of background values due to lithogenic effects and an index of enrichment [45]. The contamination levels based on Igeo are summarized in Table 2 [40, 45].
Table 2. The EF model for heavy metals contamination [36, 40] and contamination level based on Igeo [40, 45]
|
EF |
Igeo |
|||
|
EF Values |
Water Quality |
Class |
Value |
Water Quality |
|
EF<1 |
No enrichment |
0 |
Igeo<0 |
Uncontaminated |
|
1≤ EF< 3 |
Minor enrichment |
1 |
0<Igeo<1 |
Uncontaminated to moderately contaminated |
|
3≤ EF< 5 |
Moderate enrichment |
2 |
1<Igeo<2 |
Moderately contaminated |
|
5≤ EF<10 |
Moderately severe enrichment |
3 |
2<Igeo<3 |
Moderately to heavily contaminated |
|
10≤ EF< 25 |
Severe enrichment |
4 |
3<Igeo<4 |
Heavily contaminated |
|
25≤ EF< 50 |
Very severe enrichment |
5 |
4<Igeo<5 |
Heavily to extremely contaminated |
|
EF≥50 |
Extremely severe enrichment |
6 |
5<Igeo |
Extremely contaminated |
2.6.3 Contamination factor (CF)
The CF was first proposed by Hakanson [49], and recently, it has been widely used to determine the contamination level of heavy metals in environmental samples [37, 50-52]. CF was calculated by using Eq. (3) based on Hakanson [49].
$C F=\frac{C_{\text {sample }}}{C_{\text {bacground }}}$ (3)
where, Csample and Cbackground, respectively, refer to the concentration of a pollutant in the samples (collected directly from the field) and the background (subsurface water) of the study area. The CF model for heavy metals contamination is given in Table 3 [37, 49].
2.6.4 Modified degree of contamination (MDC)
The MDC is also used for the determination of the contamination status of heavy metals in the environmental samples. MDC was calculated according to the following formula [53, 54].
$M D C=\frac{\sum_{i=1}^n C F_i}{n}$ (4)
where, MDC is the modified degree of contamination, n is the number of analyzed elements, and i is ith element. The MDC model for heavy metals contamination is summarized in Table 3 [53, 54].
Table 3. The CF [37, 49] and MDC [53, 54] model for heavy metals contamination
|
CF |
MDC |
||
|
CF Values |
Classification |
MDC Values |
Water Quality |
|
CF<1 |
Low |
MDC<1.5 |
Nil to low degree of contamination |
|
1≤ CF< 3 |
Moderate |
1.5≤MDC<2 |
Low degree of contamination |
|
3≤ CF< 6 |
Considerable |
2≤MDC<4 |
Moderate degree of contamination |
|
CF≥6 |
Very High |
4≤MDC<8 |
High degree of contamination |
|
|
|
8≤MDC<16 |
Very high degree of contamination |
|
|
|
16≤MDC<32 |
Extremely high degree of contamination |
|
|
|
MDC>32 |
Ultra-high degree of contamination |
3.1 Heavy metals
The concentration of selected heavy metals (Pb, Cr, Mn, and Cd) in irrigation water samples were studied through AAS as shown in Table 4. The concentrations were taken as milligrams of total metal per liter of the water samples. In addition, minimum values (Min), maximum values (Max), average values, standard deviations (SD), and percentage relative standard deviations (%RSD) were also calculated for all samples, which are given in Table 4.
Lead is a toxic element that is vastly used in different electronic devices. It is also responsible for health problems, including behavioral changes, pedagogical disabilities, seizures, and subsequent demise. The high toxicity of Pb could lead to renal abnormalities and neurological disorders. It is reported by most physicians that acute Pb toxicity might lead to anemia that could subsequently consequence in heme inhibition as well as erythrocytes destruction [55]. In the environment, the possible sources of Pb could be runoffs from large and uncontrolled dumpsites of Pb-containing wastes [56], hills surrounding the dams, atmospheric deposition [57], roads [58] and mechanic workshops [59]. Lead is also the main constituent of lead-acid batteries and tires and can leach and end up in soil [60]. In this study, Pb was found in the range of 0.0211-0.2104 mg/L, with an average value of 0.0895 mg/L. The maximum allowable limit (MAL) of lead in irrigation water recommended by the Food and Agricultural Organization (FAO) is 5 mg/L [61]. Another study by Gupta et al. [62] found that Pb concentration was highest than MAL in both untreated (0.0-7.5 mg/L) and treated (0.4-6.8 mg/L) wastewater used for irrigation in areas of Titagarh, West Bengal, India. Abd El-Mageed et al. [63] studied the chemical composition of heavy metal–contaminated irrigation water and found that Pb levels ranged between 7.1 and 8.0 mg/L, which were higher than the MAL standard. On the other hand, Tarekegn and Weldekidan [64] revealed that the amount of Pb was 3.23 mg/L (average value) in the irrigation water collected from the Akaki River, Addis Ababa, Ethiopia. The value was found to be lower than the MAL set by FAO. Similarly, Ngweme et al. [65] investigated irrigation water in peri-urban areas in Kinshasa, Democratic Republic of the Congo. They found that the Pb concentration was lower than the MAL of 5 mg/L. Ahmed et al. [66] and Sagagi et al. [67] found Pb in irrigation water 2.04 mg/L and 0.313 mg/L, respectively, which does not exceed the MAL as set by FAO. The mean concentrations of Pb were found below the MAL of 5 mg/L by Abuzaid et al. [68]. So, in the present study, it is revealed that the Pb level was found below the permissible limits of FAO for irrigation water.
Table 4. The concentration of metals in irrigation water (mg/L)
|
Sample No. |
Samples Collection Location |
Pb |
Cr |
Mn |
Cd |
|
W1 |
Ward no. 2 (n=3) |
0.0421 ± 0.002 |
0.00421 ± 0.02 |
0.1826 ± 0.00 |
0.0165 ± 0.002 |
|
W2 |
Ward no. 2 (n=3) |
0.0211 ± 0.001 |
0.00211 ± 0.02 |
0.2245 ± 0.01 |
0.0095 ± 0.000 |
|
W3 |
Ward no. 2 (n=3) |
0.1473 ± 0.001 |
0.00316 ± 0.03 |
0.2097 ± 0.01 |
0.0080 ± 0.001 |
|
W4 |
Ward no. 14 (n=3) |
0.0421 ± 0.001 |
0.00526 ± 0.03 |
0.0913 ± 0.00 |
0.0222 ± 0.000 |
|
W5 |
Ward no. 14 (n=3) |
0.1683 ± 0.003 |
0.00737 ± 0.01 |
0.2073 ± 0.00 |
0.0076 ± 0.002 |
|
W6 |
Ward no. 14 (n=3) |
0.0632 ± 0.001 |
0.00316 ± 0.03 |
0.2344 ± 0.00 |
0.0089 ± 0.001 |
|
W7 |
Ward no. 17 (n=3) |
0.0421 ± 0.002 |
0.00211 ± 0.03 |
0.2394 ± 0.00 |
0.0120 ± 0.000 |
|
W8 |
Ward no. 17 (n=3) |
0.0421 ± 0.001 |
0.00105 ± 0.02 |
0.2492 ± 0.02 |
0.0042 ± 0.001 |
|
W9 |
Ward no. 18 (n=3) |
0.0211 ± 0.003 |
0.00316 ± 0.01 |
0.1307 ± 0.01 |
0.0217 ± 0.003 |
|
W10 |
Ward no. 18 (n=3) |
0.0632 ± 0.001 |
0.00737 ± 0.01 |
0.1801 ± 0.00 |
0.0182 ± 0.001 |
|
W11 |
Ward no. 18 (n=3) |
0.1473 ± 0.001 |
0.00316 ± 0.02 |
0.2344 ± 0.00 |
0.0080 ± 0.001 |
|
W12 |
Ward no. 18 (n=3) |
0.1053 ± 0.001 |
0.00937 ± 0.01 |
0.2985 ± 0.01 |
0.0165 ± 0.002 |
|
W13 |
Ward no. 26 (n=3) |
0.0632 ± 0.002 |
0.00832 ± 0.03 |
0.3108 ± 0.01 |
0.0132 ± 0.001 |
|
W14 |
Ward no. 26 (n=3) |
0.0211 ± 0.002 |
0.00421 ± 0.01 |
0.3084 ± 0.02 |
0.0004 ± 0.001 |
|
W15 |
Ward no. 26 (n=3) |
0.1263 ± 0.001 |
0.00105 ± 0.02 |
0.3380 ± 0.00 |
0.0213 ± 0.000 |
|
W16 |
Ward no. 26 (n=3) |
0.0211 ± 0.003 |
0.00737 ± 0.02 |
0.3084 ± 0.00 |
0.0186 ± 0.003 |
|
W17 |
Ward no. 26 (n=3) |
0.2104 ± 0.001 |
0.00421 ± 0.03 |
0.3158 ± 0.00 |
0.0184 ± 0.001 |
|
W18 |
Ward no. 29 (n=3) |
0.1263 ± 0.002 |
0.00737 ± 0.01 |
0.3429 ± 0.00 |
0.0089 ± 0.001 |
|
W19 |
Ward no. 29 (n=3) |
0.1894 ± 0.001 |
0.00105 ± 0.01 |
0.3627 ± 0.01 |
0.0017 ± 0.002 |
|
W20 |
Ward no. 29 (n=3) |
0.1263 ± 0.001 |
0.00211 ± 0.03 |
0.3701 ± 0.01 |
0.0160 ± 0.001 |
|
Min |
|
0.0211 |
0.0011 |
0.0913 |
0.0004 |
|
Max |
|
0.2104 |
0.0094 |
0.3701 |
0.0222 |
|
Average |
|
0.0895 |
0.0044 |
0.2570 |
0.0126 |
|
SD |
|
0.06138 |
0.0026 |
0.0772 |
0.0066 |
|
%RSD |
|
68.605 |
60.402 |
30.049 |
52.714 |
|
MAL |
|
5 |
0.1 |
0.2 |
0.01 |
MAL: Maximum allowable limit of trace elements in irrigation water as set by FAO [61].
Cr provokes several deleterious effects in physiological, morphological, and biochemical processes inside plants. It induces phytotoxicity by interfering with plant growth, nutrient uptake, and photosynthesis, inducing the enhanced generation of reactive oxygen species, causing lipid peroxidation, and altering antioxidant activities [69]. The Cr concentration in the collected samples ranged from 0.00105 mg/L to 0.00937 mg/L, with an average value of 0.0044 mg/L. As set by FAO, the MAL of Cr in irrigation water is 0.1 mg/L [61]. All the water samples contain a lower amount of Cr than the MAL. These values can be compared with other researches. The average concentrations of Cr in irrigation water were found to be 0.45 mg/L by Ahmed et al. [66], while Faouzi et al. [70] found 0.054 mg/L and 0.366 mg/L in winter and summer, respectively. All these reported values are higher than the MAL values. Arefin et al. [71] investigated the surface water used for irrigation of the Turag River in Bangladesh and found Cr concentration was higher than the MAL of 0.1 mg/L. However, our study indicates that Cr does not pose significant contamination in the selected study areas.
Manganese is known as a micronutrient that is essential in almost all living organisms and acts as an enzyme cofactor or a catalytic metal [72]. Furthermore, high concentrations of Mn toxicity can result in hepatic cirrhosis, polycythemia, dystonia, and Parkinson's disease [73]. In this study, the level of Mn in the collected samples was varied from 0.0913 mg/L to 0.3701 mg/L, with an average value of 0.2570 mg/L. As set by FAO, the MAL of manganese in irrigation water is 0.2 mg/L [61]. Mn concentrations for four samples were found below the MAL; the rest have a higher value of 0.2 mg/L. On the other hand, Sagagi et al. [67] reported Mn concentrations of 0.239 to 0.251 mg/L in irrigation water samples. These values were marginally higher than the MAL [61]. Maleki et al. [74] studied irrigation water at peri-urban sites in Sanandaj, Iran, and found that Mn concentration was lower than the MAL set by FAO. Mn concentrations in all irrigation water samples surpassed the MAL of 0.2 mg/L [68]. Arefin et al. [71] found lowest Mn concentration of the samples is 0.35 mg/L which exceeds the MAL of 0.2 mg/L, so all samples were higher than the limit. Hence, our study indicates that Mn concentration levels are higher than in other studies and MAL. Therefore, Mn can cause a significant impact in the study areas unless further action is taken.
Cadmium is a potential carcinogen [72], and Cd-rich wastewaters result in serious human health problems [67]. The "Itai-itai" disease was the earliest case of Cd toxicity which was first reported in the 1970s [75]. The concentration level of Cd lies in the range of 0.0004 mg/L to 0.0222 mg/L, with an average value of 0.0126 mg/L. The MAL of cadmium in irrigation water by FAO is 0.01 mg/L [61]. In this study, 55% of irrigation water samples exceeded the MAL set by FAO. Tarekegn and Weldekidan [64] found Cd between 0.03 and 0.4 mg/L with an average value of 0.1566 mg/L, which is remarkably higher than the MAL of FAO. Other researchers recorded Cd concentrations in irrigation water and found them lower than the MAL recommended by FAO [65, 67, 74]. So, we can postulate a similar conclusion, likewise Mn concentration.
3.2 Pollution assessment
The indices viz. EF, Igeo, CF, and MDC were used for the pollution assessment of the irrigation water in the study area. The calculated values of the EF and Igeo in irrigation water from different locations of Rajshahi are tabulated in Table 5 and Table 6 respectively. The calculated CF and MDC values are given in Table 7. From this study, it can be revealed that the EF values of Pb and Cr were below 1.0, which indicates no enrichment, according to Table 2. The EF values for Cd were between 1.0 and 3.0 for several samples, which shows minor enrichment. However, the EF value is greater than 3.0 for a single sample, which denotes moderate enrichment of contamination. According to Sutherland [76], as the EF values increases, the contribution of the anthropogenic origins also increases. Withanachchi et al. [77] studied the downstream areas of the Mashavera River and Poladauri River and showed considerable anthropogenic enrichment for Cd and some Pb enrichment in downstream irrigation canals. Alnuwaiser [38] studied EF values of heavy metals in wastewater-treated basin soil and found that soil samples reflect anthropogenic effects. Liu et al. [78], recorded EF > 1.0 of heavy metals in agricultural soils with sewage irrigation, indicating that the concentration of each metal in the soils tended to increase. In the Hengshui Lake of China, Cd was moderately enriched, while Pb showed light enrichment by Liu et al. [39].
Table 5. The EF in irrigation water
|
Sample No. |
EF |
||
|
Pb |
Cr |
Cd |
|
|
W1 |
0.0092 |
0.0461 |
1.8072 |
|
W2 |
0.0038 |
0.0188 |
0.8463 |
|
W3 |
0.0281 |
0.0301 |
0.7630 |
|
W4 |
0.0184 |
0.1152 |
4.8631 |
|
W5 |
0.0325 |
0.0711 |
0.7332 |
|
W6 |
0.0108 |
0.0270 |
0.7594 |
|
W7 |
0.0070 |
0.0176 |
1.0025 |
|
W8 |
0.0068 |
0.0084 |
0.3371 |
|
W9 |
0.0065 |
0.0484 |
3.3206 |
|
W10 |
0.0140 |
0.0818 |
2.0211 |
|
W11 |
0.0251 |
0.0270 |
0.6826 |
|
W12 |
0.0141 |
0.0628 |
1.1055 |
|
W13 |
0.0081 |
0.0535 |
0.8494 |
|
W14 |
0.0027 |
0.0273 |
0.0259 |
|
W15 |
0.0149 |
0.0062 |
1.2604 |
|
W16 |
0.0027 |
0.0478 |
1.2062 |
|
W17 |
0.0266 |
0.0267 |
1.1653 |
|
W18 |
0.0147 |
0.0430 |
0.5191 |
|
W19 |
0.0209 |
0.0058 |
0.0937 |
|
W20 |
0.0137 |
0.0114 |
0.8646 |
|
Min |
0.0027 |
0.0058 |
0.0259 |
|
Max |
0.0325 |
0.1152 |
4.8631 |
|
Average |
0.0140 |
0.0388 |
1.2113 |
Using the Muller [45] scale, the Igeo for Pb and Cr was less than 0, which demonstrated that the samples were uncontaminated, based on Table 2. Some values for Mn and Cd were between 0 and 1.0, which indicates an uncontaminated to moderately contaminated range. Hossain et al. [46], studied Igeo value for Pb and Cr in the Sangu River estuary, Chattogram, Bangladesh, and found that the studied area was unpolluted by these metals. The process of lgeo calculation that integrates the logarithmic function and a background multiplication factor of 1.5, somewhat that is quite separate from other pollution calculation methods discussed in this study [47].
The CF values of Pb and Cr were less than 1.0, which is considered low contamination by Table 3. However, for Mn and Cd, maximum CF values were between 1.0 and 3.0, which denotes moderate contamination. Hasan et al. [51] found very high contamination for Mn, whereas considerable contamination was observed for Pb in the surface water of the Bay of Bengal coast. Esmaeilzadeh et al. [50] found CF for Cr and Mn at 1.0 > CF > 3.0, reflecting moderate pollution in the studied area. Several previous types of the research reported that using fertilizers and fungicides in agricultural lands and rice farms was the primary origin of many heavy metals in the Anzali Wetland [52].
Table 6. The Igeo in irrigation water
|
Sample No. |
Igeo |
|||
|
Pb |
Cr |
Mn |
Cd |
|
|
W1 |
-5.1826 |
-3.5732 |
-0.4965 |
0.0953 |
|
W2 |
-5.8734 |
-4.2639 |
-0.2899 |
-0.4568 |
|
W3 |
-3.9302 |
-3.8601 |
-0.3581 |
-0.6286 |
|
W4 |
-5.1826 |
-3.3505 |
-1.1896 |
0.3920 |
|
W5 |
-3.7969 |
-3.0132 |
-0.3696 |
-0.6799 |
|
W6 |
-4.7764 |
-3.8601 |
-0.2468 |
-0.5220 |
|
W7 |
-5.1826 |
-4.2639 |
-0.2256 |
-0.2231 |
|
W8 |
-5.1826 |
-4.9618 |
-0.1855 |
-1.2730 |
|
W9 |
-5.8734 |
-3.8601 |
-0.8309 |
0.3693 |
|
W10 |
-4.7764 |
-3.0132 |
-0.5103 |
0.1934 |
|
W11 |
-3.9302 |
-3.8601 |
-0.2468 |
-0.6286 |
|
W12 |
-4.2658 |
-2.7731 |
-0.0050 |
0.0953 |
|
W13 |
-4.7764 |
-2.8920 |
0.0354 |
-0.1278 |
|
W14 |
-5.8734 |
-3.5732 |
0.0276 |
-3.6243 |
|
W15 |
-4.0840 |
-4.9618 |
0.1193 |
0.3507 |
|
W16 |
-5.8734 |
-3.0132 |
0.0276 |
0.2151 |
|
W17 |
-3.5736 |
-3.5732 |
0.0513 |
0.2043 |
|
W18 |
-4.0840 |
-3.0132 |
0.1337 |
-0.5220 |
|
W19 |
-3.6788 |
-4.9618 |
0.1898 |
-2.1774 |
|
W20 |
-4.0840 |
-4.2639 |
0.2100 |
0.0645 |
|
Min |
-5.8734 |
-4.9618 |
-1.1896 |
-3.6243 |
|
Max |
-3.5736 |
-2.7731 |
0.2100 |
0.3920 |
|
Average |
-4.6990 |
-3.7453 |
-0.2080 |
-0.4442 |
The MDC was used to describe the extent of contamination of a metal contaminant [79, 80]. The MDC value for all samples was found below 1.5, demonstrating nil to the lower degree of contamination following Table 3. Devanesan et al. [81] found a moderate degree of contamination of Pb, whereas Mn and Cr show a high degree of contamination. MDC values for Mn were found between 0.6 and 2.1, indicating a moderate degree of contamination. For Cr, the value was found below 2.0, demonstrating nil to the low degree of contamination [82].
This study highlights the significant impact of heavy metal pollution on the local environment and public health. This contamination could negatively affect crop quality and vegetation, leading to bioaccumulation and biomagnification, which can harm wildlife, organisms, and human health. Elevated heavy metal contamination levels in food can pose direct risks to human health, especially if people consume contaminated crops and food. Heavy metal contamination may lead to respiratory problems, skin disorders, and chronic diseases in individuals living near contaminated areas [29]. To reduce the risk of exposure to heavy metals, environmental remediation efforts should be initiated. Methods for removing heavy metals from water include membrane filtration, adsorption, chemical precipitation, solvent extraction, ion exchange, reverse osmosis, and electrochemical treatment. Soil treatment can be achieved using physical and chemical treatments such as soil washing, electro-kinetic remediation, and phytoremediation techniques, including phytovolatilization, phytostabilization, phytoextraction, and phytofiltration. Communities should be informed about potential risks and encouraged to take preventive measures, such as proper waste management. In order to develop targeted health interventions, more investigation is required to identify the sources of contamination, put pollution controls in place, and study the impact of specific metal contaminants on local populations' health.
Table 7. The CF and MDC in irrigation water
|
Sample No. |
CF |
MDC |
|||
|
Pb |
Cr |
Mn |
Cd |
||
|
W1 |
0.00842 |
0.0421 |
0.913 |
1.65 |
0.65338 |
|
W2 |
0.00422 |
0.0211 |
1.1225 |
0.95 |
0.524455 |
|
W3 |
0.02946 |
0.0316 |
1.0485 |
0.8 |
0.47739 |
|
W4 |
0.00842 |
0.0526 |
0.4565 |
2.22 |
0.68438 |
|
W5 |
0.03366 |
0.0737 |
1.0365 |
0.76 |
0.475965 |
|
W6 |
0.01264 |
0.0316 |
1.172 |
0.89 |
0.52656 |
|
W7 |
0.00842 |
0.0211 |
1.197 |
1.2 |
0.60663 |
|
W8 |
0.00842 |
0.0105 |
1.246 |
0.42 |
0.42123 |
|
W9 |
0.00422 |
0.0316 |
0.6535 |
2.17 |
0.71483 |
|
W10 |
0.01264 |
0.0737 |
0.9005 |
1.82 |
0.70171 |
|
W11 |
0.02946 |
0.0316 |
1.172 |
0.8 |
0.508265 |
|
W12 |
0.02106 |
0.0937 |
1.4925 |
1.65 |
0.814315 |
|
W13 |
0.01264 |
0.0832 |
1.554 |
1.32 |
0.74246 |
|
W14 |
0.00422 |
0.0421 |
1.542 |
0.04 |
0.40708 |
|
W15 |
0.02526 |
0.0105 |
1.69 |
2.13 |
0.96394 |
|
W16 |
0.00422 |
0.0737 |
1.542 |
1.86 |
0.86998 |
|
W17 |
0.04208 |
0.0421 |
1.579 |
1.84 |
0.875795 |
|
W18 |
0.02526 |
0.0737 |
1.7145 |
0.89 |
0.675865 |
|
W19 |
0.03788 |
0.0105 |
1.8135 |
0.17 |
0.50797 |
|
W20 |
0.02526 |
0.0211 |
1.8505 |
1.6 |
0.874215 |
|
Min |
0.0042 |
0.0105 |
0.4565 |
0.0400 |
0.4071 |
|
Max |
0.0421 |
0.0937 |
1.8505 |
2.2200 |
0.9639 |
|
Average |
0.0179 |
0.0436 |
1.2848 |
1.2590 |
0.6513 |
This study aimed to determine the concentration levels of heavy metals (Pb, Cr, Mn, and Cd) in the irrigation water used in different places of Rajshahi City Corporation of Bangladesh along with the pollution assessments. The present findings provided additional data on heavy metal pollution and can help in the risk assessment of consumer exposure to heavy metal contamination. The heavy metals concentration in the studied irrigation water samples was compared with the permissible guidelines required for safe irrigation water to produce healthy food. Based on the result, Mn was high from the studied irrigation water, whereas Cr was found with a low value. The results revealed that Mn exceeded the permissible limit set by FAO in most cases, and few cases, there was some deviation for Cd with the permissible limit. The average concentration of heavy metals, measured in irrigation water, lies in the increasing order of Cr (0.0044) < Cd (0.0126) < Pb (0.0895) < Mn (0.2570). Crops can absorb these metals from irrigation water and soil, affecting growth and nutrient absorption and reducing yields and quality. Consuming contaminated crops containing heavy metals may damage vital organs and cause chronic health issues. Preventive measures involve water management, soil testing, and consumer awareness for safer produce consumption. This study could suggest that further research is needed with a huge number of samples and heavy metals to determine the possible sources of heavy metal contamination in irrigation water in the studied area considering local geology, industrial activities, and agricultural practices and should take proper action. This study will, therefore, be helpful to take further steps by the relevant stockholders.
The authors thank the Department of Applied Chemistry and Chemical Engineering, Faculty of Engineering, University of Rajshahi, Bangladesh, for supporting the laboratory facilities.
|
Pb |
lead |
|
Cr |
chromium |
|
Mn |
manganese |
|
Cd |
cadmium |
|
AAS |
atomic absorption spectroscopy |
|
FAO |
Food and Agricultural Organization |
|
MAL |
maximum allowable limit |
|
EF |
enrichment factor |
|
Igeo |
geoaccumulation index |
|
CF |
contamination factor |
|
MDC |
modified degree of contamination |
|
Min |
minimum values |
|
Max |
maximum values |
|
SD |
standard deviations |
|
%RSD |
percentage relative standard deviations |
[1] Tchounwou, P.B., Yedjou, C.G., Patlolla, A.K., Sutton, D.J. (2012). Heavy metal toxicity and the environment. In: Luch, A. (eds), Molecular, clinical and environmental toxicology: Experientia supplementum, Springer, Basel, 101: 133-164, https://doi.org/10.1007/978-3-7643-8340-4_6
[2] Timothy, N., Williams, E.T. (2019). Environmental pollution by heavy metal: An overview. International Journal of Environmental Chemistry, 3(2): 72-82. https://doi.org/10.11648/j.ijec.20190302.14
[3] Balkhair, K.S., Ashraf, M.A. (2016). Field accumulation risks of heavy metals in soil and vegetable crop irrigated with sewage water in western region of Saudi Arabia. Saudi Journal of Biological Sciences, 23(1): S32-S44. https://doi.org/10.1016/j.sjbs.2015.09.023
[4] Ostad-Ali-Askari, K., Shayannejad, M., Eslamian, S., Zamani, F., Shojaei, N., Navabpour, B., Majidifar, Z., Sadri, A., Ghasemi-Siani, Z., Nourozi, H., Vafaei, O., Homayouni, S.-M.-A. (2017). Deficit irrigation: Optimization models. In Handbook of Drought and Water Scarcity: Management of Drought and Water Scarcit, CRC Press, pp. 375-391. https://doi.org/10.1201/9781315226774-18
[5] Nafchi, R.F., Samadi-Boroujeni, H., Vanani, H.R., Ostad-Ali-Askari, K., Milad Khastar Brojeni, M.K. (2021). Laboratory investigation on erosion threshold shear stress of cohesive sediment in Karkheh Dam. Environmental Earth Sciences, 80: 681. https://doi.org/10.1007/s12665-021-09984-x
[6] Khalef, R.N., Hassan, A.I., Saleh, H.M. (2022). Heavy metal’s environmental impact. Environmental Impact and Remediation of Heavy Metals. https://doi.org/10.5772/intechopen.103907
[7] Akil Khosheghbal, M.Z., Charkhabi, A.H., Sharifi, F., Ghazban, F. (2013). An investigation of sediment pollution in the Anzali wetland. Polish Journal of Environmental Studies, 22(1): 283-288.
[8] Flora, G., Gupta, D., Tiwari, A. (2012). Toxicity of lead: A review with recent updates. Interdisciplinary Toxicology, 5(2): 47-58. https://doi.org/10.2478/v10102-012-0009-2
[9] Ostad-Ali-Askari, K. (2022). Management of risks substances and sustainable development. Applied Water Science, 12: 65. https://doi.org/10.1007/s13201-021-01562-7
[10] Shahriar, S.M.S., Islam, M.J., Hanif, M.A., Salam, S.M.A. (2022). Level of chromium and zinc in groundwater and cows' raw milk in Rajshahi, Bangladesh. International Journal of All Research Education and Scientific Methods, 10(2): 2153-2158.
[11] Rojas-Avelizapa, N.G. (2022). Biotechnology for Treatment of Residual Wastes Containing Metals, River Publishers, pp. 26. https://books.google.com.bd/books?id=S_yGEAAAQBAJ, accessed on Dec. 20, 2022.
[12] Farina, M., Avila, D.S., Rocha, J.B.T., Aschner, M. (2013). Metals, oxidative stress and neurodegeneration: A focus on iron, manganese and mercury. Neurochemistry International, 62(5): 575-594. https://doi.org/10.1016/j.neuint.2012.12.006
[13] Ghosh, G.C., Khan, M., Chakraborty, T.K., Zaman, S., Kabir, A., Tanaka, H. (2020). Human health risk assessment of elevated and variable iron and manganese intake with arsenic-safe groundwater in Jashore, Bangladesh. Scientific Reports, 10(1): 5206. https://doi.org/10.1038/s41598-020-62187-5
[14] Rahman, M.A., Hashem, M.A., Rana, M.S., Islam, M.R. (2021). Manganese in potable water of nine districts, Bangladesh: Human health risk. Environmental Science and Pollution Research, 28: 45663–45675. https://doi.org/10.1007/s11356-021-14016-z
[15] Hernandez-Cruz, E.Y., Amador-Martinez, I., Aranda-Rivera, A.K., Cruz-Gregorio, A., Chaverri, J.P. (2022). Renal damage induced by cadmium and its possible therapy by mitochondrial transplantation. Chemico-Biological Interactions, 361: 109961. https://doi.org/10.1016/j.cbi.2022.109961
[16] Zhao, L.L., Ru, Y.F., Liu, M., Tang, J.N., Zheng, J.F., Wu, B., Gu, Y.H., Shi, H.J. (2017). Reproductive effects of cadmium on sperm function and early embryonic development in vitro. PLoS One, 12(11): e0186727. https://doi.org/10.1371%2Fjournal.pone.0186727
[17] Qing, Y., Yang, J., Chen, Y., Shi, C., Zhang, Q., Ning, Z., Yu, Y., Li, Y. (2021). Urinary cadmium in relation to bone damage: Cadmium exposure threshold dose and health-based guidance value estimation. Ecotoxicology and Environmental Safety, 226: 112824. https://doi.org/10.1016/j.ecoenv.2021.112824
[18] Liu, X., Song, Q., Tang, Y., Li, W., Xu, J., Wu, J., Wang, F., Brookes, P.C. (2013). Human health risk assessment of heavy metals in soil–vegetable system: A multi-medium analysis. Science of the Total Environment, 463-464: 530-540. https://doi.org/10.1016/j.scitotenv.2013.06.064
[19] Tellez-Plaza, M., Jones, M.R., Dominguez-Lucas, A., Guallar, E., Navas-Acien, A. (2013). Cadmium exposure and clinical cardiovascular disease: A systematic review. Current Atherosclerosis Reports, 15: 356. https://doi.org/10.1007/s11883-013-0356-2
[20] Luevano, J., Damodaran, C. (2014). A review of molecular events of cadmium-induced carcinogenesis. Journal of environmental pathology, toxicology and oncology: Official organ of the International Society for Environmental Toxicology and Cancer, 33(3): 183-194. https://doi.org/10.1615/jenvironpatholtoxicoloncol.2014011075
[21] Roy, S., Mahapatra, R., Rath, S., Bajpai, A., Singh, V., Rath, S., Nair, N., Tripathy, P.K., Gope, R., Sinha, R., Costello, A., Pagel, C., Prost, A. (2013). Improved neonatal survival after participatory learning and action with women's groups: A prospective study in rural eastern India. Bulletin of the World Health Organisation, 91(6): 426-433. https://doi.org/10.2471%2FBLT.12.105171
[22] Ahmed, M., Matsumoto, M. Kurosawa, K. (2018). Heavy metal contamination of irrigation water, soil, and vegetables in a multi-industry district of Bangladesh. International Journal of Environmental Research, 12: 531–542. https://doi.org/10.1007/s41742-018-0113-z
[23] Bhuiyan, M.A.H., Islam, M.A., Dampare, S.B., Lutfar Parvez, L., Suzuki, S. (2010). Evaluation of hazardous metal pollution in irrigation and drinking water systems in the vicinity of a coal mine area of northwestern Bangladesh. Journal of Hazardous Materials, 179(1-3): 1065-1077. https://doi.org/10.1016/j.jhazmat.2010.03.114
[24] Rampley, C.P.N., Whitehead, P.G., Softley, L., Hossain, M.A., Jin, L., David, J., Shawal, S., Das, P., Thompson, I.P., Huang, W.E., Peters, R., Holdship, P., Hope, R., Alabaster, G. (2020). River toxicity assessment using molecular biosensors: Heavy metal contamination in the Turag-Balu-Buriganga River systems, Dhaka, Bangladesh. Science of the Total Environment, 703: 134760. https://doi.org/10.1016/j.scitotenv.2019.134760
[25] Saha, N., Zaman, M.R. (2011). Concentration of selected toxic metals in groundwater and some cereals grown in Shibganj area of Chapai Nawabganj, Rajshahi, Bangladesh. Current Science, 101(3): 427-431. http://www.jstor.org/stable/24078523
[26] Zakir, H., Rahman, M.M., Rahman, A., Ahmed, I., Hossain, M. (2013). Heavy metals and major ionic pollution assessment in waters of midstream of the river Karatoa in Bangladesh. Journal of Environmental Science and Natural Resources, 5(2): 149-160. https://doi.org/10.3329/jesnr.v5i2.14806
[27] Bhatia, A., Singh, S., Kumar, A. (2015). Heavy metal contamination of soil, irrigation water and vegetables in peri-urban agricultural areas and markets of Delhi. Water Environment Research, 87: 2027-2034. https://doi.org/10.2175/106143015X14362865226833
[28] Malan, M., Müller, F., Cyster, L., Raitt, L., Aalbers, J. (2015). Heavy metals in the irrigation water, soils and vegetables in the Philippi horticultural area in the Western Cape Province of South Africa. Environmental Monitoring and Assessment, 187: 4085. https://doi.org/10.1007/s10661-014-4085-y
[29] Shahriar, S.M.S., Munshi, M. Hossain, M.S., Zakir, H.M., Salam, S.M.A. (2023). Risk assessment of selected heavy metals contamination in rice grains in the Rajshahi City of Bangladesh. Journal of Engineering Science, 14(1): 29-41. https://doi.org/10.3329/jes.v14i1.67633
[30] Jamal, A.H.M.S.I.M., Ahmed, S., Akter, S., Nahar, A., Sultana, R., Uddin, M.R., Hasan, M., Jahan, T., Sultana, S. (2020). Chemistry of pre-monsoon and monsoon rain water in Rajshahi City of Bangladesh. International Journal of Academic Scientific Research, 8(2): 21-29.
[31] Banglapedia. (2021). National Encyclopedia of Bangladesh, https://en.banglapedia.org/index.php/Bangladesh
[32] Davies, T.C. (1996). Chemistry and pollution of natural waters in Western Kenya. Journal of African Earth Sciences, 23(4): 547-563. https://doi.org/10.1016/S0899-5362(97)00018-3
[33] Agoro, M.A., Adeniji, A.O., Adefisoye, M.A., Okoh, O.O. (2020). Heavy metals in wastewater and sewage sludge from selected municipal treatment plants in Eastern Cape Province, South Africa. Water, 12(10): 2746. https://doi.org/10.3390/w12102746
[34] Bala, M., Shehu, R.A., Lawal, M. (2008). Determination of the level of some heavy metals in water collected from two pollution-prone irrigation areas around Kano Metropolis. Bayero Journal of Pure and Applied Sciences, 1(1): 36-38. https://doi.org/10.4314/bajopas.v1i1.57511
[35] Gregg, L.W. (1989). In Handbook of Water Analysis, HACH Company, USA, pp. 33-39.
[36] Buat-Menard, P., Chesselet, R. (1979). Variable influence of the atmospheric flux on the trace metal chemistry of oceanic suspended matter. Earth and Planetary Science Letters, 42: 399-411. https://doi.org/10.1016/0012-821X(79)90049-9
[37] Dat, N.D., Nguyen, V.-T., Vo, T.-D.-H., Bui, X.-T., Bui, M.-H., Nguyen, L.S.P., Nguyen, X.-C., Tran, A.T.-K., Nguyen, T.-T.-A., Ju, Y.-R., Huynh, T.-M.-T., Nguyen, D.-H., Bui, H.-N., Lin, C. (2021). Contamination, source attribution, and potential health risks of heavy metals in street dust of a metropolitan area in Southern Vietnam. Environmental Science and Pollution Research, 28: 50405-50419. https://doi.org/10.1007/s11356-021-14246-1
[38] Alnuwaiser, M.A. (2022). Evaluation of heavy metals in soil wastewater stream. International Journal of Analytical Chemistry, 2022: 2522840. https://doi.org/10.1155/2022/2522840
[39] Liu, W., Guo, Z., Wang H., Wang, D., Zhang, M. (2022). Spatial-temporal variations for pollution assessment of heavy metals in Hengshui lake of China. Water, 14: 458. https://doi.org/10.3390/w14030458
[40] Nguyen, V.-T., Dat, N.D., Vo, T.-D.-H., Nguyen, D.-H., Nguyen, T.-B., Nguyen, L.-S.P., Nguyen, X.C., Dinh, V.-C., Nguyen, T.-H.-H., Huynh, T.-M.-T., Hoang, H.-G., Duong, T.-G.H., Bui, M.-H., Bui, X.-T. (2021). Characteristics and risk assessment of 16 metals in street dust collected from a highway in a densely populated metropolitan area of Vietnam. Atmosphere, 12(12): 1548. https://doi.org/10.3390/atmos12121548
[41] Khademi, H., Gabarron, M., Abbaspour, A., Martinez-Martinez, S., Faz, A., Acosta, J. (2020). Distribution of metal(loid)s in particle size fraction in urban soil and street dust: Influence of population density. Environmental Geochemistry and Health, 42: 4341-4354. https://doi.org/10.1007/s10653-020-00515-4
[42] Liu, E., Yan, T., Birch, G., Zhu, Y. (2014). Pollution and health risk of potentially toxic metals in urban road dust in Nanjing, a mega-city of China. Science of the Total Environment, 476: 522-531. https://doi.org/10.1016/j.scitotenv.2014.01.055
[43] Cheng, Z., Chen, L.-J., Li, H.-H., Lin, J.-Q., Yang, Z.-B., Yang, Y.-X., Xu, X.-X., Xian, J.-R., Shao, J.-R., Zhu, X.-M. (2018). Characteristics and health risk assessment of heavy metals exposure via household dust from urban area in Chengdu, China. Science of the Total Environment, 619-620: 621-629. https://doi.org/10.1016/j.scitotenv.2017.11.144
[44] Zhou, L., Liu, G., Shen, M., Hu, R., Sun, M., Liu, Y. (2019). Characteristics and health risk assessment of heavy metals in indoor dust from different functional areas in Hefei, China. Environmental Pollution, 251: 839-849. https://doi.org/10.1016/j.envpol.2019.05.058
[45] Muller, M. (1979). Eukaryotic microbiology. Journal of Protozoology, 26: 415-419.
[46] Hossain, M.B., Shantaa, T.B., Ahmeda, A.S.S., Hossainb, M.K., Semme, S.A. (2019). Baseline study of heavy metal contamination in the Sangu River estuary, Chattogram, Bangladesh. Marine Pollution Bulletin, 140: 255-261. https://doi.org/10.1016/j.marpolbul.2019.01.058
[47] Looi, L.J., Aris, A.Z., Yusoff, F.M., Isa, N.M., Haris, H. (2019). Application of enrichment factor, geoaccumulation index, and ecological risk index in assessing the elemental pollution status of surface sediments. Environmental Geochemistry and Health, 41: 27-42. https://doi.org/10.1007/s10653-018-0149-1
[48] Jena, V., Ghosh, S., Pande, A., Kresimir Maldini, K., Matic, N. (2019). Geo-accumulation index of heavy metals in pond water sediment of Raipur. Bioscience Biotechnology Research Communications, 12(3): 585-588. https://doi.org/10.21786/bbrc/12.3/27
[49] Hakanson, L. (1980). An ecological risk index for aquatic pollution control.a sedimentological approach. Water Research, 14(8): 975-1001. https://doi.org/10.1016/0043-1354(80)90143-8
[50] Esmaeilzadeh, M., Mahmoudpuor, E., Haghighat, S., Esmaeilzadeh, S., Aliani, H., Yazdanfar, N. (2021). Contamination and ecological risk assessment of trace elements in sediments of the Anzali Wetland, Northern Iran. Water Science and Technology, 84(9): 2578-2590. https://doi.org/10.2166/wst.2021.455
[51] Hasan, M.R., Khan, M.Z.H., Khan, M., Aktar, S., Rahman, M., Hossain, F., Hasan, A.S.M.M. (2016). Heavy metals distribution and contamination in surface water of the Bay of Bengal coast. Cogent Environmental Science, 2(1): 1140001. https://doi.org/10.1080/23311843.2016.1140001
[52] Khosheghbal, M.Z., Charkhabi, A.H., Sharifi, F., Ghazban, F. (2013). An investigation of sediment pollution in the Anzali wetland. Polish Journal of Environmental Studies, 22(1): 283-288.
[53] Abrahim, G.M., Parker, R.J. (2008). Assessment of heavy metal enrichment factors and the degree of contamination in marine sediments from Tamaki Estuary, Auckland, New Zealand. Environmental Monitoring and Assessment, 136(1-3): 227-238. https://doi.org/10.1007/s10661-007-9678-2
[54] Hossain, M.S., Ahmed, M.K., Liyana, E., Hossain, M.S., Jolly, Y.N., Kabir, M.J., Akter, S., Rahman, M.S. (2021). A case study on metal contamination in water and sediment near a coal thermal power plant on the eastern coast of Bangladesh. Environments, 8: 108. https://doi.org/10.3390/environments8100108
[55] Sanborn, M.D., Abelsohn, A., Campbell, M., Weir, E. (2002). Identifying and managing adverse environmental health effects: 3. Lead Exposure. CMAJ, 166(10): 1287–1292.
[56] Akhtar, S., Khan, Z.I., Ahmad, K., Nadeem, M., Ejaz, A., Hussain, M.I., Ashraf, M.A. (2022). Assessment of lead toxicity in diverse irrigation regimes and potential health implications of agriculturally grown crops in Pakistan. Agricultural Water Management, 271: 107743. https://doi.org/10.1016/j.agwat.2022.107743.
[57] Kacholi, D.S., Sahu, M. (2018). Levels and health risk assessment of heavy metals in soil, water, and vegetables of Dar es Salaam, Tanzania. Journal of Chemistry, 2018: 1402674. https://doi.org/10.1155/2018/1402674
[58] Okunola, O., Uzairu, A., Ndukwe, G. (2007). Levels of trace metals in soil and vegetation along major and minor roads in metropolitan city of Kaduna, Nigeria. African Journal of Biotechnology, 6(14): 1703-1709.
[59] Achi, M., Uzairu, A., Gimba, C., Okunola, O. (2011). Chemical fractionation of heavy metals in soils around the vicinity of automobile mechanic workshops in Kaduna Metropolis, Nigeria. Journal of Environmental Chemistry and Ecotoxicology, 3(7): 184-194. https://doi.org/10.5897/JECE.9000012
[60] Ogundele, D.T., Adio, A.A., Oludele, O.E. (2015). Heavy metal concentrations in plants and soil along heavy traffic roads in North Central Nigeria. Journal of Environmental & Analytical Toxicology, 5(6): 334. http://dx.doi.org/10.4172/2161-0525.1000334
[61] Ayers, R.S., Westcot, D.W. (1985). Water quality for agriculture. FAO irrigation and drainage paper no. 29 Rev. 1, Rome, 1985. Food and Agriculture Organization of the United Nations, Reprinted 1989, 1994. https://www.fao.org/3/t0234e/t0234e00.htm, accessed on Oct. 21, 2021.
[62] Gupta, N., Khan, D.K., Santra, S.C. (2008). An assessment of heavy metal contamination in vegetables grown in wastewater-irrigated areas of Titagarh, West Bengal, India. Bulletin of Environmental Contamination and Toxicology, 80: 115-118. https://doi.org/10.1007/s00128-007-9327-z
[63] Abd El-Mageed, T.A., Abdurrahman, H.A., Abd El-Mageed, S.A. (2020). Residual acidified biochar modulates growth, physiological responses, and water relations of maize (Zea mays) under heavy metal–contaminated irrigation water. Environmental Science and Pollution Research, 27: 22956-22966. https://doi.org/10.1007/s11356-020-08847-5
[64] Tarekegn, M.M., Weldekidan, G.L.L. (2022). Concentration levels of heavy metals and selected ions in the irrigation water: The case of little Akaki River, Addis Ababa, Ethiopia, Chapters, in: Saleh, H.M., Hassan, A.I. (eds), Environmental Impact and Remediation of Heavy Metals, IntechOpen. https://doi.org/10.5772/intechopen.103677
[65] Ngweme, G.N., Atibu, E.K., Alsalah, D., Muanamoki, P.M., Kiyombo, G.M., Mulaji, C.K., Otamonga, J.P., Pote, J.W. (2020). Heavy metal concentration in irrigation water, soil and dietary risk assessment of Amaranthus viridis grown in peri-urban areas in Kinshasa, Democratic Republic of the Congo. Watershed Ecology and the Environment, 2: 16-24. https://doi.org/10.1016/j.wsee.2020.07.001
[66] Ahmed, M., Matsumoto, M., Ozaki, A., Thinh, N., Kurosawa, K. (2019). Heavy metal contamination of irrigation water, soil, and vegetables and the difference between dry and wet seasons near a multi-industry zone in Bangladesh. Water, 11(3): 583. https://doi.org/10.3390/w11030583
[67] Sagagi, B.S., Bello, A.M., Danyaya, H.A. (2022). Assessment of accumulation of heavy metals in soil, irrigation water, and vegetative parts of lettuce and cabbage grown along Wawan Rafi, Jigawa State, Nigeria. Environmental Monitoring and Assessment, 194: 699. https://doi.org/10.1007/s10661-022-10360-w
[68] Abuzaid, A.S., Abdel-Salam, M.A., Ahmad, A.F., Fathy, H.A., Fadl, M.E., Scopa, A. (2022). Effect of marginal-quality irrigation on accumulation of some heavy metals (Mn, Pb, and Zn) in TypicTorripsamment soils and food crops. Sustainability, 14: 1067. https://doi.org/10.3390/su14031067
[69] Saleem, M.H., Afzal, J., Rizwan, M., Shah, Z., Depar, N., Usman, K. (2022). Chromium toxicity in plants: Consequences on growth, chromosomal behavior and mineral nutrient status. Turkish Journal of Agriculture and Forestry, 46(3): 371-389. https://doi.org/10.55730/1300-011X.3010
[70] Faouzi, J., Kaioua, S., Allali, A., Eloutassi, N., Lahkimi, A. (2022). Impact of irrigation water on heavy metal content in irrigated soils and plants – spatial and vertical distribution. Ecological Engineering & Environmental Technology, 23(5): 91-98. https://doi.org/10.12912/27197050/151759
[71] Arefin, M.T., Rahman, M.M., Wahid-U-Zzaman, M., Kim., J.E. (2016). Heavy metal contamination in surface water used for irrigation: Functional assessment of the Turag River in Bangladesh. Applied Biological Chemistry, 59(1): 83-90. https://doi.org/10.3839/jabc.2016.015
[72] Andresen, E., Peiter, E., Kupper, H. (2018). Trace metal metabolism in plants. Journal of Experimental Botany, 69(5): 909-954. https://doi.org/10.1093/jxb/erx465
[73] Alejandro, S., Holler, S., Meier, B., Peiter, E. (2020). Manganese in plants: From acquisition to subcellular allocation. Frontiers in Plant Science, 11: 300. https://doi.org/10.3389/fpls.2020.00300
[74] Maleki, A., Gharibi, F., Alimohammadi, M., Daraei, H., Daraei, H. (2014). Concentration levels of heavy metals in irrigation water and vegetables grown in peri-urban areas of Sanandaj, Iran. Journal of Advances in Environmental Health Research, 1(2): 81-88. https://doi.org/10.22102/jaehr.2013.40129
[75] McLaughlin, M.J., Singh, B.R. (1999). Cadmium in soils and plants. In Cadmium in Soils and Plants. Springer Dordrecht, Springer, pp. 1-9. https://doi.org/10.1007/978-94-011-4473-5
[76] Sutherland, R.A. (2000). Bed sediments associated trace elements in an urban stream, Oahu, Hawaii. Environmental Geology, 39: 611-627. https://doi.org/10.1007/s002540050473
[77] Withanachchi, S.S., Ghambashidze, G., Kunchulia, I., Urushadze, T., Ploeger, A. (2018). Water quality in surface water: A preliminary assessment of heavy metal contamination of the Mashavera River, Georgia. International Journal of Environmental Research and Public Health, 15(4): 621. https://doi.org/10.3390/ijerph15040621
[78] Liu, W., Zhao, J., Ouyang, Z., Soderlund, L., Liu, G. (2005). Impacts of sewage irrigation on heavy metal distribution and contamination in Beijing, China. Environment International, 31(6): 805-812. https://doi.org/10.1016/j.envint.2005.05.042
[79] Nour, H.E., Ramadan, F., Shammari, N.E., Tawfik, M. (2022). Status and contamination assessment of heavy metals pollution in coastal sediments, southern Kuwait. AIMS Environmental Science, 9(4): 538-552. https://doi.org/10.3934/environsci.2022032
[80] Swarnalatha, K., Letha, J., Ayoob, S., Nair, A.G. (2015). Risk assessment of heavy metal contamination in sediments of a tropical lake. Environmental Monitoring and Assessment, 187: 322. https://doi.org/10.1007/s10661-015-4558-7
[81] Devanesan, E., Gandhi, M.S., Selvapandiyan, M., Senthilkumar, G., Ravisankar, R. (2017). Heavy metal and potential ecological risk assessment in sediments collected from Poombuhar to Karaikal coast of Tamilnadu using Energy dispersive X-ray fluorescence (EDXRF) technique. Beni-Suef University Journal of Basic and Applied Sciences, 6(3): 285-292. https://doi.org/10.1016/j.bjbas.2017.04.011
[82] Sivakumar, S., Chandrasekaran, A., Balaji, G., Ravisankar, R. (2016). Assessment of heavy metal enrichment and the degree of contamination in coastal sediment from south east coast of Tamilnadu, India. Journal of Heavy Metal Toxicity and Diseases, 1(2): 11. https://doi.org/10.21767/2473-6457.100011