Md Abdullah Salman*![]() | Asiqul Haque
| Asiqul Haque![]() | Maksudur Rahman
| Maksudur Rahman![]() | Md Mostafa Jaman Rabby
| Md Mostafa Jaman Rabby![]() | Md Sabbir Hossen
| Md Sabbir Hossen![]() | Prince Halder
| Prince Halder![]() | Raian Islam Evan
| Raian Islam Evan![]()
© 2023 IIETA. This article is published by IIETA and is licensed under the CC BY 4.0 license (http://creativecommons.org/licenses/by/4.0/).
OPEN ACCESS
The rapid industrialization of cities poses significant challenges to sustainable development, particularly environmental degradation. The Sustainable Development Goals (SDGs) recognize the urgent need to address this issue in industrialized regions. A case study approach obtained valuable insights into Dhaka's green spaces and their implications for SDG 11 and 15. This study explores the decrease in green cover in Dhaka City attributed to unplanned industrialization and examines its relationship with the degradation of air quality during the period spanning from 1991 to 2021. The image classification procedure yielded overall accuracy rates ranging from 0.82 to 0.90. The findings reveal a significant decline of 16% in healthy vegetation and 8.98% in shrubs/grasslands, possibly due to a 34.7% increase in built-up/bare lands. AQI increased from 124 in 1996 to 172 in 2018 in Dhaka but decreased to 163 in 2021, probably due to the COVID-19 pandemic. Unplanned industrialization has led to reduced green cover and increased air pollution in the city. The study emphasizes the utility of NDVI (Normalized Difference Vegetation Index) measurements to address these challenges and achieve the SDGs. These measurements provide valuable information for decision-making and policy formulation, promoting the creation of green environments.
Dhaka, air pollution, green space, industrialization, urbanization, NDVI, Sustainable Development Goals (SDGs)
The migration of individuals from rural to urban areas, commonly referred to as urbanization, has been a widespread occurrence on a global scale for decades. This process has resulted in a number of negative effects, including the loss of urban green space and an increase in air pollution [1-3], as well as a number of positive effects. Urban inhabitants can reap various advantages from green spaces, such as parks, gardens, and forests, encompassing better air quality, reduced heat island effects, and augmented mental health and well-being [4]. Trees serve as a carbon sequestration mechanism by intercepting particulate matter and microscopic pollutants, thereby enhancing the deleterious impacts of climate change. The expansion of cities often results in the relinquishment of green spaces to accommodate new constructions and infrastructure, consequently causing a decrease in the standard of living for inhabitants of urban areas. The global urban region experienced a significant increase of 168% from 2001 to 2018, with the most notable growth rates observed in Asia and Africa [5]. The inhalation of air pollution has been linked to various health issues, such as respiratory and cardiovascular ailments, lung cancer, and stroke [6, 7]. In 2019, a thorough evaluation of the worldwide burden of diseases revealed that air pollution, originating from indoor and outdoor sources, constituted the fourth most significant risk factor for mortality and disease globally. This factor was responsible for 6.67 million deaths. Air pollution accounted for 12% of fatalities in children under 5 [8]. Outdoor air pollution is responsible for causing approximately 4.2 million untimely fatalities globally each year, with the most significant impact observed in countries with low- and middle-income economies [1, 4].
Bangladesh has been categorized as a lower-middle-income nation since 2015 and is one of the nations with the highest population density globally, with a populace exceeding 160 million individuals [9, 10]. In recent years, the nation has undergone a swift urbanization process, whereby the proportion of individuals residing in urban areas has increased from 17% in 1974 to 36% in 2018 [11]. This has resulted in the expansion of cities and villages, resulting in a decrease in green spaces. The Bangladesh Bureau of Statistics conducted a study that revealed that the country's forest cover decreased from 17% in 1975 to 10% in 2010 [12]. The depletion of green areas has had a noteworthy effect on both the ecosystem and the well-being of the populace, with the issue of air pollution emerging as a significant apprehension in urban areas [13, 14].
The city of Dhaka, located in Bangladesh, is widely recognized as a highly urbanized and heavily polluted city characterized by elevated levels of environmental pollution and a notable scarcity of green spaces [5]. Over the past two decades, Dhaka has undergone a warming trend of approximately 3 degrees Celsius, which can be attributed to various factors such as the depletion of green spaces and swift urbanization. This is noteworthy as the global community aims to limit the increase in global temperature to below 1.5 degrees Celsius [15]. UNEP has mandated that a sustainable urban area should possess a minimum of 25% open space, whereas Dhaka only possesses 8% of such spaces [16]. Urban green infrastructure, comprising vegetation such as trees and shrubs, provides many benefits to urban environments. These benefits include the provision of shade, regulation of wind speeds, the absorption of hot air to mitigate elevated urban temperatures, the preservation of soils, the facilitation of wastewater treatment, and the reduction of air pollution and associated health risks through sewage water for irrigation purposes.
The major contributors to air pollution in Dhaka are brick kilns (40%), vehicle emissions (30%), construction (20%), industry and open burning (10%) [17]. In the vicinity of Dhaka City, brick kilns emit a total of 23,000 tons of PM2.5 into the atmosphere on a yearly basis [18]. Exposure to the polluted air in Dhaka has resulted in the contraction of various respiratory illnesses such as infectious lung disease, pneumonia, acute respiratory infections, tuberculosis, and other related ailments. About two-thirds of Bangladesh's respiratory health problems and 10% of the country's total disease burden are attributable to air pollution [19].
This study aims to investigate the adverse effects of urbanization on green spaces and air quality in the context of global urbanization and potential measures to alleviate these issues, and ascertain the evolution of vegetation coverage in Dhaka City across different time periods. Besides, the vegetation coverage was quantified using Normalized Difference Vegetation Index (NDVI) analysis. Thus, the results of this analysis were subsequently examined in relation to the phenomena of rapid urbanization and degradation of Air Quality.
The Normalized Difference Vegetation Index (NDVI) is a tool that uses satellite data to measure the health of vegetation and track changes in land cover. NDVI is valuable for environmental monitoring and management. NDVI is used in various applications, including forest health monitoring, crop yield estimation, land cover change detection, and water quality monitoring [20]. NDVI assesses the condition of vegetation based on the difference between NIR (near-infrared) and R (visible red light) divided by the sum of these two band frequencies. Brief details of the following formula are mentioned in 3.3.2.
$N D V I=\frac{(N I R-R)}{(N I R+R)}$ (1)
where R = the red portion of the electromagnetic spectrum and NIR = the near-infrared portion of the electromagnetic spectrum.
The Landsat satellites capture images of the Earth's surface using a variety of sensors, including multispectral scanners and thermal infrared sensors. These sensors record data across various spectral bands, allowing scientists and researchers to analyze different aspects of the Earth's surface, such as land cover, vegetation health, urban development, and changes over time. The significance of the Landsat program lies in its long history of providing consistent and high-quality data that has become a cornerstone of remote sensing applications.
For Landsat 4 - 5 & Landsat 7 data, band 4 (NIR) and band 3 (Red) are used to measure the NDVI; for Landsat 8 & Landsat 9 data, band 5 (NIR) and band 4 (Red) are utilized. NDVI values vary from -1.0 to 1.0; values near -1.0 indicate the absence of vegetation, while values close to +1.0 indicate abundant vegetation. Table 1 shows a reference vegetation and land cover classification based on NDVI index values.
Table 1. Reference classification of land cover types based on NDVI values [21]
|
Different Land Areas |
NDVI Values |
NDVI Values (X) |
|
Water |
Negative Values |
X<0 |
|
Rocks/Sand/Snow |
Values Close to Zero |
-0.1<X<0.1 |
|
Greenery/Vegetation |
Low Positive Values |
0.1<X<0.4 |
|
Tropical Rain Forest |
Approaching to 1 |
X→1 |
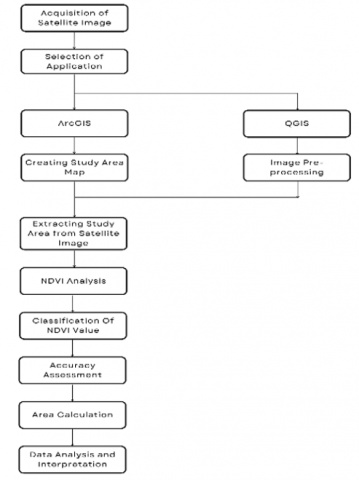
In this research, Landsat imagery from 1991 to 2021 with five year time intervals was used to conduct NDVI analysis. The data were prepared for further processing by performing specific preprocessing procedures. The following stage was extracting the area of interest from satellite images using the boundary shapefile of the study area. Afterward, an approach was made to conduct an NDVI analysis to classify the acquired data. The next step was to assess the accuracy of the expected data. Eventually, the area of the classified images was measured, and the findings were interpreted. The flowchart of our methodology is shown in Figure 1 below.
Figure 1. Methodological workflow of the study
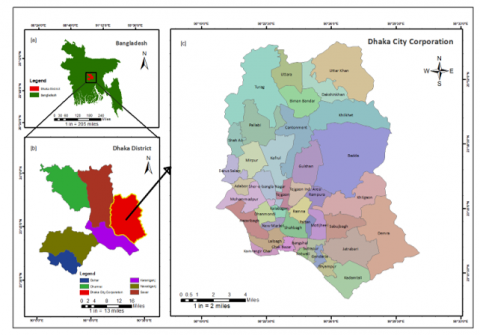
3.1 Study area
Figure 2. Study area map
Dhaka, located in the middle of Bangladesh, is one of the most polluted cities in the world [24]. It is located at 23°46'37" north and 90°23'58" east. The overall land area of the city of Dhaka is 306 square kilometers [25], and its population is 12.6 million [26]. As Dhaka is the commercial hub of Bangladesh, every year, half a million [27], individuals from all around Bangladesh relocate to Dhaka. The city has undergone massive urbanization and rapid development in response to the rising need for excessive populations. These enormous populations and the rural nature of the city augmented the transportation demand. Consequently, numerous new automobiles are added to the road each year, causing daily traffic congestion and CO2 emissions. The study area map has been shown in Figure 2.
3.2 Data source and collection
The NDVI analysis was used to quantify the quantity of healthy vegetation in the study area. This study required remote sensing satellite images. Several sources produce remotely sensed images of the earth's surface features. The Landsat data provided by the United States Geological Survey (USGS) was used for this research because it is publicly available and contains the oldest and most extensive collection of satellite images. All necessary data were retrieved from the USGS's official website.
3.2.1 Landsat data description
The Landsat imagery used in this study is listed with appropriate description in Table 2. Four types of sensor data were used, each with a spatial resolution of 30 meters. The Landsat TM sensor has 7 bands and captures visible and near-infrared light. The Landsat ETM+ sensor has 8 bands, including four visible and near-infrared (VNIR), two short wave infrared (SWIR), one thermal infrared (TIR), and one panchromatic (PAN) band. The Landsat OLI sensor has 11 bands, including visible, near-infrared, and shortwave infrared light. The Landsat TIRS sensor has 2 bands and captures thermal infrared radiation [28, 29].
Worldwide Reference System - 2 (WRS -2) [30] is used by Landsat 4, 5, 7, 8, and 9. All of our data was taken under cloud-free weather. All of the satellite data was recorded during the daytime. Except for the thermal and panchromatic bands, all the bands of Landsat data have spatial resolutions of 30 meters. The study area shapefile was produced by georeferencing.
Table 2. Description of USGS Landsat data used for conducting NDVI analysis
|
Landsat Data |
Sensor Type |
Date of Acquisition |
WRS Path |
WRS Row |
Red Band Wavelength (µm) |
NIR Band Wavelength (µm) |
Day/Night Indicator |
Cloud Cover (%) |
Resolution |
|
Landsat 4-5 |
TM |
12-Dec-1991 |
137 |
44 |
0.630-0.690 |
0.850-0.880 |
Day |
0 |
30 m |
|
Landsat 4-5 |
TM |
25-Dec-1996 |
137 |
44 |
0.630-0.690 |
0.850-0.880 |
Day |
0 |
30 m |
|
Landsat 7 |
ETM+ |
15-Dec-2001 |
137 |
44 |
0.630-0.690 |
0.850-0.880 |
Day |
0 |
30 m |
|
Landsat 7 |
ETM+ |
13-Dec-2006 |
137 |
44 |
0.630-0.690 |
0.850-0.880 |
Day |
0 |
30 m |
|
Landsat 7 |
ETM+ |
11-Dec-2011 |
137 |
44 |
0.630-0.690 |
0.850-0.880 |
Day |
0 |
30 m |
|
Landsat 8 |
OLI and TIRS |
16-Dec-2016 |
137 |
44 |
0.645-0.670 |
0.860-0.885 |
Day |
0 |
30 m |
|
Landsat 9 |
OLI and TIRS |
22-Dec-2021 |
137 |
44 |
0.645-0.670 |
0.860-0.885 |
Day |
0 |
30 m |
3.3 Data processing
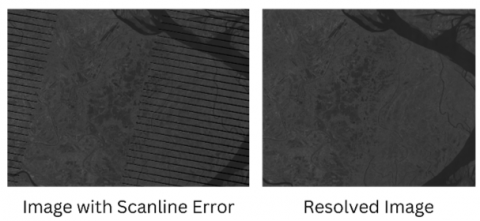
3.3.1 Image Pre-process
Figure 3. Resolving errors in data
After retrieving the data, an approach was made to verify data integrity. Certain scanline errors have been found for some data in this instance (Figure 3). These records contain L7 ETM+ (path 137, rows 44) of 2006 and 2011 (Table 2). Scanline errors in collected data can be resolved with the Fill nodaata (Raster>Analysis>Fill nodata) tool in QGIS, an open-source GIS application.
Every Landsat image has been projected to the Universal Transverse Mercator (UTM) Zone 46 North Geographic Coordinate System and georeferenced to the WGS 1984 datum.
3.3.2 NDVI Analysis of the study area
The raster data were imported into ESRI ArcGIS after preprocessing the satellite images (version 10.8.1). The software provides imagery tools and methods for visualization and analysis, as well as the world's largest imagery database, making it ideal for mapping and analyzing satellite imagery.
Red Band and Near Infrared Band (NIR) were employed for NDVI analysis. NIR and Red bands on various Landsats have different wavelengths mentioned in Table 1.
NDVI was calculated using the Float command in Raster Calculator for precision.
$N D V I=\frac{\text { Float }(N I R-R)}{\text { Float }(N I R+R)}$ (2)
Several classification methods are used to categorize NDVI values, including thresholding, maximum likelihood, random forest, KNN with DTW, and support vector machine. This study used the maximum likelihood classification method (Table 3). This method classifies pixels into different vegetation types: forest, grassland, and shrubland. The classifier uses the known distribution of NDVI values for different vegetation types to classify pixels [31].
Table 3. Suitable NDVI ranges utilized for the land cover classification in this study
|
Land Cover Types |
NDVI Value Range |
|
Water Body |
< -0.008 |
|
Built-up/Bare Land |
-0.008 to 0.10 |
|
Shrubs/Grassland |
0.11 to 0.20 |
|
Healthy Vegetation |
> 0.20 |
3.4 Accuracy assessment
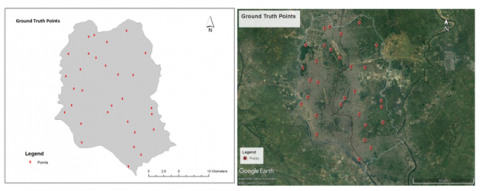
From 1991 to 2021, seven different years of data were considered at five-year intervals for NDVI analysis. For a more precise assessment of the accuracy of the data, it is typically preferable to survey a sample of randomly selected points by visiting the study area and analyzing each point. However, it can occasionally be costly, time-consuming, or even impossible to visit and inspect the randomly chosen points physically. To authenticate our data, we utilized high-resolution images of the real world provided by Google Earth Pro as ground-truthing reference data.
Ground-truthing was conducted in December for each year's Google Earth Pro imagery aligned with the respective Landsat images. However, ground-truthing was not possible for 1991 and 1996 due to the lack of clear reference images.
Figure 4. Ground truthing points of the study area
Accuracy improves with larger sample points. For accuracy assessment, a simple random sampling method was used to choose 30 random data points, where new points were selected for each year (Figure 4).
Parameters such as overall accuracy, user accuracy, producer accuracy, and kappa coefficient were determined for each year's data. The following formulae were used to calculate these parameters:
$\begin{gathered}\text { Overall Accuracy }= \\ \frac{\text { Total number of correctly classified pixels (diagonal) }}{\text { Total number of reference pixels }} \times 100\end{gathered}$ (3)
$\begin{gathered}\text { User's Accuracy }= \\\frac{\text { Number of correctly classified pixels in each category }}{\text { total number of classified pixels in that category (the row total) }} \times 100\end{gathered}$ (4)
$\begin{gathered}\text { User's Accuracy }= \\\frac{\text { Number of correctly classified pixels in each category }}{\text { total number of classified pixels in that category (the column total) }} \times 100\end{gathered}$ (5)
The Kappa coefficient [32] is a statistical method for assessing the accuracy of classifications. The bigger the kappa value, the stronger the connection between theoretical and actual data (Table 4). There may be a variety of kappa coefficient calculation formulae; nevertheless, the following equation was used to calculate the kappa coefficient:
$\begin{gathered}\text { Kappa Coefficient }= \\ \frac{(T S \times T C S)-\Sigma(\text { Column total } \times \text { Row total })}{T S^2-\Sigma(\text { Column Total }- \text { row total })} \times 100\end{gathered}$ (6)
Here,
TS = Total number of samples taken
TCS = Total number of correct samples
Table 4. Rating criteria for Kappa statistics [33]
|
Sl No. |
Kappa statistics |
Strength of agreement |
|
1 |
<0.00 |
Poor |
|
2 |
0.00 - 0.20 |
Slight |
|
3 |
0.21 - 0.40 |
Fair |
|
4 |
0.41 - 0.60 |
Moderate |
|
5 |
0.61 - 0.80 |
Substantial |
|
6 |
0.81 - 1.00 |
Almost perfect |
4.1 Overview of air quality of Dhaka City
Because of unplanned industrialization and an excessive number of automobiles, Dhaka's air quality continues to deteriorate. The most concentrated pollutant is PM2.5, which accounts for 73% of the city's air pollution. Other major pollutants in Dhaka include NO2 (10.4%), SO2 (6.5%), and CO (10%) [34]. It has been observed that emissions from almost all sorts of vehicles, including cars, jeeps, lorries, buses, minibusses, microbuses, two-stroke engine-powered vehicles, and motorcycles, have severely polluted the air in the city. In addition, train engines, industrial plants, brickfields, airplanes, power plants, dust particles, open-burning incineration, and solid waste disposal contribute to air pollution. Road excavations, construction, and other forms of urban growth generate dust pollution, contributing to Dhaka's air pollution. The high levels of air pollution in Dhaka have a number of negative impacts on public health, including respiratory problems, heart disease, and cancer [34]. Typically, the Air Quality in Dhaka begins to decline towards the end of October, with winter being the season most severely impacted by air pollution [35].
In Dhaka, the primary cause of air pollution is automobiles. Air pollution caused by transportation is increasing at an alarming pace. Rapid vehicle ownership growth in Dhaka necessitates immediate pollution control measures. As a result of exposure to pollutants from a vast number and diversity of motorized vehicles in the city, the residents of Dhaka suffer from various health issues. These motor vehicles emit the most particulate matter, hazardous, and smog-forming hydrocarbons. PM2.5 has been related to different cardiovascular and respiratory illnesses and cancer due to its ability to infiltrate alveolar structures, terminal.
4.2 Types of pollutants in Dhaka
According to studies by the World Health Organization [36], outdoor air pollution causes 4,2 million fatalities annually, with over 2 million occurring in Southeast Asia. Uncontrolled industrial growth and a chronic disregard for air quality regulations are clearly to blame for Dhaka's gradual rise to one of the world's most polluted cities. In a typical urban setting, around 200 air contaminants [37] are prominent. Most of these pollutants are detrimental and challenging to maintain a healthy and sustainable environment. Carbon monoxide (CO), Ozone (O3), Sulfur Dioxide (SO2), Nitrogen Dioxide (NO2), PM2.5, and PM10 are the most prevalent pollutants in Dhaka City, according to IQAir [13].
4.3 Need for green cover in Dhaka City
From the end of the last century, becoming a megacity, Dhaka started its course to shape itself into a gray city with only buildings, roads, people, and industries. The significant change in Dhaka's nighttime temperature shows that it has been changing at a rate of 0.22℃ per decade in the last fifty years, and the extreme events regarding climate have increased dramatically [38]. The absence of necessary green cover created tremendously adverse effects on air quality, ecosystems, human health, environmental sustainability, biodiversity, land surface temperature, social economy, demography, and the overall climate of the city.
Green vegetation, including trees and plants, is crucial in combating air pollution by absorbing harmful substances and emitting oxygen. Moreover, they can help alleviate the heat island effect in urban areas, thus enhancing environmental conditions. Additionally, the green cover offers various advantages, such as reducing air and noise pollution, increased food security and nutrition, improved environmental quality and cooling, provisioning for urban biodiversity species, pleasure from horticulture, enhancing attractiveness for tourism, promoting mental well-being, and enhancing the city's visual appeal. However, Dhaka City lacks sufficient greenery, resulting in a low tree-to-person ratio. Increasing green cover in Dhaka is imperative by planting more trees and establishing green space.
4.4 Recommended approaches to safeguard and improve green cover
Dhaka City is one of the world's most populated cities. The population growth of this city is escalating with each passing day. As a result of population growth and fast urbanization, green spaces are depleting, the ecosystem is suffering, and so are we. As determined by the NDVI study, Dhaka City had 167 square kilometers of green cover in 1991. However, this city lost 77 square kilometers of green cover in 2021, bringing the total to 90 square kilometers and continuing to decline. To combat this continual transition, preserving and enhancing the valuable green cover is essential. More urban greenery is aesthetically pleasing, and it also has the potential to enhance the quality of life for urban residents by reducing air pollution. Due to the scarcity of empty land in urban areas, we must use the remaining places to increase green cover. The Dhaka North City Corporation (DNCC) and the Dhaka South City Corporation (DSCC) have launched tree plantation drives to increase the green cover in the city by planting 200,000 and 100,000 trees, respectively, over the next two years [39]. Around 1500 mature trees were cut down for the metro rail project alone in Dhaka City [40].
Only around 2% of Dhaka City's over 4.5 million rooftops have greenery on them [41]. Raising public awareness and inspiring individuals to engage in rooftop agriculture and homestead gardening are other strategies for expanding the green space available to people. They can plant herbal, decorative, and economically valuable trees. Urban Agriculture (vertical gardening, vertical farming, etc.) is a further approach to expanding green space. Vertical farming and hydroponics are becoming more popular worldwide, and some countries that have implemented it include Japan, South Korea, China, the U.K., some Middle Eastern countries, Africa, Israel, and the Netherlands. Hydroponic vertical farming technology allows growers to cultivate crops in stacked plant spots within tower-like structures, providing crops with access to natural sunlight so they grow with less waste of land, water, and energy [42]. Although in the city of Dhaka, this practice is not yet prevalent. Individuals and commercials alike should utilize this approach more often. Consequently, it is expected that the green cover of Dhaka City will rise, and a portion of the food needs of urban dwellers will be met. Incorporating tree plantings into the development plan would be an alternative strategy. Whenever the government or private sector initiates a development project in an urban region such as Dhaka, it is astute for them to plant the tree species that absorb the maximum carbon dioxide. Large trees with dense wood, such as pines and conifers, hijol, and other indigenous tree species, such as Aphanamixis polystachya Wall. And Parker, locally known as Pitraj, absorbs much carbon dioxide. Hopefully, Dhaka City will acquire more greenery in the future if the aforementioned strategies are feasible to apply.
The study utilized NDVI analysis as the preferred method for vegetation assessment due to its specific design for quantifying vegetation quantity and health. This choice was made because the study aimed to investigate the dynamics of green cover and its correlation with air quality. This section will present the findings of the study, including the obtained outcomes, their accuracy, and the subsequent interpretation.
5.1 Green space scenario of Dhaka City from 1991-2021
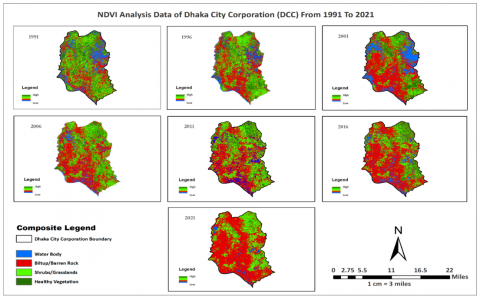
Dhaka has undergone a massive and rapid land cover change, especially in vegetation and built-up areas from 1991 to 2021. To understand this change, the area of each land cover for the studied year has been computed using NDVI analysis data. Table 5 reveals that Dhaka City had around 167 square kilometers of green space in 1991 but only 153 square kilometers in 1996, a roughly 14 square kilometers loss. In the next studied year, 2001, the City witnessed a significant loss of green space and retained merely 107 sq. km of green space. In contrast, it expanded significantly in 2006, adding green space totaling 139 square kilometers. In the subsequent year of study, 2011, the expansion was negligible, adding just 1 square kilometer. However, after 2011 data shows a gradual extenuation of green space where the city had about 111 sq. km and 90 sq. km in respective years in 2016 & 2021. Green space and urbanization dynamics over time can be observed in Table 5.
Additionally, the thematic land cover changes in the study area that occurred within the study period (from 1991 to 2021) are illustrated in Table 6.
The land cover changes from 1991 to 2021 for each year was illustrated through NDVI analysis in Figure 5.
Table 5. NDVI analysis of Dhaka City from 1991 - 2021 using average value range
|
Land Cover Type |
1991 |
1996 |
2001 |
2006 |
2011 |
2016 |
2021 |
|||||||
|
Area (sq km) |
% |
Area (sq km) |
% |
Area (sq km) |
% |
Area (sq km) |
% |
Area (sq km) |
% |
Area (sq km) |
% |
Area (sq km) |
% |
|
|
Water Body |
45 |
14.75% |
37 |
12% |
54 |
17.65% |
24 |
7.9% |
34 |
11.1% |
28 |
9.15% |
16 |
43.15% |
|
Built-up/Bare Land |
93 |
30.5% |
116 |
38.5% |
145 |
47.4% |
142 |
46.55% |
132 |
43.1% |
167 |
54.55% |
199 |
65.25% |
|
Shrubs/Grassland |
107 |
35.08% |
106 |
34.5% |
66 |
21.55% |
101 |
33.10% |
107 |
34.97% |
81 |
26.5% |
80 |
26.15% |
|
Healthy Vegetation |
60 |
19.67% |
47 |
15% |
41 |
13.4% |
38 |
12.45% |
33 |
10.78% |
30 |
9.8% |
10 |
3.27% |
Table 6. Resultant thematic change statistics “from-to” matrices (1991-2021)
|
1991 |
2021 |
Area Change (sq. km) |
Area Change (%) |
|
From Water Body |
To Water Body |
5.25 |
1.72 |
|
From Water Body |
To Built-up / Bare Land |
25.33 |
8.29 |
|
From Water Body |
To Shrubs / Grassland |
12.84 |
4.20 |
|
From Water Body |
To Healthy Vegetation |
1.36 |
0.45 |
|
From Built-up / Bare Land |
To Water Body |
4.56 |
1.49 |
|
From Built-up / Bare Land |
To Built-up / Bare Land |
66.18 |
21.66 |
|
From Built-up / Bare Land |
To Shrubs / Grassland |
19.93 |
6.52 |
|
From Built-up / Bare Land |
To Healthy Vegetation |
2.74 |
0.90 |
|
From Shrubs / Grassland |
To Water Body |
1.66 |
0.54 |
|
From Shrubs / Grassland |
To Built-up / Bare Land |
74.36 |
24.34 |
|
From Shrubs / Grassland |
To Shrubs / Grassland |
29.41 |
9.62 |
|
From Shrubs / Grassland |
To Healthy Vegetation |
2.28 |
0.75 |
|
From Healthy Vegetation |
To Water Body |
0.56 |
0.18 |
|
From Healthy Vegetation |
To Built-up / Bare Land |
30.35 |
9.93 |
|
From Healthy Vegetation |
To Shrubs / Grassland |
25.58 |
8.37 |
|
From Healthy Vegetation |
To Healthy Vegetation |
3.14 |
1.03 |
Figure 5. Composite image of NDVI analysis (1991 - 2021)
Table 7. Overall calculation of accuracy and Kappa coefficient
|
Year |
Parameters |
Waterbody |
Built Up |
Shrub |
Healthy |
|
2001 |
UA |
71.4 |
100 |
85.71 |
87.5 |
|
PA |
100 |
80 |
75 |
100 |
|
|
OA |
86.67 |
||||
|
Kappa |
0.82 |
||||
|
|
|
|
|||
|
2006 |
UA |
85.7 |
83.33 |
100 |
90 |
|
PA |
100 |
100 |
70 |
100 |
|
|
OA |
90 |
||||
|
Kappa |
0.86 |
||||
|
|
|
|
|||
|
2011 |
UA |
83.33 |
71.4 |
87.5 |
100 |
|
PA |
100 |
100 |
87.5 |
75 |
|
|
OA |
86.67 |
||||
|
Kappa |
0.81 |
||||
|
|
|
|
|||
|
2016 |
UA |
87.5 |
100 |
80 |
100 |
|
PA |
100 |
92.9 |
100 |
80 |
|
|
OA |
93.33 |
||||
|
Kappa |
0.90 |
||||
|
|
|
|
|||
|
2021 |
UA |
100 |
93.75 |
100 |
60 |
|
PA |
100 |
100 |
71.4 |
75 |
|
|
OA |
90 |
||||
|
Kappa |
0.85 |
||||
[Note: UA = User’s Accuracy; PA = Producer’s Accuracy; OA = Overall Accuracy]
5.2 Data accuracy analysis and interpretation
For data accuracy analysis, this study utilized the Error Matrix method, a statistical method for data accuracy assessment that uses users, producers, overall accuracy, and kappa coefficient [43].
User accuracy assesses the proportion of correctly classified instances within a predicted class, indicating errors of commission. Producer accuracy assesses the proportion of correctly predicted instances within the actual class, capturing errors of omission. The overall accuracy in the error matrix method is a metric that evaluates the correctness of instance classification across all classes. It quantifies the percentage of accurately classified instances from the total instances considered within the error matrix. The Kappa coefficient in the error matrix method measures the agreement between observed and predicted classifications, accounting for chance agreement [33].
The accuracy evaluation for 2001, 2006, 2011, 2016, and 2021 was performed using a high-resolution Google Earth Pro image. We were unable to determine accuracy for 1991 and 1996 because of a lack of quality imagery from Google Earth Pro for our study area prior to 2001.
In 2001, the average user and producer accuracy for classified images was 86.15% and 88.75%, respectively. In 2006, the average user and producer accuracy was around 89.75% and 92.5%, respectively. The average user accuracy in 2011 was 85.55%, and the producer accuracy was 90.62%. In contrast, the average user and producer accuracy in 2016 was 91.87% and 93.22%, respectively. Furthermore, in 2021, the average user accuracy was 88.43%, while the average producer accuracy was 86.6%.
The overall accuracy for 2001, 2006, 2011, 2016, and 2021 was 86.67%, 90.0%, 86.67%, 93.33%, and 90.0%, respectively. Kappa values were 0.82, 0.86, 0.82, 0.90, and 0.85 for 2001, 2006, 2011, 2016, and 2021, respectively. All data relating to accuracy assessment are presented in Table 7.
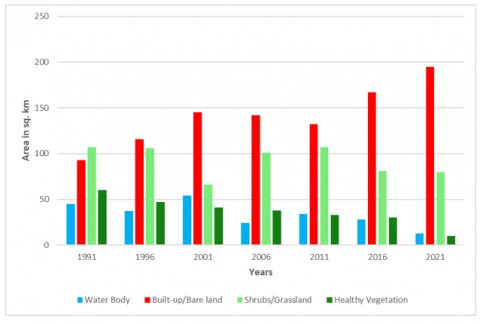
6.1 Comparative analysis of vegetation coverage
With the expansion of urban areas, the NDVI data (Table 5) indicate that vegetation coverage in the study area is decreasing. Seven years of NDVI data separated by five year intervals were analyzed. According to the NDVI data chart analysis, the vegetation coverage of the research area is at its peak in 1991 and its lowest in 2021. From 1991 through 2021, vegetation cover is decelerating. The most significant change in vegetation occurred between 2016 and 2021, with a value of 20 square kilometers in areas where urbanization accelerates the most.
On the other hand, in 2001 and 2006, there was a subtle change of only 3 square kilometers. The least urbanization was evident during this period. Therefore, there is an explicit relationship between urbanization and green cover.
This comparative analysis revealed that the study area had seen significant urbanization during the last decade, as shown by the construction of metro rail lines and elevated expressways, among other enormous development projects. As mentioned before, the construction of the metro train in Dhaka resulted in the loss of around 1,500 mature trees, a significant and disastrous consequence for a densely populated city.
The line graph (Figure 6) illustrates the relationship between vegetation areas and their change throughout the study years. The produced curve demonstrates that urban vegetation loss has accelerated during the last 15 years (2006-2021).
The accelerated industrialization and unplanned urbanization in Dhaka have substantially decreased vegetation areas. Rural residents migrate to the capital for social benefits, services, and professional possibilities, increasing housing demand and tree removal. If the current rate of vegetation loss in Dhaka continues, the green space will be in grave danger. Land use planning preserves green spaces, including zoning, urban expansion boundaries, and green infrastructure strategies. However, urban development pressures, inadequate funding, and limited public support highlight the need for effective strategies and community involvement to preserve and maintain these vital green spaces.
Figure 6. Land cover of Dhaka City from 1991 to 2021
6.2 Quantifying relation of NDVI data and air quality
The study was conducted to quantify the total land cover area of Dhaka City and its dynamics through a time series analysis of the past three decades. In addition, the research sought to establish a temporal correlation between vegetation dynamics and changes in the city's air quality. Figure 7 portrays the estimated NDVI study data, revealing a strong downward trend of healthy vegetation.
Figure 7. Trend of vegetation loss
A total of approximately 83.33% of Healthy Vegetation was lost within the studied time interval (Table 5). On the contrary, Built-up or Bare land shows a sharp augment of about 214%, which could be considered a crucial reason for the loss of Healthy Vegetation in Dhaka City. Approximately 46.11% of the observed loss in green space, comprising shrub/grassland and healthy vegetation, was identified.
Due to rapid Industrialization, the city's air started to receive various pollutants like PM2.5, PM10, BC (Black Carbon), etc.; this is the primary reason for the city's air pollution. Based on PM2.5, the air quality Index of Dhaka City was about 124 in 1996 [44], which was unhealthy for the sensitive group (Table 8). In 2002, 2006, 2009 [45], and 2018 [46], the Air Quality Index was about 158, 162, 164, and 172; this value is considered unhealthy air, according to IQAir (Table 8). An apparent degradation in air quality was observed from 1996 to 2018 (lower the AQI value, better the quality of air). On the other hand, there was a slight increase in air quality in the year 2021, and it became 163, which is thought to be the reason for less emission of pollutants from industries, factories, transportation, and other sources during the COVID-19 pandemic [47].
Therefore, it can be observed that the deterioration in the air quality and Land cover changes like loss of Healthy vegetation and drastic augmentation of Urbanization are highly correlated.
Table 8. Air quality index parameters and health recommendations [13]
|
Condition |
US AQI Level |
PM2.5 |
Health Recommendation (for 24-hour exposure) |
|
Good |
0-50 |
0-12.0 |
Air Quality is satisfactory and poses little or no risk |
|
Moderate |
51-100 |
12.1-35.4 |
Sensitive individuals should avoid outdoor activity as they may experience respiratory symptoms |
|
Unhealthy for Sensitive Groups |
101-150 |
35.5-55.4 |
General public and sensitive individuals, in particular, are at risk to experience irritation and respiratory problems. |
|
Unhealthy |
151-200 |
55.5-150.4 |
Increased likelihood of adverse effects and aggravation to the heart and lungs among the general public |
|
Very Unhealthy |
201-300 |
150.5-250.4 |
General public will be noticeably affected. Sensitive groups should restrict outdoor activities. |
|
Hazardous |
301+ |
250.5+ |
General Public at high risk of experiencing strong irritations and adverse health effects. Should avoid outdoor activities |
6.3 Sustainable ways of improving air quality
The rapid and unplanned urbanization of Dhaka City is the result of the country's economic boom, which has introduced a period of modernization, industrialization, and advancements in socioeconomic conditions. Consequently, the city has not satisfied the criterion for ambient air quality applicable to urban residential neighborhoods.
Rapid, long-term, reliable solutions implementation is needed to maintain sustainable air quality. First, the sources of air pollution and how they interact with the environment should be identified, followed by identifying their substitutes. If no alternatives are available, then actions should be taken to mitigate the negative consequences of pollutant emissions at their sources.
There are two significant causes [48] of air pollution in Dhaka: vehicular emissions and industrial pollutants. Vehicles are necessary for mobility, yet public transit is more effective than private transportation. However, a recent study by the Bangladesh Road Transport Authority (BRTA) shows that fewer than 3% of registered vehicles are mass transit vehicles, while motorcycles and private automobiles account for over 70% of registered vehicles. Consequently, more private automobiles and motorbikes create more significant air pollution. In addition, air quality may be improved by lowering emissions from motor vehicles by switching diesel/petrol cars to CNG, a program that the government of Bangladesh has already undertaken. As far as industrial pollution is concerned, decentralization is a more efficient way to minimize air pollution in Dhaka [49]. However, there are also attempts to minimize emissions from brick kilns by implementing eco-friendly, cleaner, and more energy-efficient technologies for brick manufacture.
Lastly, increasing vegetation cover is necessary to improve the overall air quality. Therefore, one of the essential solutions would be to plan extensive greenery in the form of parks, gardens, and forests with particular plant species to contribute to the clean air supply. Trees filter the air in cities and can absorb carbon dioxide from the atmosphere. Forests and grasses filter the air by absorbing noxious gases and collecting dust and debris that would otherwise linger in the environment [50].
The surface area of city rooftops ranges from 21 to 26 per cent [51]; thus, if they can be turned green, they will effectively improve air quality. Adding more plants is one of the most effective ways to lessen the effects of excessive air pollution. Considering Dhaka's current air quality condition, the city must implement more green initiatives to enhance air quality. For an acceptable AQI, intensive vegetation cover in the form of Urban forests and proper selection of tree species able to contribute to fresh air supply is the best alternative. The urgent requirement is to push for more greenery and better quality plants to help with these problems.
This research has comprehensively analyzed the temporal change of vegetation and its impact on air quality in Dhaka City. The findings clearly indicate that the city has experienced a significant loss of green space over the past three decades due to population growth, urbanization, and increased housing demand. As a result, Dhaka's air quality has deteriorated considerably, with industrial emissions, vehicular traffic, and construction activities contributing to increased pollution levels. The decline in vegetation has further exacerbated this issue, as fewer trees and plants are available to absorb air pollutants and release oxygen. The ecological balance has been disrupted, leading to the city's displacement and endangerment of various species.
The long-term effects of vegetation loss, rapid urbanization, and air quality degradation are extensive and multifaceted. The disruption of ecosystems and reduction in biodiversity have created ecological imbalances that require urgent attention. The intensification of industrial activities and vehicle emissions has increased health risks for urban residents, resulting in escalating healthcare costs and burdening healthcare systems. Additionally, the heat island effect and energy consumption for cooling purposes strain the power grid and contribute to rising electricity production and distribution costs. The challenges of water management, including reduced rainwater absorption and increased flooding risks, further compound the issues faced by Dhaka City. Moreover, social and economic disparities are exacerbated, impacting marginalized communities disproportionately.
To address these challenges and work towards a more sustainable future, it is imperative to implement comprehensive strategies. These strategies should encompass sustainable urban planning, preservation of green spaces, air pollution control measures, and improved water management practices. Transitioning to renewable energy sources can positively impact air quality, and the government should provide incentives and support for the adoption of solar, wind, and other renewable technologies. Waste management initiatives, including segregation, recycling, and composting, coupled with investments in waste treatment facilities, can contribute to a cleaner environment. Integrating green spaces, parks, and urban forests into city planning can help mitigate air pollution and enhance overall air quality. The preservation and creation of green areas should be prioritized, including innovative approaches such as rooftop gardens, vertical green walls, and urban parks.
Similar challenges faced by other cities, such as Lahore, Hotan, New Delhi, and Kathmandu, emphasize the need for a collaborative approach in addressing air pollution and green space decline. By striking a balance between urban development and the preservation of open spaces, cities can pave the way for a healthier and more sustainable urban environment.
The findings of this study present a clear call to action for stakeholders, policymakers, and the community at large to prioritize sustainable development goals and work towards a greener, cleaner, and more resilient Dhaka City. By implementing the recommended approaches outlined in this paper, we can contribute to a better quality of life for present and future generations, fostering a city that thrives both economically and environmentally.
The authors declare that they have no known competing financial interests or personal relationships that could have appeared to influence the work reported in this paper.
[1] IvyPanda. (2018). Advantages and disadvantages of urbanization. https://ivypanda.com/essays/urbanization-advantages-and-disadvantages/.
[2] National Geographic. (n.d.). Urban threats. https://www.nationalgeographic.com/environment/article/urban-threats.
[3] Salman, M.A., Ahmed, F. (2020). Climatology in Barishal, Bangladesh: a historical analysis of temperature, rainfall, wind speed and relative humidity data. Malaysian Journal of Geosciences, 4, 43-53. http://dx.doi.org/10.26480/mjg.01.2020.43.53
[4] Semeraro, T., Scarano, A., Buccolieri, R., Santino, A., Aarrevaara, E. (2021). Planning of urban green spaces: An ecological perspective on human benefits. Land, 10(2): 105. https://doi.org/10.3390/land10020105
[5] Dewan, A., Kiselev, G., Botje, D., Mahmud, G.I., Bhuian, M.H., Hassan, Q.K. (2021). Surface urban heat island intensity in five major cities of Bangladesh: Patterns, drivers and trends. Sustainable Cities and Society, 71, 102926. https://doi.org/10.1016/J.SCS.2021.102926
[6] Cohen, J.E. (2004). Urbanization: An environmental force to be reckoned with. Population Reference Bureau. https://www.prb.org/resources/urbanization-an-environmental-force-to-be-reckoned-with/.
[7] Conserve Energy Future. (2016). Causes, effects and solutions to urbanization leading to urban growth. https://www.conserve-energy-future.com/causes-effects-solutions-urbanization.php.
[8] Lim, S.S., et al. (2019). A comparative risk assessment of burden of disease and injury attributable to 67 risk factors and risk factor clusters in 21 regions and territories, 1990-2010: a systematic analysis for the Global Burden of Diseases Study 2010. Lancet. https://doi.org/10.1016/S0140-6736(12)61766-8
[9] Worldometer. (2021). Bangladesh Population. https://www.worldometers.info/world-population/bangladesh-population/.
[10] Worldometer. (2023). Bangladesh Population. https://www.worldometers.info/world-population/bangladesh-population/.
[11] The World Bank. (n.d.). Urban Population (% of Total Population) - Bangladesh. https://data.worldbank.org/indicator/SP.URB.TOTL.IN.ZS?locations=BD.
[12] Bangladesh Bureau of Statistics. (2010). Forest cover in Bangladesh. https://bforest.portal.gov.bd/sites/default/files/files/bforest.portal.gov.bd/notices/c3379d22_ee62_4dec_9e29_75171074d885/4.%20Forest%20resources_NCS.pdf
[13] Rahman, S.A., Islam, M.M., Salman, M.A., Rafiq, M.R. (2022). Evaluating bank erosion and identifying possible anthropogenic causative factors of Kirtankhola River in Barishal, Bangladesh: an integrated GIS and Remote Sensing approaches. International Journal of Engineering and Geosciences, 7(2), 179-190. http://dx.doi.org/10.26833/ijeg.947493
[14] IQAir. (2020). World air quality report 2020. https://www.iqair.com/world-most-polluted-cities/world-air-quality-report-2020-en.pdf.
[15] Molla, M.A.M. (2021). Dhaka’s temperature went up 3 degrees Celsius in the last 20 years | undefined. https://www.thedailystar.net/frontpage/news/dhaka-hotter-20-years-2079657
[16] Islam, M., Mahmud, A., Islam, S.M.D. (2015). Open space management of Dhaka city, Bangladesh: A case study on parks and playgrounds. International Research Journal of Environment Sciences, 4(12), 118-126. https://www.academia.edu/download/42911075/15.ISCA-IRJEVS-2015-238.pdf
[17] Motalib, M.A., Lasco, R.D. (2015). Assessing air quality in Dhaka City. International Journal of Science and Research (IJSR), 4, 1908-1912. https://doi.org/10.21275/v4i12.sub159291
[18] Muhib, M.I., Khan, M.S.A. (2022). An overview of health and environmental threats from the brick kiln industry around the capital of Bangladesh. American International Journal of Sciences and Engineering Research, 5(1): 16-22. https://doi.org/10.46545/aijser.v5i1.259
[19] World Bank. (2006). Bangladesh country environmental analysis. Washington, DC: World Bank. https://documents.worldbank.org/curated/en/832631468208781209/pdf/404200BD0Ctry010also03694501PUBLIC1.pdf.
[20] CropIn. (2021). NDVI- normalized difference vegetation index. https://www.cropin.com/blogs/ndvi-normalized-difference-vegetation-index, aceessed on Jun. 11. 2023.
[21] Ya'acob, N., Azize, A.B.M., Mahmon, N.A., Yusof, A.L., Azmi, N.F., Mustafa, N. (2014). Temporal forest change detection and forest health assessment using Remote Sensing. In IOP Conference Series: Earth and Environmental Science, 19(1): 012017. IOP Publishing. http://dx.doi.org/10.1088/1755-1315/19/1/012017
[22] Mandal, R., Dutta, G. (2020). From photosynthesis to biosensing: Chlorophyll proves to be a versatile molecule. Sensors International, 1: 100058. https://doi.org/10.1016/j.sintl.2020.100058
[23] LP DAAC. (2018). Workflow examples vegetation. https://lpdaac.usgs.gov/data/get-started-data/workflow-examples/, accessed on June 11, 2023.
[24] World Air Quality Index (AQI) Ranking | IQAir. (n.d.). https://www.iqair.com/world-air-quality-ranking, accessed on Oct. 16, 2022
[25] Goward, S.N., Xue, Y., Czajkowski, K.P. (2002). Evaluating land surface moisture conditions from the remotely sensed temperature/vegetation index measurements: An exploration with the simplified simple biosphere model. Remote Sensing of Environment, 79(2–3): 225-242. https://doi.org/10.1016/S0034-4257(01)00275-9
[26] United Nations. (2018). World urbanization prospects: The 2018 revision. https://population.un.org/wup/Publications/Files/WUP2018-Report.pdf
[27] Migration to Dhaka | The Daily Star. (n.d.). https://www.thedailystar.net/news-detail-106930, accessed on Oct. 16, 2022.
[28] Salman, M.A., Nomaan, S., Sayed, S., Saha, A., Rafiq, M.R. (2021). Land use and land cover change detection by using remote sensing and gis technology in Barishal District, Bangladesh. Earth Sci Malaysia, 5(1): 33-40. http://dx.doi.org/10.26480/esmy.01.2021.33.40
[29] U.S. Geological Survey. (n.d.). What are the band designations for the Landsat satellites? [FAQ]. https://www.usgs.gov/faqs/what-are-band-designations-landsat-satellites, accessed on Jun. 10, 2023.
[30] WRS | USGS. https://www.usgs.gov/faqs/what-worldwide-reference-system-wrs, accessed on Oct. 16, 2022.
[31] Mustapha, M.R., Lim, H.S., Mat Jafri, M.Z. (2010). Comparison of neural network and maximum Likelihood approaches in image classification. Journal of Applied Sciences, 10: 2847-2854. https://doi.org/10.3923/jas.2010.2847.2854
[32] Nawar, N., Sorker, R., Chowdhury, F.J., Mostafizur Rahman, M. (2022). Present status and historical changes of urban green space in Dhaka city, Bangladesh: A remote sensing driven approach. Environmental Challenges, 6: 100425. https://doi.org/10.1016/J.ENVC.2021.100425
[33] Rwanga, S.S., Ndambuki, J.M., Rwanga, S.S., Ndambuki, J.M. (2017). Accuracy assessment of land use/land cover classification using remote sensing and GIS. International Journal of Geosciences, 8(4): 611–622. https://doi.org/10.4236/IJG.2017.84033
[34] Rahman, M.M., Mahamud, S., Thurston, G.D. (2019) Recent spatial gradients and time trends in Dhaka, Bangladesh, air pollution and their human health implications, Journal of the Air & Waste Management Association, 69(4): 478-501, https://doi.org/10.1080/10962247.2018.1548388
[35] AQI.in. (n.d.). Dhaka Air Quality Index (AQI) and Bangladesh Air Pollution | AirVisual. https://www.aqi.in/us/dashboard/bangladesh/dhaka, accessed on Jun. 10, 2023.
[36] Air pollution, WHO. (n.d. er 16) 2022, https://www.who.int/health-topics/air-pollution#tab=tab_1
[37] Alam, M.Z., Armin, E., Haque, Md. M., Halsey, J., Qayum, Md. A. (2018). Air pollutants and their possible health effects at different locations in Dhaka city. Journal of Current Chemical and Pharmaceutical Sciences, 8(1). https://doi.org/10.21767/2277-2871.1000111
[38] Shourav, S. Mohsenipour, M., Alamgir, M. Hadipour, S., Ismail, T. (2016). Historical trends and future projection of climate at Dhaka city of Bangladesh. https://dx.doi.org/10.13140/RG.2.1.2236.8880
[39] Dhaka Tribune. (2023). Morning brief. https://www.dhakatribune.com/bangladesh/2023/03/24/morning-brief-228
[40] The Business Standard. (2020). Saplings galore, yet no tree in sight. https://www.tbsnews.net/feature/panorama/saplings-galore-yet-no-tree-sight-162784
[41] The Green Savers. (n.d.). https://www.thegreensavers.org/
[42] Chatterjee, A., Debnath, S., Pal, H. (2020). Implication of urban agriculture and vertical farming for future sustainability. In Urban horticulture-Necessity of the future. IntechOpen. https://www.doi.org/10.5772/intechopen.91133
[43] Nagamani, K., Jayakumar, K., Suresh, Y., Sriganesh, J. (2015). Study on error matrix analysis of classified remote sensed data for pondicherry coast. Journal of Advanced Research, 2: 3-4 https://scholar.google.com/scholar?oi=bibs&cluster=2115908368919355112&btnI=1&hl=en.
[44] Begum, B.A., Hopke, P.K. (2018). Ambient air quality in Dhaka Bangladesh over two decades: Impacts of policy on air quality. Aerosol and Air Quality Research, 18(7): 1910–1920. https://doi.org/10.4209/AAQR.2017.11.0465
[45] AQI Data, CASE, DoE., http://case.doe.gov.bd/index.php?option=com_wrapper&view=wrapper&Itemid=12, accessed on Oct. 18, 2022.
[46] AQI Dhaka | IQAir. https://www.iqair.com/bangladesh/dhaka, accessed on Oct. 18, 2022.
[47] Saha, R., Hoque, S.N.M.A., Manu, M.M.R., Hoque, A. (2021). Monitoring air quality of Dhaka using IoT: effects of COVID-19. International Conference on Robotics, Electrical and Signal Processing Techniques, 715-721. https://doi.org/10.1109/ICREST51555.2021.9331026
[48] Islam, Md. S. (2014). Air pollution in Dhaka City: A burning issue. Journal of Science Foundation, 12(2): 20–21. https://doi.org/10.3329/JSF.V12I2.27732
[49] Begum, B.A., Biswas, S.K., Hopke, P.K. (2011). Key issues in controlling air pollutants in Dhaka, Bangladesh. Atmospheric Environment, 45(40): 7705-7713. https://doi.org/10.1016/J.ATMOSENV.2010.10.022
[50] Leung, D.Y.C., Tsui, J.K.Y., Chen, F., Wing-Kin, Y., Vrijmoed, L.L.P., Chun-Ho, L. (2011). Effects of urban vegetation on urban air quality. Landscape Research, 36(2): 173-188. https://doi.org/10.1080/01426397.2010.547570
[51] Urban expansion in Dhaka and its heat island effect. (2021). https://www.tbsnews.net/thoughts/urban-expansion-dhaka-and-its-heat-island-effect-292240.