Bah Ntutuwouo Gael Didier* | Betare Nam-Yona-Gunte | Chop Leonard Nkimih | Kengne Tanguebou Josiane | Eselacha Brice | Odi Nke Régine Sylvie | Abena Ndongo Hervé
© 2022 IIETA. This article is published by IIETA and is licensed under the CC BY 4.0 license (http://creativecommons.org/licenses/by/4.0/).
OPEN ACCESS
This work consisted in evaluating the vulnerability of groundwater to pollutants coming from the surface. This evaluation is done using the parametric method of SINTACS based on seven physiographic and hydrogeological parameters obtained from remote sensing data (DTM) and exogenous data (lithological, soil, rainfall, hydrogeological). The results obtained reflect the risk of pollution of water resources by various sources (urban, industrial and agricultural). Particularly in agricultural areas responsible for water pollution by nitrates and in urban centers where water pollution by faecal contamination is felt. A mapping of intrinsic vulnerability and specific vulnerability reveals with regard to specific vulnerability to faecal pollution with E-coli as a bio-indicator, that 51.78% of the area has an average specific vulnerability to faecal pollution, 30.24% a low vulnerability and 17.99% has a very low character to faecal pollution. Regarding agricultural pollution, the chemical indicator used is nitrate. The analyzes show that 8.37% of the area has a high specific vulnerability to agricultural pollution, 12.37% an average vulnerability and the rest a low or very low vulnerability.
vulnerability, pollution, SINTACS method, groundwater, mapping
While water will become scarce, due to climate variability the demand for this vital resource will explode due to population growth, economic development and changing consumption patterns. Global water demand is expected to increase by 20 to 30 % compared to the current level by 2050, note UN-Water and Unesco in their annual report on water in 2019. Today groundwater remains the primary source of potable water supply across the world in development shipments and in Africa in particular [1].
In order to preserve these water reservoirs, various approaches for analyzing and evaluating the vulnerability of the aquifer to pollutants of various origins, among other statistical approaches, weighting approaches and methods based on indices [2] have been developed and implemented around the world. This made it possible to better understand the risks incurred by groundwater in order to initiate effective management plans. In Algeria, studies on aquifers show that 60 % of the aquifer has a high vulnerability to pollutants coming from the ground surface [3]. In India [4] worked on the vulnerability of the aquifer in western India, it results that the aquifer has high specific vulnerability to nitrate pollution. To name just these among several other studies.
These aquifer vulnerability studies are becoming more and more urgent with the pressure exerted by the waste or effluent generated by various activities of anthropogenic origin [5, 6]. This is potentially the cause of the chemical and bacteriological pollution already observed in certain underground resources throughout the world [7].
For this work, the vulnerability assessment method is that of SINTACS where all the parameters were modeled according to the scores and weight allocated to each parameter, after superimposing the seven parameters, we were able to obtain an intrinsic vulnerability map of the area of study. Once the data on faecal pollution with E-coli as a bio-indicator and those of agricultural pollution with nitrate as a chemical indicator have been obtained for each well and then interpolated, these are superimposed on the intrinsic vulnerability map to obtain specific vulnerability maps.
This study will make it possible to understand the level of vulnerability to pollution that weighs on groundwater in the city of Bafoussam in order to contribute to effectively combating water pollution and water stress in the face of an increasingly increasing demand.
2.1 Location of the study area
The study area is located in an urban environment in West Cameroon in the Mifi and Koung-khi division. This study area overlaps four sub-divisions: It is limited to the West by Bafoussam I, to the North by Bafoussam II, to the East by Bafoussam III and to the South by Bandjoun and it is located at the North longitude of coordinate 5°32′ and East latitude with coordinate 10°33′, the altitude of the cumulating point is located at 1560 meters. From a general point of view, the relief in the study area is rugged with relatively variable altitude values in places. The sub-division of Bafoussam 1st and Bandjoun has high altitude values with hills cumulating in between 1455 m and 1659 m. In the sub-division of Bafoussam 1nd and Bafoussam 3rd the relief is largely dominated by high plateaus and valleys with high variable altitude values. The climate in the Sub-Division is of the Cameroonian type characterized by two seasons: a rainy season and a dry season. The effects of climate variability have made it no longer easy for several decades to know precisely when each season will start or when it will end. Rainfall annual average is between 330 and 340 mm and average temperatures are between 20 and 25℃.
Figure 1. Location of study area
Our study area is heavily irrigated by several sub-watersheds and two main watersheds, namely: The Metche watershed in the northern part and the Mifi watershed in the western part (Figure 1).
2.2 SINTACS method
In order to assess the vulnerability of groundwater to pollutants coming from the surface in our study area, we used the SINTACS method developed by Mba et al. [8, 9]. This method consists of first determining the various SINTACS acronyms: Depth of the water table (S), Effective infiltration (I), Unsaturated zone (N), Soil environment (T), Aquifer environment (A), hydraulic conductivity (C), Slope or topographic (S). Then superimpose them while associating each parameter with its weight and finally distribute the intrinsic and specific vulnerability maps [10].
2.2.1 Water table depth (S)
The depths of the aquifer in the study area were obtained by limnometric monitoring carried out in the 15 wells sampled and spatially distributed in the study area. To carry out this study, we carried out a total of ten campaigns, so six campaigns were carried out at the start and end of the three months (July, August and September) of high rainfall and the other four campaigns at the start and end of the rainy seasons. two months (February and March) of severe dry seasons in Western Cameroon. At each observation point, we measured the depths of the wells and the static water level in these various wells using a decameter equipped with an electric probe at the end and a GPS. This limnometric monitoring also allowed the analysis of the piezometry of the aquifer in this zone.
2.2.2 Effective seepage (I)
Obtaining local meteorological data was obtained from the meteorological service of Bafoussam and from the IRAD (Institute for Research and Development) of Dschang. From these data, using the approach of Akenji et al. [9], the annual groundwater recharge was estimated using the equation
$P I=\left[\frac{(-15,05)^2}{P}+22,57\right]$ (1)
where, PI is the percolation index and P is annual precipitation. The determination of the amount of infiltrated water is done by the simplified groundwater recharge equation: I=P-(E+r), where I is net infiltration, E is evapotranspiration and R is total amount of runoff water.
2.2.3 Unsaturated zone (N)
Within the framework of this study, the determination of the nature of the unsaturated zone was taken into consideration. It is believed that this zone makes it possible to assess the migration of potential pollutants to the water table. To determine the structure of the unsaturated zone it was necessary to collect soil samples directly above the static groundwater level. Once these samples were obtained for each of the wells, we were able to characterize the different types of soil. To have an overview of the structure of the unsaturated zone, we proceeded by interpolation and reclassification in ArcGis according to the notation of Civita and De Regibus (1995), assigning each structure a corresponding score.
2.2.4 Middle of the ground (T)
The data used were exported from the soil map of Cameroon using the ''extract by mask'' tool of the ArcGis arctoolbox software package. The study area could be extracted from that of Cameroon and then reclassified according to the parameters from SINTACS.
2.2.5 Hydraulic conductivity zone (C)
The soil permeability was obtained by the Porchet [11] where analyzes were carried out during the six (06) field campaigns that were carried out and the results are obtained after introduction into the equation of the soil permeability:
$K=\frac{r \times h}{t \times\left(2 h^{\prime}+r\right)}$ (2)
where r is radius of the hole (in mm) h' is height of the layer of percolated water (in mm), t is elapsed time (in hours), h is height of the water column (initial value in mm).
2.2.6 Aquifer medium (A)
To assess the characteristics of the aquifer environment, we simply referred to the geological data of Western Cameroon from the Research and Development Institute (RDI) where we extracted our area of interest and by reclassifying the data according to [12] notations.
2.2.7 Slope or topography (S)
The Parameterization of data relating to the physical environment such as data on the morphology of the ground (slope) and the ground cover which were obtained from a Digital Terrain Model (DTM) of the area obtained on the website www.USGS.com (United States Geological Survey) as well as the Institute for Research and Development (IRD) geodatabase for aquifer geology data.
2.2.8 SINTACS intrinsic vulnerability index (SIVI)
The seven parameters themselves are not considered equally important in the vulnerability assessment. In order to reflect the relative importance of these parameters, weightings on a scale of 1 to 5 are assigned to each of these parameters [12]. The SINTACS Intrinsic Vulnerability Index (SIVI) is calculated using the following equation:
$S I V I=\sum_{i=1}^7 P i \times W i$ (3)
where Pi is the score of each of the seven parameters that the method considers and Wi is the relative weight. The index is useful at the regional scale to prioritize areas of high, moderate, low and very low vulnerability [13].
2.2.9 SINTACS specific vulnerability index (SSVI)
In order to assess the specific vulnerability, the model must be modified by involving an additional parameter reflecting the anthropogenic impact. The choice of additional parameter depends on the type of contamination for which the specific vulnerability assessment is to be performed. For studies involving nitrate as a contaminant [14, 15], land use is taken as a surrogate parameter. The land use parameter is further subdivided into ranges or zones as agriculture, settlement or habitation, wastelands and water bodies. Then, these beaches are given different ratings based on the potential for nitrate contamination from different sources. This additional parameter is linearly and additively combined with the SINTACS vulnerability index to calculate the specific SINTACS vulnerability index. The SINTACS Specific Vulnerability Index (SSVI) is calculated using the following equation:
SSVI $=S I V I+A I r \times A I w$ (4)
where AI is the anthropogenic parameter and the indices “r” and “w” indicate the corresponding rating and weight respectively. The equation established by the Ministry of Agriculture, Fisheries and Food of Quebec [16]. made it possible to convert specific vulnerability indices into percentages in order to better understand the classification of degrees of vulnerability.
$I_{S N V} \%=\frac{I_{S N i V}-I_{N V S \min }}{I_{S N V} \max -I_{S N V \min }} \times 100$ (5)
where,
ISNV = specific nitrate vulnerability index
ISNiV = specific nitrate vulnerability index
The area has a high vulnerability index, indicating that it is more vulnerable to groundwater contamination than areas with a lower index value. The range of vulnerability indices is divided into zones of very low, low, moderate and high vulnerability.
2.3 Data processing
The data once collected are entered into a spreadsheet (MS-Excel 2013) for the calculation of the arithmetic mean of the values obtained on the different field campaigns by SINTACS parameter. The values obtained will be classified according to the empirical model of the study [17], until intrinsic vulnerability is obtained and then specific vulnerabilities of anthropic origin (contamination with faecal matter and nitrate) coming from the surface. After processing the parameters of the acronym SINTACS in the spreadsheet, the results obtained will be introduced into a GIS software in occurrence ArcGis10.5 for the attribution of the notes and the respective weights of each parameter before making an overlay to obtain the vulnerability maps.
The vulnerability assessment by the SINTICS method takes into account seven (07) as previously presented, the combination of these parameters of which will allow us to produce a map of the intrinsic vulnerability of the groundwater table to pollutants coming from the surface of the earth. In downtown Bafoussam and by extension the specific vulnerabilities resulting from anthropogenic activities, in particular the pollution with faecal matter from the toilets with lost pits which constitute the most used individual sanitation works in the area. We also dwelt on the nitrate contamination from the plantations on the slopes, therefore the risk of Persian pollution on the downstream wells.
3.1 Analysis of SINTACS parameters
3.1.1 Water table depth (S)
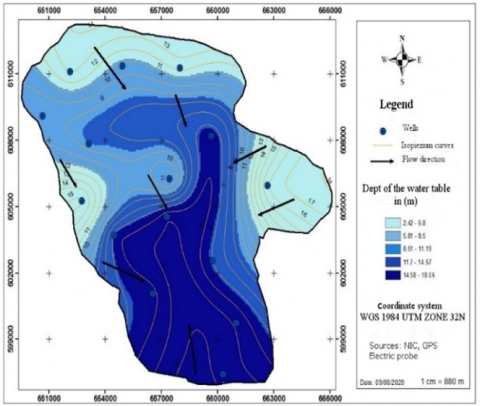
The depth of the water table in our study area varies from 2.42 to 18.06 m. according to field observations, shallow aquifers are obtained in the lowlands (Figure 2).
Figure 2. Depth of water table
In the north, east and part of the west of the study area, relatively low groundwater depths are obtained, varying between 2.42 m to 5.8 m for the lowest and 5.81 m to 8.5 m. For shallow depths.
The water flow direction indicates that the groundwater confluence zone is located in the northern part of the study area with a water table depth varying from 14.54 m to 18.05 m.
3.1.2 Effective infiltration (I)
Which is the ability of the soil to be crossed by water that arrives at the surface of the soil. Figure 3 shows that the soils of the western part of the study area have strong potential to be crossed by water coming from the surface with infiltration rates varying from 236 to 365 mm for the most permeable and 90 mm to 110 mm for low permeability present in the North and South part of the zone with a value of 90 mm to 110 mm for low permeability present in the North and South part of the study area.
Figure 3. Rainfall infiltration
It is important to remember here that the Porchet method was used for this analysis and the observation time for each observation point was one hour and the values of observation for dry and wet months are collected and processed to get the average value.
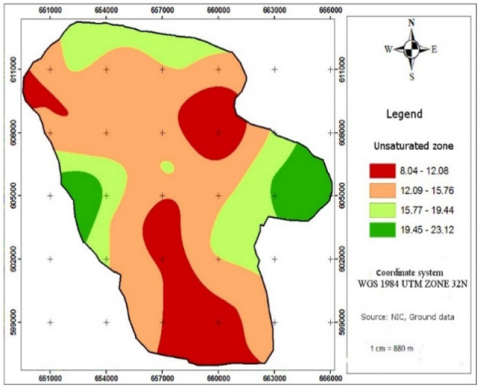
Figure 4. Thickness of the unsaturated zone
3.1.3 Unsaturated zone (N)
In view of the values obtained after having cumulated the hydraulic conductivity and the static level of the water table, the vadose zone has values between 8.04 and 12.08 for the thinner zones and from 19.45 to 23, 12 for very thick areas. The zone is at least dominated by thicknesses varying from 12.09 to 15.76 (Figure 4).
3.1.4 Middle of the ground (T)
The Figure 5 illustrates the four (04) different soil layers that are present in the study area. The predominance of brown soils derived from basalt in the North of the area followed by red soils derived from Schist in the center, the weakest represented are sandy clay soils. Thus permeable soils are highest in this study, sandy-clay soils are more exposed following hydromorphic soils following red soils derived from shale and finally brown soils derived from basalt.
Figure 5. Characterization of the pedology
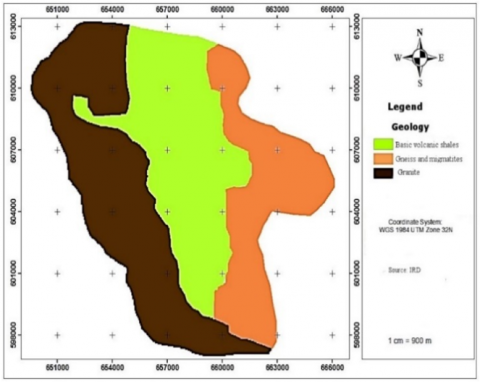
3.1.5 Aquifers (A)
The geological constitution of the subsoil gives an idea of the component of the aquifer. Knowing the characteristics of these components we can deduce the level of permeability of the top of the aquifer (Figure 6).
Figure 6. Geology of the aquifer
In our area we have mainly three (03) geological structures and according to the SINTACS approach the aquifers made up of Gneiss and Migmatites which are more vulnerable followed by the aquifers with Basic Volcanic schists and finally the granite aquifers.
3.1.6 The slope (C)
The slope is an equally important parameter for assessing the vulnerability of the aquifer (Figure 7). Water always moving along a slope tends to increase in speed the steeper the slope. So in areas where the slope is relatively low, water has a much greater tendency to infiltrate and are therefore more vulnerable to the infiltration of potentially polluted water. Therefore, according to the SINTACS rating, areas with low slopes have higher ratings because they are more vulnerable to infiltration.
Figure 7. Soil slope
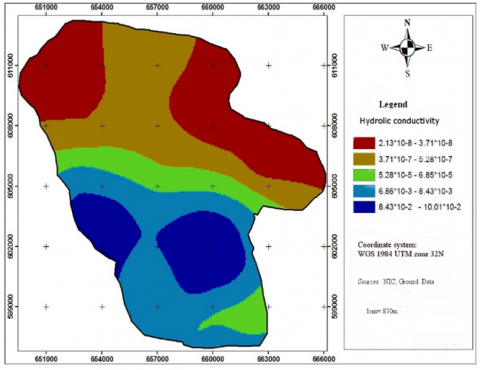
3.1.7 Hydraulic conductivity (S)
The hydraulic conductivity which defines the speed with which a ground is made cross by water this parameter is determining for the pollution of a layer because more this speed is raised this indicates that, a pollutant which leaves the surface of the ground by infiltration will have less time to travel a great distance (Figure 8).
Figure 8. Soil hydraulic conductivity
So according to the SINTACS rating the higher the speed, the higher the rating is also. So the cartographic modeling above indicates that the southern part of the study area has the highest level of hydraulic conductivity.
3.2 Intrinsic vulnerability of groundwater to pollutants coming from the surface
After interpolating and reclassifying all the SINTACS parameters, it was imperative to determine the intrinsic vulnerability of the aquifer to potential pollutants coming from the surface (Figure 9).
The vulnerability map presented here shows that the southern part of the study area is more susceptible to pollution, this can be explained by the cumulative nature of the parameters with high relative scores. If we review these parameters for example the level depth of the water table, the effective infiltration, the thickness of the unsaturated zone, the hydraulic conductivity presents high marks in the southern part of the study area, also this part South has low slopes conducive to infiltration. The types of soils found in this part (sandy-clayey soils, hydromorphic soils) have qualities conducive to moderate percolation.
Figure 9. Intrinsic vulnerability of the aquifer
The study area which extends over an area of 16,199.37 ha with 18.35 % of the study area having high vulnerability, 37.47 % medium vulnerability, 31.46 % low vulnerability and finally 12.72 % with very low vulnerability. This is close to the results of the work of [1] who estimates in Tunisia that 60 % of the aquifer presents a high vulnerability to pollutants coming from the ground surface.
3.3 Specific vulnerability of groundwater to faecal pollution
To assess the specific vulnerability to faecal contamination, we took E-coli as a bio-indicator of faecal contamination. The illustration below highlights the variation in vulnerability in the study area.
The south and part of the north of the study area with a relatively low groundwater depth and relatively high hydraulic conductivities and soils that are not permeable have medium vulnerability levels. This vulnerability is much more pronounced in urban areas, according to the analyzes carried out in these various observation wells, it results that certain groundwater in the heart of urban and peri-urban centers is already contaminated by faecal matter.
Figure 10. Specific vulnerability to faecal pollution
After carrying out several studies on aquifers in the city of Dschang [7, 8, 15] in Bafoussam come to a conclusion that the poor management of faecal effluents are potentially at the origin groundwater pollution, especially in a context of precarious urban development. These comments can be verified for faecal pollution with 51.78 % of the study area presenting an average specific vulnerability to faecal pollution that is 8,387.25 ha. The low vulnerability represents 30.24 % of the study area for 4,898.23 ha of area and in the end for a very low specific vulnerability to faecal contamination we obtained 17.99 % of the total area or 2,913.89 ha. The work of [9] also presents results similar to the effect that poor management of faecal matter can have on groundwater in the city of Santchou (Figure 10).
3.4 Specific vulnerability of groundwater to agricultural pollution
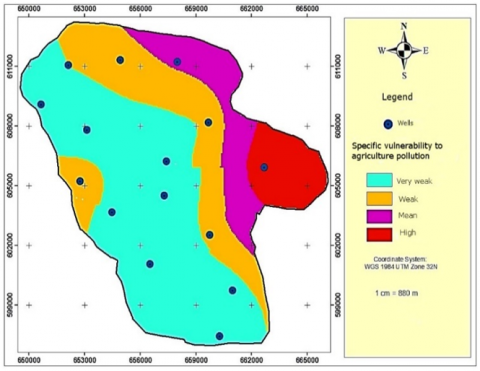
Figure 11. Specific vulnerability to agricultural pollution
To assess the specific vulnerability to agricultural contamination, we took nitrate as contamination indicator. The illustration below highlights the variation in vulnerability in the study area (Figure 11).
To obtain the distribution of the different levels of vulnerability, we used the equation established by the Ministry of Agriculture, Fisheries and Food of Quebec [5]. In this approach, the Ministry of Agriculture, Fisheries and Food of Quebec defines concentration intervals for which the levels of vulnerability are defined in zones of very low, low, moderate and high vulnerability.
After cross-checking by different level of specific vulnerability to agricultural pollution. We can say that 8.37 % of the entire study area or 1,355.49 ha has high vulnerability, 12.37 % or 2,003.28 ha has medium vulnerability, then 25.85 % or 4,188.17 ha has a low vulnerability and at the end 53.41 % or 8,652.43ha has a very low vulnerability to agricultural pollution.
Arrived at the end of this work where it was a question for us of evaluating the vulnerability of groundwater in the city of Bafoussam Cameroon where we used the SINTACS method by reviewing all its parameters in order to evaluate the vulnerability that may have groundwater to pollutants coming from the surface. For this we first determined the intrinsic vulnerability and secondly we determined the specific vulnerability to faecal matter and agricultural pollution where it practically results that the low slope and high hydraulic permeability zone presents the more susceptibility to pollution by pollutants coming from the surface. It is suggested to the residents and to the public authorities as well as to the decentralized territorial community of the region to take these results into consideration since the problem is very real. It would be preferable that crops requiring less fertilizer be introduced in these sectors with high vulnerabilities for a few years.
[1] Djémin, J., Kouamé, J., Deh, K., Abinan, A. and Jourda, J. (2016). Contribution of the sensitivity analysis in groundwater vulnerability assessing using the DRASTIC method: Application to groundwater in Dabou region (Southern of Côte d’Ivoire). Journal of Environmental Protection, 7: 129-143. https://doi.org/10.4236/jep.2016.71012.
[2] Kumar, S., Thirumalaivasan, D., Radhakrishnan, N., Mathew, S. (2013). Groundwater vulnerability assessment using SINTACS model. Geomatics, Natural Hazards and Risk, 4(4): 339-354. https://doi.org/10.1080/19475705.2012.732119
[3] Babiker, I.S., Mohamed, M.A., Hiyama, T., Kato, K. (2005). A GIS-based DRASTIC model for assessing aquifer vulnerability in Kakamigahara Heights, Gifu Prefecture, central Japan. Science of the Total Environment, 345(1-3): 127-140. https://doi.org/10.1016/j.scitotenv.2004.11.005
[4] Al Kuisi, M., El-Naqa, A., Hammouri, N. (2006). Vulnerability mapping of shallow groundwater aquifer using SINTACS model in the Jordan Valley area, Jordan. Environmental Geology, 50(5): 651-667. https://doi.org/10.1007/s00254-006-0239-8
[5] Civita, M. (2010). The combined approach when assessing and mapping groundwater vulnerability to contamination. Journal of Water Resource and Protection, 2(1): 14-28. https://doi.org/10.4236/jwarp.2010.21003
[6] Defo, C. (2019). Pollution of water resources and challenges for efficient water development in the republic of Cameroon. Natural Resource Endowment and the Fallacy of Development in Cameroon, 364. http://dx.doi.org/10.2307/j.ctvvh85v5.18
[7] Deh, S., Kouame, K., Eba, A., Djemin, J., Kpan, A., Jourda, J. (2017) Contribution of geographic information systems in protection zones delineation around a surface water resource in Adzope region (Southeast of Côte d’Ivoire). Journal of Environmental Protection, 8: 1652-1673. http://dx.doi.org/10.4236/jep.2017.813102.
[8] Mba, F.F., Temgoua,E., Kengne, P.D., Kamhoua, S.N. (2019). Vulnérabilité des eaux souterraines à la pollution dans la ville de Dschang, Ouest-Cameroun. Int. J. Biol. Chem. Sci., 13(5): 39-56. http://dx.doi.org/10.4314/ijbcs.v13i5.3S
[9] Akenji V.N., Ako A.A, Akoachere RA II, Takahiro H. (2015). DRASTIC-GIS model for assessing vulnerability to pollution of the phreatic aquiferous formations in Douala- Cameroon. J Afr Earth Sci, 102: 180-190. https://doi.org/10.1016/j.jafrearsci.11.001
[10] Smahi, D., Hammoumi, O., Fekri, A. (2013). Assessment of the impact of the landfill on groundwater quality: A case study of the Mediouna site, Casablanca, Morocco. Journal of Water Resource and Protection, 5(4): 440-445. https://doi.org/10.4236/jwarp.2013.54043
[11] Khemiri, S., Khnissi, A., Alaya, M., Saidi, S., Zargouni, F. (2013). Using GIS for the comparison of intrinsic parametric methods assessment of groundwater vulnerability to pollution in scenarios of semi-arid climate: The case of Foussana groundwater in the Central of Tunisia. Journal of Water Resource and Protection, 5(8): 835-845. http://dx.doi.org/ 10.4236/jwarp.2013.58084
[12] Javadi, S., Kavehkar, N., Mousavizadeh, M.H., Mohammadi, K. (2011). Modification of DRASTIC model to map groundwater vulnerability to pollution using nitrate measurements in agricultural areas. Journal of Agricultural Science and Technology, 13, 239-249.
[13] Nkembe, S.E., Defo, C. (2022). Assessment of piezometric distribution and vulnerability of groundwater to pollution in a tropical environment: the case study of the aquifer of Santchou, Cameroon, Central Africa. Sustainable Water Resources Management, 8(2): 48. https://doi.org/10.1007/s40899-022-00605-4
[14] Chofqi, A., Abdekader, Y., Elkbri, L., Jacky, M., Alain, V. (2004). Environmental impact of an urban landfill on a costal aquifer (El Jadida, Morocco). Journal of African Earth Science, 39, 509-516. https://doi.org/10.1016/j.jafrearsci.2004.07.013
[15] Vias, J.M., Andreo, B., Perles, M.J., Carrasco, F., Vadillo, I., Jimenez, P., (2006). Proposed method for groundwater vulnerability mapping in carbonate (karstic) aquifers: the COP method application in two pilot sites in Southern Spain. Hydrogeology Journal, 14: 912-925. https://dx.doi.org/10.1007/s.10040-006-0023-6.2004.07.013
[16] Temgoua, E., Ngnikam, E., Ndongson, B. (2009). Drinking water quality: stakes of control and sanitation in the town of Dschang-Cameroon. International Journal of Biological and Chemical Sciences, 3(3): 441-447. https://doi.org/10.4314/ijbcs.v3i3.45346
[17] Civita, M., De Regibus, C. (1995). Sperimentazione di alcune metodologie pel' la valutazione della vulnerabilità degli aquiferi (in Italian). Quadernidi Geologia Applicata, Pitagora Ed. Bologna, 3: 63-71.