Md Mahfujur Rahman* | M. Aziz Hasan | Kazi Matin Ahmed
© 2022 IIETA. This article is published by IIETA and is licensed under the CC BY 4.0 license (http://creativecommons.org/licenses/by/4.0/).
OPEN ACCESS
Naturally occurring groundwater arsenic contamination is a major problem in Narail, Bangladesh. Analyses of 32 groundwater samples showed arsenic concentrations ranged 20.33–158.90 µg/L. Relatively deeper aquifer (>45 m depth) in addition to arsenic, is contaminated with substantial amount of salinity. Electrical conductivity (EC) ranged 1.01–7.90 mS/cm indicating the enormity of salinity. The groundwater is mainly Na–Cl to Na–HCO3 type, and is SO4 limited. This research demonstrates the effectiveness of two mitigation techniques (i) managed aquifer recharge (MAR) and (ii) sub-surface arsenic removal (SAR) for in-situ salinity and arsenic treatment of contaminated groundwater. A two-year long experiment revealed that the MAR system was effective in reducing both salinity and arsenic. Groundwater EC reduced 72–81% from an initial value of 3.4 mS/cm to less than 1 mS/cm. Arsenic concentration dropped below 50 µg/L from an initial concentration of 100 µg/L. The SAR system reduced arsenic concentration below 50 µg/L from an initial concentration of 100 µg/L. The system was capable of yielding 1500 liters of arsenic safe water when injected volume of oxygen saturated water was 2000 liters indicating 70–80% recovery. Both systems can provide 1000 liters of safe drinking water at a cost of $2.00.
arsenic, salinity, groundwater, managed aquifer recharge, sub-surface arsenic removal
Natural arsenic (As) enrichment in groundwater occurs all over the world [1-3] including Southeast Asia [4-7], Bangladesh [8-12], China [13, 14], India [15, 16], Australia and Europe [17], as well as United States [3, 11]. Arsenic contamination in the alluvial and deltaic plains of Bangladesh and West Bengal (India) has resulted the largest mass poisoning in history [18, 19]. Approximately 60–70 million people are exposed to potential risk of As toxicity only in Bangladesh [20, 21]. Enormousness of the As contamination scenario observed in Bangladesh suggests that the source is geological [22] although anthropogenic activities can alter the pattern of contamination in very small scale. Access to safe drinking water have always been a problem in this country. Before liberation people mainly used surface water for drinking, cooking and other domestic purposes. After independence in 1971, more than 10 million hand tubewells (HTWs) have been installed up to 2010 bringing a huge shift from use of surface water to bacteriologically safe groundwater. Although this change significantly reduced the incidence of waterborne diseases, however it incurred another major problem- As contamination [4, 23, 24]. Presence of As in groundwater in Bangladesh was first identified by the Department of Public Health Engineering (DPHE) in 1993 [19]. Arsenic concentration in the HTWs frequently exceeds both World Health Organization (WHO) [25] and the Bangladesh Drinking Water Standards (BDWS) provisional guideline concentration for As in drinking water, 10 µg/L and 50 µg/L respectively; and often As concentrations reach mg/L levels [24, 26].
In Bangladesh part of the Bengal Basin, As enrichment is mainly restricted to the Holocene alluvial aquifers at shallow and intermediate depths [27-30]. Holocene alluvial sediments are rich in organic matter and reactive minerals; and groundwater is mostly of Ca–Mg–HCO3 and Ca–Na–HCO3 types [3, 8, 29]. Groundwater in Bangladesh typically shows low SO42– and NO3–; and high dissolved organic carbon (DOC) and NH4+ [8]. Groundwater is moderate to strongly reducing in nature. In Bangladesh occurrence of As and its mobilization is associated with geochemically reducing subsurface environment. Several hypotheses invoke pyrite (FeS2) or arsenopyrite (FeAsS) oxidation resulting from a lowering of the water table as a mechanism for As mobilization [31]. But several recent studies agreed that microbial reduction dissolution of Fe-oxyhydroxides and the limited amount of dissolved SO42– that limits biogenic precipitation of sulfide minerals are the primary mechanism of As mobilization in the groundwaters of the alluvial aquifers in Bangladesh [4, 24, 32-35]. Arsenic mobilization is associated with recent inputs of carbon (C) due to large scale irrigation pumping in central Bangladesh [36]. Microbial processes influence the As mobilizing when the sediments in the aquifer are rich in organic matter [33]. Microbial activity creates a reducing environment that favors the transformations of Fe(III) to Fe(II) as well as As(V) to As(III), and helps mobilizing As [33].
Many parts of Bangladesh in general if shallow groundwater is As contaminated, deeper aquifer provides safe drinking water. However, in the study area (Figure 1) Barnal-Eliasabad union of Narail district, Bangladesh in addition to As contamination, presence of dissolved salt in the groundwater poses another threat to the availability of safe drinking water [37]. Shallow aquifer is As contaminated and deeper aquifer is also affected by both As and salinity which makes this area hydrogeologically different compared to other parts of the country. The salinization of groundwater can occur due to both geogenic and anthropogenic activities. Remnants of marine deposits in the inland aquifer [38] or the presence of mineral salts can cause salinity [39, 40]. To feed the increasing population, during last several decades agricultural activity expanded several times everywhere in the country including south-western parts. Large scale pumping from coastal aquifers interrupted natural fresh groundwater discharge into the sea resulting a disruption in the natural equilibrium condition [41]. The fresh – saltwater interface shifted inland due to excessive pumping [42, 43]. Saline water intrusion is directly related to increased pumping [44].
Figure 1. Location map of the study area Barnal-Eliasabad union of Kalia upzila in Narail district, Bangladesh. The map is showing the hand tubewells location as well as As concentration (using field kit) in groundwater from the lower aquifer (>45 m depth from surface)
A field investigation conducted by Environment and Population Research Center (EPRC), a non-government organization, in 2013 showed that groundwater is contaminated with As concentrations 10 –500 µg/L (using field kits). About 99% of the tested HTWs showed As concentration above WHO drinking water standard (10 µg/L) and 87% exceeds Bangladesh drinking water standard (50 µg/L). There are more than 1000 HTWs in the study area and only few of them are As safe (Figure 1). No literature was available about the groundwater salinity of this area. This research was the first systematic approach to reveal actual groundwater geochemistry of the area. In terms of access to safe drinking water, options are extremely limited, and people are confronting severe crisis. They use local techniques to harvest rainwater in household level. During monsoon local communities rely on rainwater for drinking purpose. Rest of the year they use surface water from ponds and canals which are likely to be polluted with pathogenic bacteria and other organic and inorganic pollutants. In areas where surface water is not available, people are compelled to use As contaminated groundwater from HTWs and thus exposing themselves to serious health hazard. Arsenic is a confirmed carcinogen [25]. Long term intake of As >50 µg/L through drinking water causes arsenicosis, skin lesions and cancer, like hyper-pigmentations, hyperkeratosis, gangrene, skin cancer, lung cancer and bladder cancer [25], hypertension [45]. Arsenic can affect internal organs, eventually cause cancer and ultimately death. Drinking water salinity has been found to be associated with cardiovascular diseases (CVD), diarrhea, and abdominal pain [46].
Department of Geology, University of Dhaka in collaboration with DPHE has undertaken a research program in the study area under the project “Upscaling of managed aquifer recharge for community water supply in saline areas of Bangladesh”. Under the pilot program two novel technologies namely managed aquifer recharge (MAR) and sub-surface arsenic removal (SAR) have been employed and investigated. The main objectives of this research were to (i) assess the geochemistry of the groundwater from existing hand tubewells, (ii) determine vertical and spatial variation in salinity and As concentrations, (iii) assess effectiveness of MAR and SAR to reduce As and salinity, (iv) evaluate cost-effectiveness of these two technologies.
Barnal-Eliasabad union of Kalia upazila, Narail district is located in south-western part of Bangladesh. This area lies between 23° 0’ 30’’ N to 22° 57’ 30’’ N and 89° 38’ 0’’ E to 89° 39’30’’ E, covering an area of 12.75 sq. km. The area is located on the south-western part of extensive alluvial plain of Quaternary sediments laid down by the Ganges-Brahmaputra-Meghna river system, known as the Bengal basin. The study area is covered by Holocene alluvium comprising deltaic, terrace, meander, inter-stream, and swamp deposits. These sediments continue to accumulate from detritus deposited by the main rivers, particularly on the floodplain of the Meghna. Approximately 15–8 km of mainly unconsolidated sediments of tertiary to Holocene (recent) age exist beneath the study area. The study area is surrounded by Nabaganga river in west and north and Madhumati river in east. Hydrogeologically the study area belongs to the Holocene Coastal Plains (Zone-V). Four hydrostratigraphic units have been identified from the exploratory wells drilled in the study area which are, from top to bottom aquitard–1, aquifer–1, aquitard–2, and aquifer–2. The aquitard–1is composed of clay and underlain by aquifer–1 which is composed of fine to very fine sand forming a semi-confined to confined aquifer. The thickness of this upper aquifer varies from 4.57–90.15 m. The aquitard–2 is similar in composition with aquitard–1, and followed by aquifer–2 with variable thickness ranging from 16.75–22.86 m. HTWs having well depth more than 45 m are extracting water from this aquifer (main/lower).
3.1 Installation of MAR system
A complete managed aquifer recharge (MAR) system was installed at a private house at Barnal village (lat-22.97836, lon-89.64774). This system was consisted of one abstraction well, two infiltration wells, and two monitoring wells. Abstraction well was 5 cm in diameter. Abstraction well screen was 3.05 m long, placed between 57.90–60.95 m depth. Infiltration wells were located on both side of the abstraction well. These wells were 10 cm in diameter and total depth was 60.95 m. Well screen was 15.25 m long, placed between 45.70–60.95 m depth. The inner part of the infiltration well has been kept open while the outer part has been filled with gravel pack to facilitate higher infiltration capacity. The monitoring wells were installed at the two outer ends of infiltration wells. The filtration tank consisted of three chambers: two sand filtration chambers (primary and secondary) and one infiltration chamber. The dimension of the tank was 4.88x2.14x1.83 m3. Surface water (pond) was used to recharge the lower aquifer (>45 m depth). Before recharging aquifer from infiltration chamber, the pond water was filtered through the sand filtration system to remove turbidity and microorganisms.
3.2 Installation of SAR system
A complete sub-surface arsenic removal (SAR) system was installed at another private house located at Mathavanga village (lat: 22.99618, lon: 89.65736) approximately 2 km away from the MAR site. The system was installed next to an existing hand tubewell with high As concentration (100 µg/L). A tank (aeration) of 2 m3 (2000 liters) capacity was placed on a 2.15 m high platform. Another tank (storage) of same capacity was placed on a 0.92 m high platform attached to the 2.15 m high platform. The purpose of storage tank was to store groundwater (after subsurface treatment) for the local community. An electric suction pump was used to extract anoxic groundwater. An aerator was used approximately 30 minutes to saturate (>99%) the pumped groundwater with dissolved oxygen (DO). After aeration, oxygen-rich groundwater was re-injected through the same well into the aquifer via gravity. Though theoretically the chemical reactions associated with the mechanism that removes As take place within few seconds after injection, for this experiment the whole system was left uninterrupted overnight.
3.3 Field measurements
Environment and population research center (EPRC) prepared a database of 467 existing HTWs they tested for As concentration using field testing kits. The database included well location, As concentration, well depth and other additional information. For this research, the database was collected. We conducted a field investigation to acquire groundwater salinity information of the listed wells in terms of Electrical conductivity (EC). EC is directly related to salinity or total dissolved solids (TDS). EC measurements were taken at 190 HTWs. During the EC survey both spatial and depth coverage was considered. During this field investigation temperature (℃) and pH were also recorded.
After installation of the MAR and SAR systems, different physical (temperature, water level, infiltration/abstraction volume etc.) and chemical parameters (pH, EC, arsenic, iron concentrations etc.) have been monitored regularly (daily/weekly). Arsenic and iron concentrations were monitored weekly using field testing kit (Econo). Infiltration and abstraction volumes have been monitored twice a day. These volumes were recorded by taking reading of flow meters (m³) installed with the system.
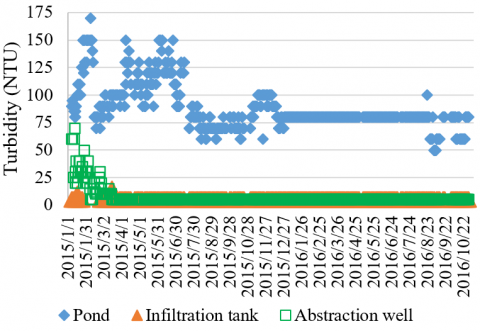
In the MAR system turbidity was an important issue as the pond water was used for aquifer recharge. As turbidity in water clogs the infiltration well and can stimulate the growth of bacteria and it is one of the key parameters of microbial water quality. Turbidity of pond water, filtered water in the infiltration tank, water from the abstraction well was monitored daily using a turbidity tube. Turbidity was measured in nephelometric turbidity unit (NTU).
Microbiological analysis was performed to monitor the presence of E. Coli bacteria in the source (pond), infiltration tank and abstraction well water to compare improvement of groundwater quality before and after treatment. Due to excellent performance of the MAR system to remove bacteria, this test was not done regularly. During this monitoring period microbiological test was done twice i.e., on 18th January 2015 and 22nd March 2015. An assembly of equipment such as compact E.Coli dry plates, filter support, forceps, filter paper, microfil funnel, syringe (1 ml and 100 ml), hand sanitizer, alcohol wipes etc. has been used. This test was done very carefully following the standard procedures. 1 ml sample was taken using a 1 ml syringe and poured on one compact dry plate labeled 1ml. Another 100 ml sample was filtered using a filter paper and the paper is placed in another compact dry plate labeled 100 ml. The results were read after 24-48 hours using hand lens as number of colonies developed.
3.4 Sampling
Subsequent fieldwork was conducted to collect representative groundwater samples from HTWs, MAR and SAR. HTWs were selected based on the As concentrations (EPRC database) and salinity (EC survey) information. Total 32 groundwater samples were collected from the HTWs following standard procedure of sampling. From the MAR system, 3 water samples were collected such as pond, infiltration tank and abstraction well. From SAR system total 8 samples were collected. Samples were taken before/after aeration of groundwater, and at different pumping time after subsurface treatment (i.e., 250 L, 500 L, 1000 L, 1500 L, 2000 L). Total 43 (HTWs=32, MAR=3, SAR=8) samples were collected for laboratory analysis. Prior to sampling, the HTWs were purged 10-15 minutes to remove the water from the well and collect unaltered groundwater from aquifer. Groundwater samples were filtered through a 0.45 µm filter and purged into two 100mL vials. One sample was acidified and preserved using 1% nitric acid for trace metal and cation analysis, and the other one remained unacidified. Samples were sent to Hydrogeochemistry laboratory of Department of Geology, University of Dhaka and preserved until lab analyses.
3.5 Geochemical analysis
Geochemical analyses of collected samples have been accomplished in the Hydrogeochemistry laboratory of Department of Geology, University of Dhaka. The acidified groundwater samples were analyzed by atomic absorption spectroscopy-SensAA spectrophotometer for cations (Na+, K+, Ca2+, Mg2+) and trace elements (As, Fe, Mn etc.). HCO3– and Cl– concentration was determined by titration methods; NO3–, SO42– and PO43– was determined by T-60 UV visible spectrophotometer. Laboratory analyses data have been arranged in tabular form in excel sheet. Ionic balance was performed to check analytical accuracy and compatibility of the data obtained from laboratory analyses with field measurements.
4.1 Geochemistry of groundwater from HTWs
Physicochemical data and major ion concentrations data of 32 groundwater samples is presented in Table 1. Parameters like temperature, pH, and EC etc. provided an instant idea about the overall quality of the groundwater. Groundwater was predominantly near neutral to slightly alkaline, pH ranged between 7.3 and 8.2. pH did not show any significant relation to depth. Temperature was found to be uniform in all the samples, ranging from 25℃ to 27℃.
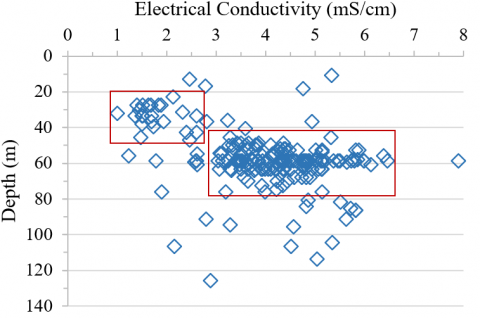
Electrical conductivity (EC) of groundwater widely varies from 1.01 to 7.9 mS/cm at different depth. Groundwater EC showed a general increasing trend with depth (Figure 2). X-Y pots showed two distinct clusters indicating groundwater samples from two different aquifers. Majority of the HTWs are pumping water from the lower/main aquifer at >45 m depth. EC between 0 and 1.5 mS/cm is considered as freshwater and EC >1.5 mS/cm indicates brackish water (TDS> 1000 mg/L). Only 8 HTWs showed EC less than 1.5 mS/cm. Remaining 182 HTWs showed EC above 1.5 mS/cm indicating 95.78% HTWs are producing brackish water. Majority of the samples have EC between 3-6 mS/cm (Figure 2) which is an indication of high total dissolved solid (TDS) in groundwater i.e. salinity in groundwater. The lowest TDS was 555.5 mg/L and maximum 4345 mg/L. Groundwater from shallow aquifer (<45 m) have low to moderate EC (<3 mS/cm) than the samples from lower aquifer (>45 m) that have higher EC (>3 mS/cm). In the upper aquifer low (<1.5 mS/cm) to moderate (1.5 – 3 mS/cm) EC occurs in the southern and eastern part and a few high EC (>3 mS/cm) occurs in central and northern part of the study area. On the other hand, moderate to high EC (>3 mS/cm) was widely spatially distributed in the lower aquifer.
Figure 2. Depth vs electrical conductivity x-y plot of groundwater samples collected from hand tubewells
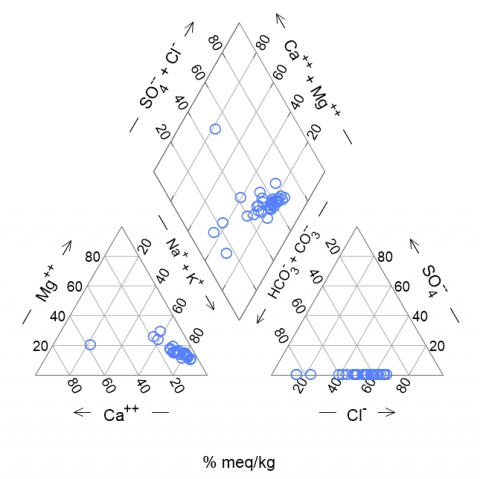
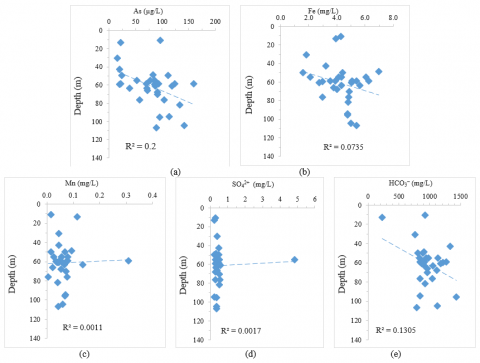
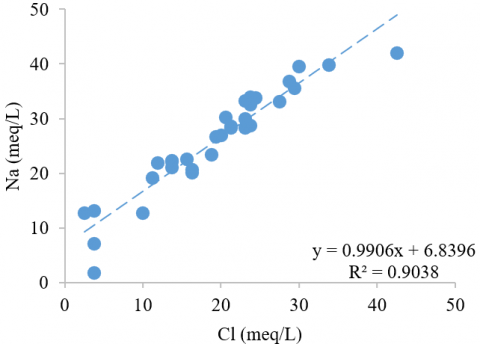
Hydrogeochemical data of the groundwater samples suggested that the groundwater is mainly Na–Cl to Na–HCO3 type (Figure 3). Sodium (Na+) is the dominant cation, while bicarbonate (HCO3−) and chlorine (Cl−) are dominant anion. Na–Cl facies indicated saline water which is also supported by observed EC. Only one sample showed Ca–Mg–HCO3 type water. The concentration of major cations, e.g., Ca2+ (33.78 – 93.88 mg/L), Mg2+ (13.88 – 109.68 mg/L), Na+ (40.21–966.18 mg/L) and K+ (1.36 – 23.91 mg/L) did not show any systematic change with depth. Major cations were quite variable. Groundwater showed a wide variability in the concentration of anions: Cl− (88.75 – 1508.75 mg/L). The concentration of HCO3− in groundwater ranged from (228.75 – 1425.88 mg/L). SO42− (0.22 – 4.85 mg/L) and NO3− (0.75 – 7.20 mg/L) were very low in the groundwater and did not show any significant pattern with depth (Figure 4d).
Figure 3. A piper diagram illustrating the main hydrochemical facies of the groundwater
Laboratory analyses provided more precise information about As concentrations. Results showed that As concentrations ranged from 20.33 – 158.90 µg/L. Although laboratory results of same groundwater sample showed relatively less concentrations compared to the field measurements, however, the As concentrations were still way too high than the acceptable limit guideline set by world health organization (10 µg/L) as well as Bangladesh Drinking Water Standards (50 µg/L). Depth distribution of As concentrations showed an increasing trend with depth (Figure 4a). The lower aquifer is under confined condition and rich in organic matter, which has created strongly reducing condition. The process may have increased with depth and reduced As(V) to As(III) and caused possible desorption of As under near-neutral pH. Further reduction may have dissolved poorly crystallized ferric oxides which is evident from a good correlation observed between iron and As in the groundwater. Relatively low As (<50 µg/L) concentrations were observed in only one sample from shallow depth (<45 m) and six samples from greater depth (>45 m). Remaining samples showed very high As concentrations. Upper aquifer was less As contaminated in southern and eastern part of study area, while lower aquifer was found severely contaminated everywhere except some areas in southern and eastern part.
Iron concentration ranged from 1.52 to 6.96 mg/L which exceed Bangladesh drinking water quality standards of 0.3-1 mg/L. High iron concentration occurred in a wide range of depth (Figure 4b). Manganese concentrations in groundwater were relatively low ranged from 0.01 to 0.14 mg/L and mostly found below the Bangladesh drinking water standard (0.1 mg/L). Both iron and manganese did not show any significant trend with increasing depth (Figure 4b, c).
Figure 4. Profiles showing the distribution of As and other solutes in groundwater with depth
Table 1. Physicochemical parameters of groundwater samples form HTWs
|
Sample ID |
Depthm |
Na+mg/L |
K+mg/L |
Mg2+mg/L |
Ca2+mg/L |
HCO3–mg/L |
Cl–mg/L |
NO3–mg/L |
SO42–mg/L |
Fe mg/L |
Mn mg/L |
As µg/L |
pH |
Temp.℃ |
EC µS/cm |
TDS mg/L |
|
61 |
59.44 |
291.84 |
22.51 |
63.39 |
73.85 |
854.00 |
355.00 |
2.09 |
0.29 |
2.96 |
0.04 |
20.33 |
7.60 |
25.4 |
2570 |
1413.5 |
|
64 |
66.14 |
650.10 |
20.35 |
63.73 |
40.10 |
960.75 |
820.94 |
1.33 |
0.38 |
3.76 |
0.02 |
72.15 |
7.70 |
25.7 |
4300 |
2365 |
|
65 |
54.86 |
649.58 |
18.17 |
60.18 |
38.66 |
937.88 |
754.38 |
2.13 |
0.31 |
4.32 |
0.03 |
77.93 |
7.80 |
26.3 |
4140 |
2277 |
|
98 |
104.55 |
759.54 |
16.81 |
73.68 |
57.14 |
1120.88 |
976.25 |
1.66 |
0.36 |
5.01 |
0.06 |
141.53 |
7.70 |
26.2 |
5350 |
2942.5 |
|
113 |
95.40 |
779.08 |
16.99 |
61.98 |
45.70 |
1425.88 |
843.13 |
1.56 |
0.37 |
4.74 |
0.07 |
94.99 |
7.50 |
26.8 |
4570 |
2513.5 |
|
121 |
67.97 |
747.57 |
18.24 |
68.71 |
49.42 |
1113.25 |
843.13 |
1.04 |
0.29 |
4.01 |
0.05 |
91.04 |
7.70 |
25.4 |
4830 |
2656.5 |
|
123 |
59.44 |
777.08 |
14.72 |
70.49 |
52.56 |
1212.38 |
865.31 |
1.66 |
0.32 |
5.09 |
0.06 |
86.24 |
7.90 |
26.1 |
4820 |
2651 |
|
140 |
54.86 |
765.40 |
17.36 |
65.42 |
44.76 |
1136.13 |
820.94 |
0.76 |
0.36 |
2.10 |
0.06 |
84.54 |
7.90 |
25.7 |
4140 |
2277 |
|
151 |
10.67 |
845.14 |
13.46 |
52.90 |
41.80 |
922.63 |
1020.63 |
2.99 |
0.29 |
4.27 |
0.02 |
95.94 |
7.77 |
25.6 |
5340 |
2937 |
|
157 |
81.69 |
816.12 |
14.08 |
61.25 |
48.54 |
922.63 |
1042.81 |
1.14 |
0.51 |
4.79 |
0.04 |
132.98 |
7.50 |
26.7 |
5520 |
3036 |
|
187 |
58.83 |
908.69 |
15.57 |
59.48 |
39.48 |
884.50 |
1065.00 |
1.52 |
0.46 |
5.06 |
0.05 |
158.90 |
7.60 |
25.7 |
4060 |
2233 |
|
214 |
54.86 |
618.56 |
17.73 |
51.79 |
38.26 |
976.00 |
710.00 |
1.23 |
4.85 |
6.08 |
0.06 |
86.28 |
7.60 |
25.3 |
4390 |
2414.5 |
|
216 |
48.77 |
660.84 |
14.66 |
55.10 |
40.94 |
907.38 |
843.13 |
4.88 |
0.32 |
6.96 |
0.09 |
83.20 |
7.50 |
25.3 |
4360 |
2398 |
|
225 |
106.68 |
658.16 |
15.64 |
49.78 |
36.44 |
793.00 |
754.38 |
4.17 |
0.36 |
5.38 |
0.04 |
88.83 |
8.20 |
25.9 |
4520 |
2486 |
|
248 |
94.49 |
483.13 |
16.10 |
52.80 |
70.77 |
846.38 |
488.13 |
7.20 |
0.22 |
4.77 |
0.07 |
113.24 |
7.60 |
27.0 |
3280 |
1804 |
|
260 |
58.83 |
689.10 |
17.53 |
53.85 |
40.46 |
846.38 |
820.94 |
2.80 |
0.37 |
6.28 |
0.08 |
93.39 |
7.30 |
26.6 |
4400 |
2420 |
|
261 |
58.83 |
694.58 |
17.99 |
54.89 |
37.56 |
892.13 |
732.19 |
3.22 |
0.36 |
3.89 |
0.08 |
123.59 |
7.70 |
25.4 |
4460 |
2453 |
|
458 |
49.68 |
462.60 |
23.91 |
64.14 |
77.02 |
808.25 |
576.88 |
3.27 |
0.23 |
4.41 |
0.07 |
111.50 |
7.70 |
26.1 |
3460 |
1903 |
|
471 |
76.20 |
440.77 |
20.42 |
57.18 |
72.29 |
1044.63 |
399.38 |
1.61 |
0.29 |
4.85 |
0.08 |
57.17 |
7.50 |
27.6 |
3200 |
1760 |
|
478 |
63.40 |
503.60 |
18.06 |
56.49 |
68.41 |
915.00 |
421.56 |
3.84 |
0.33 |
4.32 |
0.07 |
71.65 |
7.70 |
25.3 |
3280 |
1804 |
|
479 |
58.83 |
508.79 |
18.95 |
53.10 |
62.93 |
915.00 |
488.13 |
2.32 |
0.47 |
3.52 |
0.08 |
69.69 |
7.50 |
26.2 |
3460 |
1903 |
|
485 |
63.40 |
474.31 |
17.13 |
54.03 |
70.89 |
1052.25 |
576.88 |
1.80 |
0.33 |
5.61 |
0.14 |
38.58 |
7.50 |
25.8 |
3500 |
1925 |
|
1656 |
60.96 |
914.86 |
15.92 |
73.99 |
51.52 |
1174.25 |
1198.13 |
1.09 |
0.45 |
5.04 |
0.04 |
118.28 |
7.60 |
25.0 |
6130 |
3371.5 |
|
1684 |
76.20 |
611.65 |
13.13 |
45.96 |
60.48 |
838.75 |
687.81 |
2.94 |
0.54 |
2.97 |
0.01 |
103.26 |
7.70 |
25.4 |
3990 |
2194.5 |
|
1697 |
13.11 |
40.21 |
1.36 |
19.88 |
93.88 |
228.75 |
133.13 |
3.79 |
0.22 |
3.92 |
0.11 |
22.25 |
7.80 |
26.3 |
2470 |
1358.5 |
|
1721 |
70.10 |
536.95 |
15.54 |
59.30 |
78.51 |
960.75 |
665.63 |
2.23 |
0.51 |
4.86 |
0.07 |
91.14 |
7.60 |
26.7 |
3640 |
2002 |
|
1737 |
58.83 |
966.18 |
16.47 |
109.68 |
91.84 |
1265.75 |
1508.75 |
0.95 |
0.32 |
5.39 |
0.31 |
22.13 |
7.70 |
25.1 |
7900 |
4345 |
|
1747 |
42.67 |
300.14 |
17.74 |
75.24 |
87.19 |
1333.61 |
133.13 |
3.32 |
0.47 |
3.23 |
0.05 |
19.86 |
7.70 |
27.0 |
2400 |
1320 |
|
1774 |
60.96 |
511.50 |
18.81 |
48.74 |
54.60 |
869.25 |
488.13 |
1.09 |
0.57 |
2.75 |
0.05 |
86.72 |
7.70 |
25.0 |
3480 |
1914 |
|
1793 |
30.48 |
164.20 |
19.76 |
47.19 |
33.78 |
762.50 |
133.13 |
2.37 |
0.38 |
1.81 |
0.05 |
15.94 |
7.70 |
25.4 |
1450 |
797.5 |
|
1815 |
54.86 |
519.77 |
19.34 |
58.68 |
62.45 |
832.65 |
554.69 |
1.99 |
0.52 |
4.12 |
0.08 |
52.09 |
7.70 |
26.7 |
3100 |
1705 |
|
1824 |
49.68 |
292.36 |
19.42 |
43.98 |
38.91 |
884.50 |
88.75 |
2.32 |
0.47 |
1.59 |
0.02 |
24.04 |
7.50 |
25.7 |
3340 |
1837 |
A sequence of redox reactions occur in natural groundwater in confined aquifers as the groundwater migrates from recharge zones to areas of discharge. As the reactions proceed towards downgradient, usually the potential (Eh) of the groundwater decreases and alkalinity increases [3, 47]. This variations in Eh and variations in concentrations of elements with variable oxidation states (e.g., oxidized, nitrate reduction, manganese reduction, iron reduction, sulfate reduction, and methanogenesis) can be accounted for by a sequence of oxidation-reduction reactions occurring in groundwater flow systems [47]. Groundwater geochemistry of the area suggests that groundwater is in iron reducing condition which is also evident from the positive relation (R2= 0.1365) of As and iron concentrations (Figure 5). High As and iron concentrations occurred in groundwater due to bacterial reduction of Fe(III) oxyhdroxides which released ferrous iron as well as sorbed As into groundwater. On the other hand, As concentration did not show any significant correlation with Mn concentration (Figure 5).
Figure 5. X-Y plot showing a relation of arsenic concentration with iron and manganese concentration
(a)
(b)
(c)
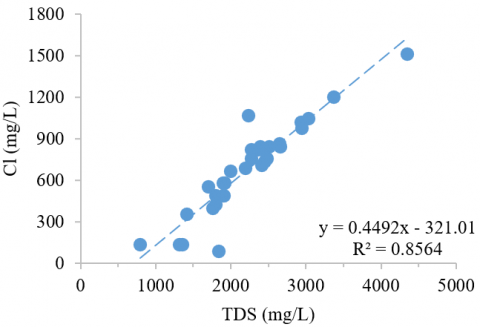
Figure 6. Bivariate plots showing relationship between (a) TDS and Na+, (b) TDS and Cl− and (c) Cl− and Na+
Total dissolved solid (TDS) is an important parameter that can be used to observe the influence of major components in groundwater quality. The groundwater concentrations of Na+ and Cl− are plotted against TDS (Figure 6a, b). The plot shows that most ions are strongly positive correlated (R2=0.7664 and 0.8564, respectively) with TDS.
4.2 Geochemistry of groundwater from MAR system
Groundwater temperature in the MAR system remained stable between 25 – 27℃, while source water (pond) temperature varied with the change of the atmospheric condition. Lowest temperature of pond was recorded 17.0℃ and highest 32.2℃. The maximum pH of pond water was recorded 8.9 while minimum pH was 7.8. A major objective of the research was to reduce groundwater salinity which is best represented by EC. The MAR system showed an overall encouraging impact of surface water infiltration into aquifer in reducing groundwater salinity. Before introducing the MAR, the background EC of the groundwater was 3.4 mS/cm. The results showed that EC was reduced to less than 1.0 mS/cm in the monitoring wells and 1.21 mS/cm in abstraction well within a month (Figure 7). After six months of infiltration the groundwater EC has reduced by 72 – 82%. The EC of pond water was found stable (0.55 – 0.60 mS/cm) throughout the monitoring period.
The variation in groundwater EC was closely related with infiltration/ abstraction volume (Figure 7). To learn the relation this experiment was conducted in mainly three steps. First, surface water was infiltrated only for certain period. During this time EC was reduced to less than 1 mS/cm. Second, both infiltration and abstraction took place simultaneously. During this period, the EC value was nearly constant 1.3 mS/cm. Third, infiltration was suspended, and abstraction continued. As a result, an increasing trend was observed in EC which reached up to 1.75 mS/cm. To check the consistency these three steps were repeated several times during the monitoring period and the system responded in similar fashion.
As surface water was injected into the aquifer for groundwater quality improvement, turbidity was a concern in the abstracted water. Turbidity of pond water was always high and it increaseed during rainy season as surface runoff carred sediments into the pond. Turbidity of pond ranged from 70 to 170 NTU thoroughout the monitoring period (Figure 8). However, turbidity of infiltrated water was found <5 NTU indicating excellent performance of sand filtration unit. Turnidity in the abstracted water was also found <5 NTU.
Figure 7. Relationship among volume of infiltration, abstraction, and electrical conductivity of abstraction well
Figure 8. Turbidity of pond, infiltration well and abstraction well water of managed aquifer recharge system
Figure 9. Total coliform and E. coli count in water of MAR system at various stage
The sand filtration unit performed excellent in reducing microorganisms and bacteria. Though in the source water there were significant number of bacteria including E. Coli, however, after filtration through sand filtration unit this number reduced drastically. In the abstraction well no bacteria were detected during the monitoring period (Figure 9).
Laboratory analyses results for groundwater samples from MAR system are summarized in Table 2. Groundwater sample from MAR abstraction well indicated an obvious improvement of water quality. The major ion concentrations were much lower than a nearby control HTW (Sample ID-458, Table 1). Control HTW is a hand tubewell located very close but outside the influence of the MAR system and represents actual groundwater of that area. The groundwater quality after treatment was within the limit of Bangladesh drinking water standards.
Arsenic concentration reduced remarkably to 43.56 µg/L from an initial concentration of 100 µg/L. Long term monitoring data showed that As concentration reduced to less than 50 µg/L within one month of infiltration and remained within the safe limit throughout the monitoring period (Figure 10). Significant reduction in iron concentration was also observed at the MAR system (Figure 10). Initial iron concentration in groundwater was 7.0 mg/L. Infiltration of naturally oxygenated low iron surface water reduced the iron concentration to 1 – 2 mg/L in groundwater. However, iron concentrations increased to background level at the end of first year and remained stable most of the time of the following year.
Table 2. Concentrations of major ions in water of MAR system. Units are in mg/L except denoted
|
|
Pond |
Infiltration tank |
Abstraction well |
Control HTW |
|
Na+ |
33.12 |
36.13 |
157.69 |
462.60 |
|
K+ |
4.18 |
4.58 |
10.29 |
23.91 |
|
Mg2+ |
20.11 |
18.09 |
29.38 |
64.14 |
|
Ca2+ |
49.66 |
52.19 |
43.86 |
77.02 |
|
HCO3- |
198.25 |
198.25 |
366.0 |
808.25 |
|
Cl- |
97.63 |
97.63 |
186.0 |
576.88 |
|
NO3- |
2.94 |
2.46 |
3.60 |
3.27 |
|
SO42- |
0.64 |
0.15 |
0.66 |
0.23 |
|
Fe |
1.52 |
0.36 |
1.92 |
4.41 |
|
Mn |
0.226 |
0.452 |
0.026 |
0.07 |
|
As (µg/L) |
39.34 |
38.36 |
43.56 |
111.50 |
Figure 10. Long term monitoring of arsenic and iron concentrations in abstraction well of MAR system
4.3 Geochemistry of groundwater from SAR system
Results of field measurement and laboratory analyses of groundwater from SAR system is summarized in Table 3. pH plays an important role in redox reactions in any aqueous system. Groundwater pH of SAR system showed significant variations at various stages of treatment. pH increased immediately after aeration and fluctuated between 7.5 and 8.1 at different stages of pumping of groundwater (after treatment). SAR system is not effective in reducing salinity. EC values did not show any significant variations during monitoring at different stages of pumping. The results (Table 3) indicate no impact of SAR system on bulk chemistry of the groundwater. However, the major ions were well within Bangladesh drinking water standards.
Both field measurements (Econo, Hach kit) and laboratory analyses showed significant reduction in groundwater As concentrations after injection of aerated water into the aquifer. Groundwater As concentration ranged 41.14 - 50.18 µg/L between pumping of 500 L to 1500 L while the background As concentration was 100 µg/L. The results suggested that least 1000 L of As safe drinking water can be abstracted after injection of 2000 L of oxygen saturated groundwater.
Table 3. Major ions in groundwater of SAR system. Units are in mg/L except denoted
|
|
Before injection |
After injection and sub-surface treatment |
||||||
|
|
Non Aerated |
Aerated |
0 L |
250 L |
500 L |
1000 L |
1500 L |
2000 L |
|
Na+ |
179.0 |
169.3 |
189.1 |
178.3 |
176.7 |
178.4 |
184.1 |
177.3 |
|
K+ |
20.5 |
20.3 |
21.1 |
21.7 |
21.4 |
21.6 |
21.8 |
21.0 |
|
Ca2+ |
100.6 |
107.3 |
101.7 |
108.6 |
104.5 |
107.0 |
117.2 |
100.2 |
|
Mg2+ |
61.1 |
65.1 |
65.9 |
66.3 |
63.3 |
63.4 |
67.7 |
63.2 |
|
HCO3– |
1044.6 |
945.5 |
922.6 |
976.0 |
960.8 |
937.9 |
953.1 |
1059.9 |
|
Cl– |
97.6 |
79.9 |
88.8 |
97.6 |
79.9 |
88.8 |
88.8 |
88.8 |
|
NO3– |
1.8 |
1.71 |
2.94 |
0.81 |
1.42 |
3.84 |
3.32 |
2.18 |
|
SO42– |
0.42 |
0.38 |
0.55 |
0.46 |
0.34 |
0.59 |
0.56 |
0.41 |
|
PO43– |
1.44 |
1.01 |
0.41 |
0.67 |
1.15 |
1.22 |
1.11 |
1.63 |
|
Fe2+ |
0.50 |
0.33 |
0.61 |
0.41 |
0.41 |
0.36 |
0.45 |
0.51 |
|
Mn |
0.101 |
0.095 |
0.098 |
0.08 |
0.076 |
0.085 |
0.096 |
0.085 |
|
As (µg/L) (lab) |
71.59 |
69.96 |
84.94 |
59.42 |
41.14 |
41.14 |
50.18 |
68.13 |
|
As (µg/L) (Econo) |
100 |
100 |
100 |
100 |
50 |
50 |
50 |
100 |
|
As (µg/L) (Hach) |
100 |
100 |
100 |
25 |
25 |
25 |
25 |
50 |
|
pH |
7.50 |
7.90 |
7.80 |
7.90 |
7.80 |
7.80 |
7.60 |
7.50 |
|
EC (mS/cm) |
1.92 |
1.90 |
1.88 |
1.88 |
1.89 |
1.91 |
1.91 |
1.92 |
4.4 Cost analysis
The costs of MAR and SAR system includes construction, operations, and maintenance expenses. Construction costs are one-time expenses during the installation of the system. Operations and maintenance costs include a caretaker salary, electricity, regulatory testing to monitor water quality, parts replacement, well rehabilitation, raw water costs etc. [48]. The installation costs may vary depending on different geological conditions as well as availability of the supplies. For this study, MAR system installation cost was approximately \$4125. For SAR system with an injection capacity of 2000 liters, installation cost was approximately \$1750, which was consistent with the experiment done by Rahman et al. [49]. Operation and maintenance cost for each system are approximately \$40/month. During the 2-year monitoring period of MAR, the system was in operation for 593 days including weekends (no abstraction). Total 334470 liters water was abstracted during this period with a monthly average of 16926 liters. Average cost for 1000 liters waters approximately \$2.25. SAR system was in operation 322 days. During this period total 211830 liters was abstracted with average of 19736 liter/month. Average cost for 1000 liter was approximately \$2.00. At the current rate of groundwater treatment and abstraction, 32–37 families can be serve served, assuming five members per family and 3.5 liters/day/capita drinking water [50]. Both systems are capable to supply more safe water if the demand of fresh water increases which will lower the cost of water compared to the cost presented above.
Various terminal electron accepting processes (TEAP's) in separate redox zones (i.e., Mn(IV), Fe(III), sulfate reduction, methanogenesis) during the degradation of organic matter in sediments are responsible for producing these discrete geochemical zones [51]. Previous studies [52, 53] found that redox potential of groundwater usually decreases along the flow path. The consumption of free oxygen by bacterially catalyzed reactions is followed by reduction of NO3–, reduction of MnO2, and then reduction of iron oxides. Adsorption or coprecipitation of trace elements such as As, Co, Ni etc. by ferromanganese coatings in sediments are well documented. Ferromanganese-coated sediments and plant debris (organic matter) are deposited in floodplain alluvium. Bacterially mediated reduction and dissolution of ferromanganese coatings below the water table in the alluvial aquifer may release As, Fe, Mn, and trace elements to the solution. High dissolved organic carbon in the groundwater and low SO42– may provide favorable environment to stimulate iron reducing bacteria. The following reduction reaction (1) explains how Fe(III) oxyhydroxides are reduced and ferrous iron is released into groundwater by bacterial iron reduction.
CH2O+7CO2+4Fe(OH)3→4Fe2++8HCO3-+3H2O (1)
This reaction (1) will elevate alkalinity and release As sorbed by Fe(III) oxyhydroxides. This mobilization process leads to widespread groundwater As contamination in Holocene fluvial aquifer worldwide [3]. The observed high dissolved iron concentrations and the lack of sulfate consumption indicates that sulfate‐reducing bacteria are much less active than Fe(III)‐reducing bacteria in this high‐iron zone. High iron concentration in groundwater develops only when there is little or no sulfate reduction in the aquifer.
High HCO3− may have released from additional sources such as the dissolution of carbonate minerals via biodegradation of organic matter. It can be explained by the following reactions (2, 3):
CH2O(organic matter)+O2→CO2+H2O (2)
CaMg(CO3)2+CO2+H2O→Mg2++2HCO3–+CaCO3 (3)
Groundwater quality improvement at the MAR system was evident from the monitoring data and laboratory analyses. Reduction in groundwater EC from 3.4 mS/cm to less than 1.0 mS/cm in first few months of infiltration of surface (pond) water was very encouraging. Overall reduction in EC was 72 – 81% as observed in the monitoring and abstraction wells. The improvement of groundwater quality was also evident from the reduction of As concentrations from an initial concentration of 100 µg/L to less than 50 µg/L. Along with As, iron concentrations reduced significantly. The reduction in concentration of As, and iron is likely to accomplish by:
(1) Co-precipitation of As along with hydrous ferric oxides (HFO) or adsorption on HFO’s surface as a result of oxidation reaction initiated by infiltration of naturally oxygenated pond water into the aquifer.
(2) Dilution effect due to infiltration of pond water with very low a As concentration (<10 µg/L) into the aquifer.
For MAR system, management of turbidity and microorganisms was a big challenge. However, the sand filtration unit performed very efficiently in removing turbidity and coliform bacteria from the pond water that was used to recharge the aquifer. Additional benefits of the system are that it can augment groundwater aquifer storage particularly during rainy season and can be used round the year especially during dry season when safe water scarcity reaches maximum. The water stored in the aquifer remains protected from anthropogenic pollution and natural disasters like flood and cyclone.
The SAR technology was very effective in reducing As concentration in groundwater. The principle of SAR is to extract anoxic groundwater, aerate it to saturate with oxygen and reinject it into aquifer. Oxygen in the injected water reacts with iron in the resident groundwater to form hydrous ferric oxide (HFO). Dissolved As sorbs onto the HFO, which allows for the extraction of groundwater with lower As concentrations [49]. The pH of the aerated water was always higher compared to the groundwater extracted after subsurface treatment. Larger pH drop indicated more Fe(II) must have oxidized (4):
4Fe2+ + O2 + 10H20→4Fe(OH)3 + 8H+ (4)
The SAR system with continued injection of oxygenated water into the aquifer lowered As concentration from an initial concentration of 100 µg/L to less than 50 µg/L. Although iron does not have any known health impact, high iron concentration makes water unacceptable to the people. The SAR system was found very effective in reducing iron in groundwater as revealed by the reduction from 7.0 mg/L to less than 1 mg/L. In the initial stage of field experiment the system yielded about 1000 liters of As safe water per cycle injection of 2000 liters aerated groundwater. With repeated injection of aerated water in the aquifer over time, the recovery of safe water per cycle of injection is increased up to 1500 liters which is 70 – 80% of the injected volume.
Based on the results of the study, following conclusions can be drawn concerning the groundwater quality of the study area and the water treatment technologies:
(1) Quality of groundwater in the study area is severely affected by high as concentrations and salinity.
(2) Both MAR and SAR systems were effective in reducing as concentrations below the limit of Bangladesh Drinking Waters Standards 50 µg/L during the pilot phase and remained stable throughout the monitoring period, while MAR was found very effective in reducing groundwater salinity.
(3) The success of MAR and SAR largely depends on the infiltration/injection abstraction ratio. The injection-abstraction dynamics should be controlled to ensure the complete and effective Fe oxidation with enough time allowed for the oxidation reactions.
(4) MAR can be applied in locations where groundwater in brackish with relatively lower As and SAR can be applied in locations where As is around 100 µg/L in fresh sallow groundwater.
(5) The most important advantages MAR and SAR techniques are the negligible toxic waste production, ease-of -use, and the low operational and capital costs that also make the technology suitable for low-income countries such as Bangladesh.
This research project was funded by UNICEF- Bangladesh. This research was conducted in collaboration with the University of Dhaka and Department of Public Health Engineering (DPHE), Bangladesh under the project “Upscaling of managed aquifer recharge for community water supply in saline areas of Bangladesh”.
[1] Welch, A.H., Westjohn, D.B., Helsel, D.R., Wanty, R.B. (2000). Arsenic in ground water of the united states: Occurrence and geochemistry. Ground Water, 38: 589-604. https://doi.org/10.1111/j.1745-6584.2000.tb00251.x
[2] Smedley, P.L., Kinniburgh, D.G. (2002). A review of the source, behaviour and distribution of arsenic in natural waters. Applied Geochemistry, 17: 517-568. https://doi.org/10.1016/S0883-2927(02)00018-5
[3] Rahman, M.M., Lee, M.K., Uddin, A. (2020). Geochemistry of groundwater and naturally occurring biogenic pyrite in the Holocene fluvial aquifers in Uphapee Watershed, Macon County, Alabama. Minerals, 10: 912. https://doi.org/10.3390/min10100912
[4] Nickson, R., McArthur, J., Burgess, W., Ahmed, K.M., Ravenscroft, P., Rahmanñ, M. (1998). Arsenic poisoning of Bangladesh groundwater. Nature, 395: 338-338. https://doi.org/10.1038/26387
[5] Acharyya, S.K., Lahiri, S., Raymahashay, B.C., Bhowmik, A. (2000). Arsenic toxicity of groundwater in parts of the Bengal basin in India and Bangladesh: The role of quaternary stratigraphy and Holocene sea-level fluctuation. Environmental Geology, 39: 1127-1137. https://doi.org/10.1007/s002540000107
[6] Palit, S., Misra, K., Mishra, J. (2019). Arsenic contamination in south Asian regions: The difficulties, challenges and vision for the future. In Separation Science and Technology, Elsevier, pp. 113-123. https://doi.org/10.1016/B978-0-12-815730-5.00005-3
[7] Uppal, J.S., Zheng, Q., Le, X.C. (2019). Arsenic in drinking water—Recent examples and updates from Southeast Asia. Current Opinion in Environmental Science & Health, 7: 126-135. https://doi.org/10.1016/j.coesh.2019.01.004
[8] Ahmed, K.M., Bhattacharya, P., Hasan, M.A., Akhter, S.H., Alam, S.M.M., Bhuyian, M.A.H., Imam, M.B., Khan, A.A., Sracek, O. (2004). Arsenic enrichment in groundwater of the alluvial aquifers in Bangladesh: An overview. Applied Geochemistry, 19: 181-200. https://doi.org/10.1016/j.apgeochem.2003.09.006
[9] Hasan, M.A., Ahmed, K.M., Sracek, O., Bhattacharya, P., von Brömssen, M., Broms, S., Fogelström, J., Mazumder, M.L., Jacks, G. (2007). Arsenic in shallow groundwater of Bangladesh: Investigations from three different physiographic settings. Hydrogeology Journal, 15: 1507-1522. https://doi.org/10.1007/s10040-007-0203-z
[10] Chakraborti, D., Rahman, M.M., Mukherjee, A., Alauddin, M., Hassan, M., Dutta, R.N., Pati, S., Mukherjee, S.C., Roy, S., Quamruzzman, Q., Rahman, M., Morshed, S., Islam, T., Sorif, S., Selim, Md., Islam, Md.R., Hossain, Md.M. (2015). Groundwater arsenic contamination in Bangladesh—21 Years of research. Journal of Trace Elements in Medicine and Biology, 31: 237-248. https://doi.org/10.1016/j.jtemb.2015.01.003
[11] Rahman, M.M. (2019). Geochemistry of groundwater and naturally occurring pyrite in the Holocene fluvial aquifers in Uphapee Watershed, Macon County, Alabama. https://etd.auburn.edu/handle/10415/6918
[12] Huq, Md.E., Fahad, S., Shao, Z., Sarven, M.S., Khan, I.A., Alam, M., Saeed, M., Ullah, H., Adnan, M., Saud, S., Cheng, Q., Ali, S., Wahid, F., Zamin, M., Raza, M.A., Saeed, B., Riaz, M., Khan, W.U. (2020). Arsenic in a groundwater environment in Bangladesh: Occurrence and mobilization. Journal of Environmental Management, 262: 110318. https://doi.org/10.1016/j.jenvman.2020.110318
[13] Zhang, L., Qin, X., Tang, J., Liu, W., Yang, H. (2017). Review of arsenic geochemical characteristics and its significance on arsenic pollution studies in karst groundwater, Southwest China. Applied Geochemistry, 77: 80-88. https://doi.org/10.1016/j.apgeochem.2016.05.014
[14] Li, Z., Yang, Q., Yang, Y., Xie, C., Ma, H. (2020). Hydrogeochemical controls on arsenic contamination potential and health threat in an intensive agricultural area, northern China. Environmental Pollution, 256: 113455. https://doi.org/10.1016/j.envpol.2019.113455
[15] Sankar, M.S., Vega, M.A., Defoe, P.P., Kibria, M.G., Ford, S., Telfeyan, K., Neal, A., Mohajerin, T.J., Hettiarachchi, G.M., Barua, S., Hobson, C., Johannesson, K., Datta, S. (2014). Elevated arsenic and manganese in groundwaters of Murshidabad, West Bengal, India. Science of The Total Environment, 488-489: 570-579. https://doi.org/10.1016/j.scitotenv.2014.02.077
[16] Bhowmick, S., Pramanik, S., Singh, P., Mondal, P., Chatterjee, D., Nriagu, J. (2018). Arsenic in groundwater of West Bengal, India: A review of human health risks and assessment of possible intervention options. Science of the Total Environment, 612: 148-169. https://doi.org/10.1016/j.scitotenv.2017.08.216
[17] Medunić, G., Fiket, Ž., Ivanić, M. (2020). Arsenic contamination status in Europe, Australia, and other parts of the World, in: Srivastava, S. (Ed.), Arsenic in Drinking Water and Food. Springer Singapore, Singapore, pp. 183-233. https://doi.org/10.1007/978-981-13-8587-2_6
[18] Smith, A.H., Lingas, E.O., Rahman, M. (2000). Contamination of drinking water by arsenic in Bangladesh: A public health emergency. Bulletin World Health Organization, 78: 1093-1103.
[19] Ravenscroft, P., Burgess, W.G., Ahmed, K.M., Burren, M., Perrin, J. (2005). Arsenic in groundwater of the Bengal Basin, Bangladesh: Distribution, field relations, and hydrogeological setting. Hydrogeol Journal, 13: 727-751. https://doi.org/10.1007/s10040-003-0314-0
[20] Chowdhury, U.K., Biswas, B.K., Chowdhury, T.R., Samanta, G., Mandal, B.K., Basu, G.C., Chanda, C.R., Lodh, D., Saha, K.C., Mukherjee, S.K., Roy, S., Kabir, S., Quamruzzaman, Q., Chakraborti, D. (2000). Groundwater arsenic contamination in Bangladesh and West Bengal, India. Environmental Health Perspectives, 108: 393-397. https://doi.org/10.1289/ehp.00108393
[21] Akai, J., Izumi, K., Fukuhara, H., Masuda, H., Nakano, S., Yoshimura, T., Ohfuji, H., Md Anawar, H., Akai, K. (2004). Mineralogical and geomicrobiological investigations on groundwater arsenic enrichment in Bangladesh. Applied Geochemistry, 19: 215-230. https://doi.org/10.1016/j.apgeochem.2003.09.008
[22] Hossain, M.F. (2006). Arsenic contamination in Bangladesh-An overview. Agriculture, Ecosystems & Environment, 113: 1-16. https://doi.org/10.1016/j.agee.2005.08.034
[23] Dhar, R.K., Biswas, B.K., Samanta, G., Mandal, B.K., Chakraborti, D., Roy, S., Jafar, A., Islam, A., Ara, G., Kabir, S., Khan, A.W., Ahmed, S.A., Hadi, S.A. (1997). Groundwater arsenic calamity in Bangladesh. Current Science, 73: 48-59.
[24] Nickson, R.T., McArthur, J.M., Ravenscroft, P., Burgess, W.G., Ahmed, K.M. (2000). Mechanism of arsenic release to groundwater, Bangladesh and West Bengal. Applied Geochemistry, 15: 403-413. https://doi.org/10.1016/S0883-2927(99)00086-4
[25] WHO (World Health Organization). (2017). Guidelines for Drinking Water Quality: Fourth Edition Incorporating the First Addendum. Geneva, p. 541.
[26] Mandal, B.K., Chowdhury, T.R., Samanta, G., Basu, G.K., Chowdhury, P.P., Chanda, C.R., Lodh, D., Karan, N.K., Dhar, R.K., Tamili, D.K., Das, D., Saha, K.C., Chakraborti, D. (1996). Arsenic in groundwater in seven districts of West Bengal, India – The biggest arsenic calamity in the world. Current Science, 70: 976-986.
[27] Ahmed, K.M., Imam, M.B., Akhter, S.H., Hasan, M.A., Khan, A.A. (2001). Sedimentology and mineralogy of arsenic contaminated aquifers in the Bengal Delta of Bangladesh. In Groundwater Arsenic Contamination in the Bengal Delta Plain of Bangladesh; TRITA-AMI Report 3084; Jacks, G., Bhattacharya, P. and Khan, A.A. (Eds.), KTH Special Publication: Dhaka Bangladesh, pp. 97-108.
[28] McArthur, J.M., Ravenscroft, P., Safiulla, S., Thirlwall, M.F. (2001). Arsenic in groundwater: Testing pollution mechanisms for sedimentary aquifers in Bangladesh. Water Resources Research, 37: 109-117. https://doi.org/10.1029/2000WR900270
[29] Bhattacharya, P., Jacks, G., Ahmed, K.M., Routh, J., Khan, A.A. (2002). Arsenic in groundwater of the Bengal delta plain aquifers in Bangladesh. Bulletin of Environmental Contamination and Toxicology, 69: 538-545. https://doi.org/10.1007/s00128-002-0095-5
[30] Mukherjee, A.B., Bhattacharya, P. (2011). Arsenic in groundwater in the Bengal Delta Plain: Slow poisoning in Bangladesh. Environmental Reviews. https://doi.org/10.1139/a01-007
[31] Mallick, S., Rajagopal, N.R. (1996). Groundwater development in the arsenic-affected alluvial belt of West Bengal – Some questions. Current Science, 70: 956-958.
[32] Bhattacharya, P., Chatterjee, D., Jacks, G. (1997). Occurrence of arsenic-contaminated groundwater in alluvial aquifers from delta plains, eastern India: options for safe drinking water supply. International Journal of Water Resources Development, 13: 79-92. https://doi.org/10.1080/07900629749944
[33] Routh, J., Bhattacharya, P., Jacks, G., Ahmed, K.M., Khan, A.A., Rahman, M.M. (2000). Arsenic geochemistry of Tala groundwater and sediments from Satkhira District, Bangladesh. Eos, Transactions, American Geophysical Union, 81: 550.
[34] Dowling, C.B., Poreda, R.J., Basu, A.R., Peters, S.L., Aggarwal, P.K. (2002). Geochemical study of arsenic release mechanisms in the Bengal Basin groundwater: Arsenic Release in Bengal Basin Groundwater. Water Resources Research, 38: 12-1-12-18. https://doi.org/10.1029/2001WR000968
[35] Zheng, Y., Stute, M., van Geen, A., Gavrieli, I., Dhar, R., Simpson, H.J., Schlosser, P., Ahmed, K.M. (2004). Redox control of arsenic mobilization in Bangladesh groundwater. Applied Geochemistry, 19: 201-214. https://doi.org/10.1016/j.apgeochem.2003.09.007
[36] Harvey, C.F. (2002). Arsenic mobility and groundwater extraction in Bangladesh. Science, 298: 1602-1606. https://doi.org/10.1126/science.1076978
[37] Rahman, M.M., Hasan, M.A., Ahmed, K.M. (2018). Alternative options for safe drinking water in arsenic and salinity affected Narail district, Bangladesh. Geological Society of America Abstracts with Programs, 50(3). https://doi.org/10.1130/abs/2018SE-312995
[38] Walraevens, K., Cardenal-Escarcena, J., Van Camp, M. (2007). Reaction transport modelling of a freshening aquifer (Tertiary Ledo-Paniselian Aquifer, Flanders-Belgium). Applied Geochemistry, 22: 289-305. https://doi.org/10.1016/j.apgeochem.2006.09.006
[39] Grube, A., Schmalz, B., Nachtigall, K.H., Wichmann, K. (1999). Provisional results of investigations on groundwater salinization with emphasis on the region of Lübeck, Northern Germany. In: Proceedings of SWIM15, Ghent, 1998. Natuurwet. Tijdschr 79, 164-171.
[40] Farrah, N.A., Martens, K., Walraevens, K. (2011). Hydrochemistry of the upper Miocene-Pliocene-Quaternary aquifer complex of Jifarah plain, NW-Libya. Geol. Belg., 14(3-4): 159-174.
[41] Sarker, M.M.R., Van Camp, M., Islam, M., Ahmed, N., Walraevens, K. (2018). Hydrochemistry in coastal aquifer of southwest Bangladesh: Origin of salinity. Environmental Earth Sciences, 77: 39. https://doi.org/10.1007/s12665-017-7196-2
[42] Van Camp, M., Mtoni, Y., Mjemah, I.C., Bakundukize, C., Walraevens, K. (2014). Investigating seawater intrusion due to groundwater pumping with schematic model simulations: The example of the Dar es Salaam coastal aquifer in Tanzania. Journal of African Earth Sciences, 96: 71-78. https://doi.org/10.1016/j.jafrearsci.2014.02.012
[43] Walraevens, K., Mjemah, I.C., Mtoni, Y., Van Camp, M. (2015). Sources of salinity and urban pollution in the Quaternary sand aquifers of Dar es Salaam, Tanzania. Journal of African Earth Sciences, 102: 149-165. https://doi.org/10.1016/j.jafrearsci.2014.11.003
[44] MPO (Master Plan Organization). (1987). Groundwater Resources of Bangladesh; Technical Report No. 5. Master Plan Organization, Dhaka, Harza Engineering USA; Sir M MacDonald, UK; Meta Consultant, USA; and EPC Bangladesh.
[45] Ayers, J.C., George, G., Fry, D., Benneyworth, L., Wilson, C., Auerbach, L., Roy, K., Karim, Md.R., Akter, F., Goodbred, S. (2017). Salinization and arsenic contamination of surface water in southwest Bangladesh. Geochemical Transactions, 18(1): 1-23. https://doi.org/10.1186/s12932-017-0042-3
[46] Chakraborty, R., Khan, K.M., Dibaba, D.T., Khan, M.A., Ahmed, A., Islam, M.Z. (2019). Health implications of drinking water salinity in coastal areas of Bangladesh. International Journal of Environmental Research and Public Health, 16: 3746. https://doi.org/10.3390/ijerph16193746
[47] Champ, D.R., Gulens, J., Jackson, R.E., (1979). Oxidation–reduction sequences in ground water flow systems. Canadian Journal of Earth Sciences, 16: 12-23. https://doi.org/10.1139/e79-002
[48] Maliva, R. (2014). Economics of managed aquifer recharge. Water, 6: 1257-1279. https://doi.org/10.3390/w6051257
[49] Rahman, M.M., Bakker, M., Freitas, S.C.B., van Halem, D., van Breukelen, B.M., Ahmed, K.M., Badruzzaman, A.B.M. (2015). Exploratory experiments to determine the effect of alternative operations on the efficiency of subsurface arsenic removal in rural Bangladesh. Hydrogeology Journal, 23: 19-34. https://doi.org/10.1007/s10040-014-1179-0
[50] Milton, A.H., Rahman, H., Smith, W., Shrestha, R., Dear, K. (2006). Water consumption patterns in rural Bangladesh: Are we underestimating total arsenic load? Journal of Water Health, 4: 431-436. https://doi.org/10.2166/wh.2006.0027
[51] Postma, D., Jakobsen, R. (1996). Redox zonation: Equilibrium constraints on the Fe(III)/SO4-reduction interface. Geochimica et Cosmochimica Acta, 60: 3169-3175. https://doi.org/10.1016/0016-7037(96)00156-1
[52] Lee, R.W. (1985). Geochemistry of groundwater in cretaceous sediments of the southeastern coastal plain of eastern Mississippi and western Alabama. Water Resources Research, 21: 1545-1556. https://doi.org/10.1029/WR021i010p01545
[53] Lovley, D.R. Chapelle, F.H. (1995). Deep subsurface microbial processes. Reviews of Geophysics, 33(3): 365-381. https://doi.org/10.1029/95RG01305