Khin Khin Gyi* | Wint Thuzar Nwe | Zin Zin Zaw | Khin Khin San
© 2020 IIETA. This article is published by IIETA and is licensed under the CC BY 4.0 license (http://creativecommons.org/licenses/by/4.0/).
OPEN ACCESS
A total of 69 taxa of dinoflagellates at Rakhine coastal waters, 8 taxa at Mon coastal waters, and 29 taxa at northern Tanintharyi coastal waters were recorded in the present study. Regarding the percentage composition of dinoflagellates, Gonyaulacoid and Peridinoid were noted as the most abundant groups in dinoflagellates. A wide range of salinity fluctuations was noticed in the present study due to the effects of the monsoon cycle in the Indian Ocean. The maximum salinity, 34‰ was recorded in pre-monsoon months whereas the minimum value, 14‰ was detected in monsoon season. The highest pH value, 9.0 was observed in monsoon months. The concentrations of PO4-P, NH3-N, and NO3-N were normally high during pre-monsoon months. The cell abundance of dinoflagellates at all stations was high during pre-monsoon months indicated that a mesotrophic environment favor species richness and dense.
composition, dinoflagellates, mesotrophic, monsoon, pre-monsoon
Phytoplankton are known as primary producers since they are the functional base of all marine ecosystems [1]. The other producers (secondary and tertiary) depend on phytoplankton directly or indirectly for food [2, 3]. There are some reasons why phytoplankton biodiversity in the oceans is needed to understand especially in Myanmar waters. In other words, the marine food web is significantly depended on it [4]. Also, phytoplankton are responsible for half of the planetary photosynthesis [5, 6]. This process has resulted in the reduction of carbon dioxide. If this blooming of cells was taken placed, dissolved oxygen (DO) in seawater can be depleted. The changes in wind directions and currents in the Bay of Bengal and the Andaman Sea were the main factors that made variations in the dinoflagellate community.
Dinoflagellates exhibit a wide range of divergence in morphology and size [7]. They are very diverse and have some important characters in species identification and probably represent a complex of ecological strains. In the Indian Ocean, the annual winter cooling, wind-driven upwelling, and vertical diffusion of nutrients have been recognized as the most important physical mechanisms for nutrient input into the euphotic zone [8]. The southwest monsoon period which starts from June to September is the main source of climatic variations in the study areas. Physical and chemical factors are suggested to influence the dinoflagellates community [9]. The Bay of Bengal area is subjected to increasing anthropogenic pressure and is characterized as mesotrophic concerning nitrate concentration. A gradual increase in the nitrate concentration along with a simultaneous decrease in the dissolved oxygen (DO) has been observed over the years.
The characterization that was based on the Assessment of Estuarine Trophic Status (ASSETS) model [10] indicates that the current status is poor and the environment is degrading [11]. It was suggested that the process of diffusion by itself is inadequate to meet the nutrient demands of phytoplankton, especially in the top 50 meters. The phytoplankton population determines the productivity of estuarine and marine ecosystems [12]. Phytoplankton requires a diverse array of minimal nutrients for growth and maintenance [13, 14]. The present study aims to know the seasonal species composition of dinoflagellates along Rakhine, Mon, and northern Tanintharyi waters, and to get an understanding of the factors affecting changes in the cell abundance of marine dinoflagellates in accordance with the environmental parameters and nutrient concentrations.
2.1 Sampling sites
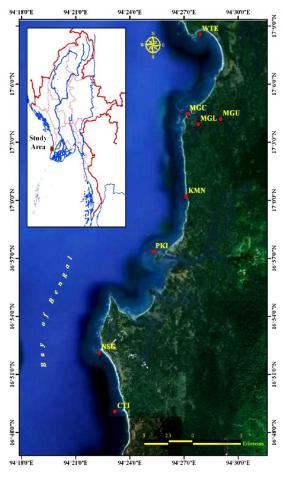
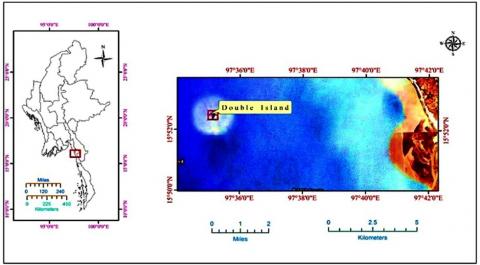
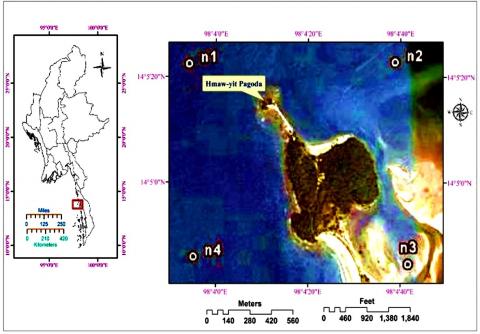
The sampling sites were plotted by hand-held Global Positioning System (GPS). It is part of the Bay of Bengal and down south of Rakhine Coastal Region (Figure 1). Eight sampling stations were plotted at Rakhine coastal waters such as Wetthe (Lat. 17º 08´ 34.474" N, Long. 94º 27´51.226" E) as station-1; Upper part of MaGyi tidal creek (Lat. 17º 04´13.485" N, Long. 94º 28´58.017" E) as station-2; Lower part of MaGyi tidal creek (Lat. 17º 03´59.57" N, Long. 94º 27´44.269" E) as station-3; MaGyi area (coastal) (Lat. 17º 04´30.183" N, Long. 94º 27´9.482" E) as station-4; Kyauk-Mong-Nama, down-south of MaGyi (Lat. 17º 00´12.76" N, Long. 94º 27´2.525" E) as station-5; Phoe-Kala Island, near Chaungtha beach (Lat. 16º 57´ 20.217" N, Long. 94º 25´18.164" E) as station-6; Ngwe-Saung Beach (Lat. 16º 52.490" N, Long. 94º 22´15.88" E) as station-7; and Chit-thu Island, down-south of Ngwe-Saung Beach (Lat. 16º 49´6.243" N, Long. 94º 23´8.757" E) as station-8. Station-9 is situated at Double Island, Setse Beach (Lat. 15º 57´6.897" N, Long. 97º 37´3.231" E) in Mon coast and station-10 sited at Hmaw-Yit pagoda of Kampani area (Lat. 14º 07´5.426" N, Long. 98º 06´7.168" E) in Tanintharyi coast (Figures 2 and 3).
Most of the sampling sites are influenced by the freshwater influx. Some sampling sites are situated near the mouth of a tidal creek, rocky shore with a muddy bottom, coarse sand area, and near mangrove forest respectively.
Figure 1. Sampling stations at Rakhine coastal water
Figure 2. Sampling station at Mon coastal water
Figure 3. Sampling stations at Tanintharyi coastal water
2.2 Morphospecies group (taxonomic)
The present study follows the methods of Taylor et al. [15] and Guiry [16] for taxonomic identification. Dinoflagellates were separated into five morphospecies groups for ecological purposes.
2.3 Sample collection, preservation, and identification
Samples were collected seasonally. Since monsoon is the major climate changing-agent, the study period was divided into three seasons which is based on temperature records sold by the Meteorological Department. Months from February to May were grouped as pre-monsoon period, June to September as the monsoon period and October to January as the post-monsoon period, respectively.
Standard plankton net 20 µm aperture, 30 cm in diameter, 90 cm in length, and bucket diameter of 3.5cm, was used for qualitative analysis. For the quantitative analysis, the present study follows the method of LeGresley and McDermott [17] and Sournia [18]. Sub-samples were taken from the known volume and count with Sedgwick-Rafter cell counting [19]. The duration of the surface haul was 10 minutes for each attempt, and all the sampling procedure in this study was based on Sournia [18]. Formaldehyde solution was prepared according to Andersen and Throndsen [19] and immediately added to the samples with a final concentration of 4% [18]. Phytoplankton species identification was done according to the literature reported by Hasle et al. [20]. Micrometry of cells was measured by ocular-meter which is calibrated with the stage micrometer. Micrographs were captured by Digital Camera for Microscope (DCM 130, 1.3M pixels).
2.4 Environmental parameters
Salinity was immediately measured at sampling sites with a refractometer (AO) which is temperature compensated. pH values were determined in situ with Hanna meter. For the determination of nutrients such as PO4-P, NO3-N, and NH3-N, the water samples were sent to the Ministry of Fishery and Livestock in Thakatha, Yangon.
3.1 Species composition
During the study period, a total of 69 taxa at Rakhine coastal waters, 8 taxa at Mon coastal waters, and 29 taxa at Taninthayi coastal waters were recorded respectively.
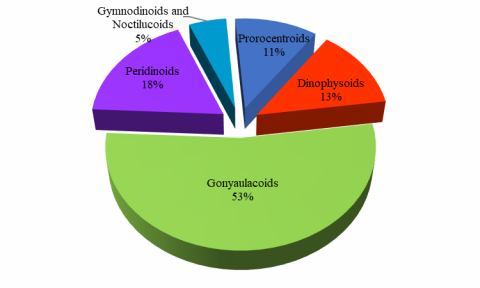
At Rakhine coastal waters, Gonyaulacoid species were the most diverse group, 53% in species composition followed by Peridinoid 18%, Dinophisoid 13%, Prorocentroid 11%, and Gymnodinoids and Noctilucoids with 5% in descending order (Figure 4).
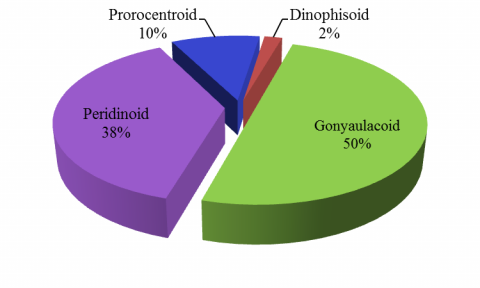
At Mon coastal waters, Gonyaulacoid species preoccupied 50% in percentage composition of the morphospecies group. Peridinoid 38% and Prorocentroid 10% placed second and third positions in population structure. Dinophisoid 2% was the least diverse group in this area (Figure 5).
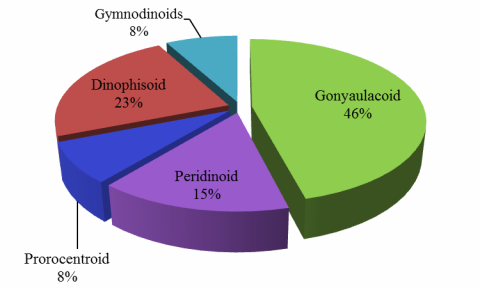
The morphospecies groups consist of Gonyaulacoid 46%, Dinophisoid 23%, Peridinoid 15%, Prorocentroid 8%, and Gymnodinoids 8% in species composition at Tanintharyi coastal waters (Figure 6).
Figure 4. Percentage composition of morphospecies group of dinoflagellates at Rakhine coastal water
Figure 5. Percentage composition of morphospecies group of dinoflagellates at Mon coastal water
Figure 6. Percentage composition of morphospecies group of dinoflagellates at Tanintharyi coastal water
Concerning the percentage composition of morphospecies groups of dinoflagellates at 10 stations along Rakhine, Mon, and northern Taninthayi coastal waters, five morphospecies groups were recorded at Rakhine, four morphospecies groups such as Prorocentriod, Gonyaulacoid, Peridinoid, and Dinophisoid were recorded at Double Island surrounding areas of Mon coastal waters, and five morphospecies groups were recorded at northern Taninthayi coastal waters (Figures 4-6).
3.2 Cell abundance of dinoflagellates in relation to the environmental parameters
Salinity values were recorded in the range of 24-34‰ in pre-monsoon, 14-27‰ in monsoon, and 24-32‰ in post-monsoon seasons (Table 1). Concerning the pH, the value was normal in most of the study areas. Fluctuations take placed due to seasonal changes. A high pH value of 9.0 was found at Rakhine coastal waters during the monsoon period. At Hmaw-yit pagoda area of northern Tanintharyi waters, a low pH value of 5.3 was recorded in the pre-monsoon period (Table 2).
Regarding the nutrient concentrations, the PO4-P content was recorded as 0.05-0.38, 0.01-0.07 and 0.03-0.26 mgL-1 in pre-monsoon, monsoon and post-monsoon months, respectively (Table 3). Concerning the NH3-N concentration, the values showed no significant seasonal variations; 0.04-0.09 mgL-1 in pre-monsoon, 0.01-0.05 mgL-1 in monsoon and 0.03-0.07 mgL-1 in post-monsoon seasons (Table 4). In relation to the determination of NO3-N content in the waters, the values showed in the range of 0.02-0.05 mgL-1 in pre-monsoon, 0.01-0.03 mgL-1 in monsoon and 0.01-0.04 mgL-1 in post-monsoon (Table 5).
Table 1. Salinity (in part per thousand, ppt)
|
No. |
Stations |
Period |
||
|
Pre-monsoon |
Monsoon |
Post-monsoon |
||
|
1. |
Station 1-8 |
29-34 |
17-26 |
28-31 |
|
2. |
Station 9 |
24-33 |
14-24 |
24-30 |
|
3. |
Station 10 |
33-34 |
19-27 |
30-32 |
Table 2. pH
|
No. |
Stations |
Period |
||
|
Pre-monsoon |
Monsoon |
Post-monsoon |
||
|
1. |
Station 1-8 |
7.8-8.6 |
6.8-9.0 |
7.5-8.7 |
|
2. |
Station 9 |
7.8-8.5 |
6.8-7.2 |
7.6-8.8 |
|
3. |
Station 10 |
5.3-8.0 |
7.4-7.8 |
8.3-8.6 |
Table 3. PO4-P (mgL-1)
|
No. |
Stations |
Period |
||
|
Pre-monsoon |
Monsoon |
Post-monsoon |
||
|
1. |
Station 1-8 |
0.07-0.38 |
0.01-0.06 |
0.03-0.21 |
|
2. |
Station 9 |
0.05-0.03 |
0.01-0.03 |
0.04-0.17 |
|
3. |
Station 10 |
0.08-0.21 |
0.01-0.07 |
0.05-0.26 |
Table 4. NH3-N (mgL-1)
|
No. |
Stations |
Period |
||
|
Pre-monsoon |
Monsoon |
Post-monsoon |
||
|
1. |
Station 1-8 |
0.04-0.08 |
0.01-0.03 |
0.04-0.06 |
|
2. |
Station 9 |
0.04-0.07 |
0.01-0.02 |
0.03-0.05 |
|
3. |
Station 10 |
0.05-0.09 |
0.01-0.05 |
0.05-0.07 |
Table 5. NO3-N (mgL-1)
|
No. |
Stations |
Period |
||
|
Pre-monsoon |
Monsoon |
Post-monsoon |
||
|
1. |
Station 1-8 |
0.03-0.05 |
0.01-0.02 |
0.02-0.04 |
|
2. |
Station 9 |
0.02-0.04 |
0.01-0.03 |
0.01-0.04 |
|
3. |
Station 10 |
0.02-0.05 |
0.01-0.02 |
0.02-0.04 |
Seasonal fluctuations in cell abundance occurred among morphospecies groups dinoflagellate at Rakhine, Mon, and northern Tanintharyi coastal waters were shown in Tables 6-8. The maximum cell abundance, 13305 CellsL-1 was found in Station-10, Hmaw-yit pagoda station of Kampani, northern Taninthayi coastal waters during the pre-monsoon season (Table 8). The minimum value was found at Station 9, Double Island of Setse, Mon coastal waters where cell abundance was 859 CellsL-1 (Table 7). The moderate cell abundance, 1306-4856 CellsL-1 was noticed at Rakhine coastal waters throughout the study period (Table 6).
Table 6. Cell abundance (cells L-1 at Rakhine coastal water)
|
No. |
Morphospecies group |
Stations 1-8 |
||
|
Pre-monsoon |
Monsoon |
Post-monsoon |
||
|
1 |
Prorocentriod |
467 |
177 |
350 |
|
2 |
Dinophysoid |
395 |
191 |
391 |
|
3 |
Gonyaulacoid |
3353 |
560 |
1571 |
|
4 |
Peridinoid |
515 |
285 |
578 |
|
5 |
Gymnodinoid |
126 |
93 |
167 |
|
Total Cell Density |
4856 |
1306 |
3057 |
|
Table 7. Cell abundance (cells L-1 at Mon coastal water)
|
No. |
Morphospecies group |
Station 9 |
||
|
Pre-monsoon |
Monsoon |
Post-monsoon |
||
|
1 |
Prorocentriod |
155 |
76 |
146 |
|
2 |
Dinophysoid |
133 |
2 |
39 |
|
3 |
Gonyaulacoid |
866 |
59 |
590 |
|
4 |
Peridinoid |
1784 |
722 |
1982 |
|
Total Cell Density |
2938 |
859 |
2757 |
|
At all study areas, species composition of dinoflagellate showed different from one another. In Rakhine coastal waters, the Gonyaulacoids group occupied more than 50% in species composition. As well, the Gonyaulacoids group stood as the most dominant group in Mon and northern Tanintharyi coastal waters. Peridinoid and Dinophysoids were noted as dominant groups after Gonyaulacoids. Members of the Gymnodinoids group had not been observed at Double Island of Setse, Mon coastal waters. Gonyaulacoid and Peridinoid showed more abundant in dinoflagellate species groups.
Table 8. Cell abundance (cells L-1 at Tanintharyi coastal water)
|
No. |
Morphospecies group |
Station 10 |
||
|
Pre-monsoon |
Monsoon |
Post-monsoon |
||
|
1 |
Prorocentriod |
1525 |
2325 |
2439 |
|
2 |
Dinophysoid |
4450 |
3210 |
3462 |
|
3 |
Gonyaulacoid |
5245 |
5175 |
2225 |
|
4 |
Peridinoid |
2085 |
750 |
2740 |
|
Total Cell Density |
13305 |
11460 |
10866 |
|
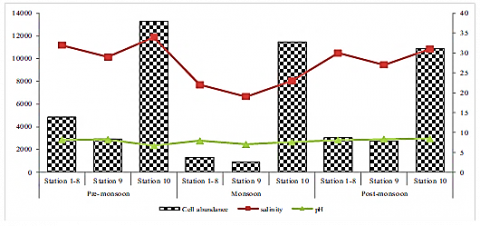
The salinity of the study areas was varied. It went up to a high level (33-34‰) in the pre-monsoon period and down to the minimum level in the monsoon period due to heavy rainfall (Table 1). pH values varied seasonally. The maximum value stretched to 9.0 was detected in monsoon months (Table 2). Regarding the nutrient concentrations, the values of PO4-P, NH3-N, and NO3-N were higher in pre-monsoon months (Tables 3-5) which in turn affect a positive relationship between cell abundance of dinoflagellates indicated that a mesotrophic environment favor for species richness and dense. The present study indicates that cell abundance of dinoflagellates at all stations was high during the premonsoon period. Low cell density was mostly recorded in the monsoon period. Among the stations, Station-10 has the maximum cell abundance all the year-round (Figure 7).
Figure 7. Cell abundance of dinoflagellates in relation to salinity and pH among 10 stations during pre-monsoon, monsoon and post-monsoon seasons at Rakhine, Mon and northern Tanintharyi coastal waters
Each morphospecies group consists of different numbers of individual species. Changes in species composition and abundance of dinoflagellates in one area to another place were made by the influences of seasonal variations of physicochemical parameters. Gonyaulacoids stood as the most dominant group in the species composition of dinoflagellates. Peridinoid and Dinophysoids were noted as dominant groups after Gonyaulacoids. High species density was observed during the pre-monsoon period in the study areas. This is similar to the occurrence patterns of phytoplankton in the Indian Ocean. Thus, a natural history of water masses of the study areas is also important in the dominance of microalgae assemblages.
The authors are indebted to Dr. Aung Myat Kyaw Sein, Rector, and Dr. San San Aye, Pro-Rector of Mawlamyine University, for their support in preparing this research work. We are thankful to Dr. San Tha Tun, Professor and Head of the Department of Marine Science, Mawlamyine University, for providing the use of departmental facilities. Many thanks are especially to Dr. Khin Maung Cho, Pro-Rector (Retired), Mawlamyine University, for his kind suggestions in preparing the manuscript. Also, permission for this work from the Department of Higher Education, the Ministry of Education, and for facilities of the Department of Marine Science, Mawlamyine University is most appreciated.
[1] Raymont, J.E.G. (1980). Plankton and productivity in the oceans. 2nd Edition. Vol.1-Phytoplankton. Pergamon Press Ltd. London, UK, 489.
[2] Hui, D. (2012). Food web: Concept and applications. Nature Education Knowledge, 3(12): 6.
[3] Trites, A.W. (2003). Food webs in the ocean: Who eats whom and how much. Responsible Fisheries in the Marine Ecosystem, 125-141.
[4] Anathan, G., Sampathkumar, P., Soundarapandian, P., Kannan, L. (2008). Phytoplankton composition and community structure of Ariyankuppam estuary and Verampattinam coast of Pondicherry. Journal of Aquatic Science, 3(1): 12-21. https://doi.org/10.3923/jfas.2008.12.21
[5] Baumert, H.Z., Petzoldt, T. (2008). The role of temperature, cellular quota and nutrient concentrations for photosynthesis, growth and light–dark acclimation in phytoplankton. Limnologica, 38(3-4): 313-326. https://doi.org/10.1016/j.limno.2008.06.002
[6] Simon, N., Cras, A.L., Foulon, E., Lemée, R. (2009). Diversity and evolution of marine phytoplankton. Comptes Rendus Biologies, 332(2-3): 159-170. https://doi.org/10.1016/j.crvi.2008.09.009
[7] Faust, M.A., Gulledge, R.A. (2002). Identifying harmful marine dinoflagellates. Smithsonian Institution Contributions, U.S. National Herbarium, 42: 1-144. https://doi.org/10.1023/B:JAPH.0000019147.40273.1b
[8] Devassy, V.P., Goes, J.I. (1991). Phytoplankton assemblages and pigments in the exclusive economic zone of Mauritius (Indian Ocean). Indian Journal of Marine Sciences, 20, 163-168.
[9] Bakun, A., Broad, K. (2003). Environmental ‘loopholes’ and fish population dynamics: comparative pattern recognition with focus on El Niño effects in the Pacific. Fisheries Oceanography, 12(4-5): 458-473. https://doi.org/10.1046/j.1365-2419.2003.00258.x
[10] Bricker, S.B., Ferreira, J.G., Simas, T. (2003). An integrated methodology for assessment of estuarine trophic status. Ecological Modelling, 169(1): 39-60. https://doi.org/10.1016/S0304-3800(03)00199-6
[11] Sawant, S.S., Prabhudessai, L., Venkat, K. (2007). Eutrophication status of marine environment of Mumbai and Jawaharlal Nehru ports. Environmental Monitoring and Assessment, 127(1-3): 283-291. https://doi.org/10.1007/s10661-006-9279-5
[12] Supate, A.R., Bhosale, L.J. (1989). Effect of water pollution on estuarine phytoplankton productivity. Proceedings of National Seminar ISPP, Bombay.
[13] Cho, K.M. (2011). Seasonal species occurrence of marine dinoflagellates in near-shore MaGyi coastal water. Ph.D. dissertation, Mawlamyine University, Myanmar.
[14] Legendre, L., Rassoulzadegan, F. (1995). Plankton and nutrient dynamics in marine waters. Ophelia, 41(1): 153-172. https://doi.org/10.1080/00785236.1995.10422042
[15] Taylor, F.J.R., Fuyuko, Y., Larsen, J., Hallegraeff, G.M. (2003). Taxonomy of harmful dinoflagellates. In: Hallagraeff, G.M., Andersen D.M., Cembella, A.D. (eds) Manual on Harmful Marine Microalgae.
[16] Guiry, M.D. (2015). AlgaeBase version 4.2 World-wide electronic publication, National University of Ireland, Galway. http://www.algaebase.org.
[17] LeGresley, M., McDermott, G. (2010). Counting chamber methods for quantitative phytoplankton analysis-haemocytometer, Palmer-Maloney cell and Sedgewick-Rafter cell. UNESCO (IOC Manuals and Guides), 25-30.
[18] Sournia, A. (1978). Phytoplankton Manual. Monographs on Oceanographic Methodology 6’, UNESCO, Paris. ISBN 92-3-101572-9.
[19] Andersen, P., Throndsen, J. (2003). Estimating cell numbers. In: Hallegraeff, G.M., Anderson, D.M., Cembella, A.D. (eds) Manual on harmful marine microalgae. Monograph on oceanographic methodology, UNESCO Publishing.
[20] Hasle, G.R., Syvertsen, E.E., Steidinger, K.A., Tangen, K., Tomas, C.R. (1996). Identifying marine diatoms and dinoflagellates. Elsevier.