Shengyu Qian
© 2020 IIETA. This article is published by IIETA and is licensed under the CC BY 4.0 license (http://creativecommons.org/licenses/by/4.0/).
OPEN ACCESS
Considering a great number of newly built bridges at home and abroad, this paper aims to study how to effectively check the technical status such as construction quality, and bearing capacity etc. of the prestressed concrete simply supported bridges using the dynamic and static load tests. First, the finite element calculation was conducted to simulate various construction conditions of the bridge and calculate the actual bridge's bearing capacity. Then, taking Yanxi Bridge as an example, the authors carried out dynamic and static load tests and finite element theoretical calculations to analyze the deflection and strain of the bridge structure during the static load test, as well as the frequency, damping and patterns obtained from the dynamic load test. As a result, the bridge quality was reasonably evaluated. The analysis results show that the bearing capacity and structural rigidity of the bridge meet the design requirements. The research findings shall provide references for the completion acceptance of other bridges.
static load test, dynamic load test, finite element, stress, deflection
Roads and bridges are the main ways to build cities, providing convenient transportation. This not only facilitates people's travel, but also accelerates the economic development of a city and a country. With the increasing number of new roads and bridges, the quality of highway engineering construction has also received more and more attention, and relevant technical assessment is required on whether the quality of new bridges meets the requirements of design specifications. Civil engineering-related agencies should prepare and publish standards, guidelines, and simple recommendations to protect the safety of critical infrastructure [1]. Perhaps, due to the inadequate management of the construction organization and then unqualified materials, the built bridge fails to meet the design requirements. Traditional structural modeling methods, such as residual minimization and Bayesian model updating, usually assume that the uncertainty has a zero-mean Gaussian form [2-4]. Now, the dynamic and static load tests have become the mainstream detection method, and been widely used in the inspection of old bridges and new bridges [5].
Many researchers at home and abroad have studied the load test of a large number of bridges. Laura [6] focused on the main steps and achievements of crossing the Adda River Bridge, and carried out bridge dynamic tests; Ye [7], taking Dongjiang Bridge as an example, conducted a static load test on a prestressed concrete continuous steel bridge; it is found that under the test load, the bridge had sufficient stiffness, strength and safety reserves, its deformation and strain distribution of the bridge were normal, the calibration coefficient and relative residuals met the requirements of the Testing Regulations, and the strain calibration coefficient was small; Zeng et al. [8] performed the static load test and result analysis for prestressed concrete hollow slab (20m), finding that the measured normal surface strain on the concrete surface of mid-span hollow slab is less than the corresponding theoretical calculated value, and the strength of the midspan meets the requirements; Bai [9] took the 480m long city bridge ramp project as an example, measured the static performance and dynamic characteristics based on the finite element method, and carried out the load test, verifying the good performance of this bridge.
At present, dynamic technology plays an important role in the bridge detection. The measurement of the structural response, namely the natural frequency, vibration mode and damping factor, reflects the true structural state of the bridge [10-12]. The static load test can be used to measure the strain and deflection generated under load, and then compared with the theoretical value to obtain the technical status such as the bridge's true bearing capacity [13, 14]. In this paper, taking Yanxi Bridge as an example, the dynamic and static load test was first conducted. Then, the test data was compared with the results of finite element calculation to evaluate the construction quality and structural rigidity of the bridge.
Yanxi Bridge in Yanji City is located on Yanxi Street in Yanji City, with Zhanqian Street in the south and Chaoyang Street in the north. The Yanxi Bridge crosses the Burhatong River and intersects with the east-west main roads of the River Road and Binhe Road along the river. The span layout of the bridge is 18.5m (full width is post-tensioned prestressed concrete slab beam) + 20m (post-tensioned prestressed concrete slab beam) + 14.5m (full width is post-tensioned prestressed concrete slab beam) + 20m (medium width is post-tensioned prestressed concrete slab beam, and outer width is deck-type arch bridge structure) + 6x33m (medium width is prestressed prefabricated small box girder, and outer width is deck-type arch bridge structure) + 2x20m (full width is post-tensioned prestressed concrete slab beam) = 311m. Road grade: urban arterial road;
Design speed: 60Km/h; Load standard: City-A level; Bridge structure design reference period: 100 years; Design service life: 100 years; Design flood frequency: 1/100; Bridge seismic fortification: Class B; Bridge width: 3.5 meters (sidewalk) +3 meters (non-motor vehicle lane) +10.5 meters (vehicle lane) +0.5 meters (collision barrier) +10.5 meters (vehicle lane) +3 meters (non-motor vehicle lane) +3.5 meters ( Sidewalk) = 34.5 meters; Environmental category: Class Ⅱ; Bridge design safety level: Class 1, γ0 = 1.1.
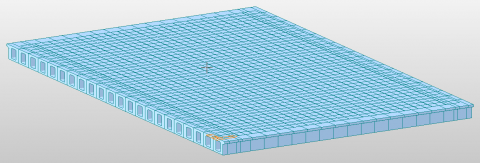
In this paper, the finite element model MADIS/Civil2019 was used to establish a spatial finite element model. Static and dynamic calculations and analyses were carried out, to calculate the internal forces and deformations of the structure caused by the test vehicles under various working conditions. Then, the test data were compared with the actual measured data to evaluate the quality of the Yanxi Bridge project. This bridge is a composite simply supported beam bridge with various spans. The 18.5m-span prestressed concrete bridge girder was taken as an example for verification, as shown in Figure 1.
Figure 1. 18.5m-span prestressed concrete slab beam
4.1 Test load and loading method
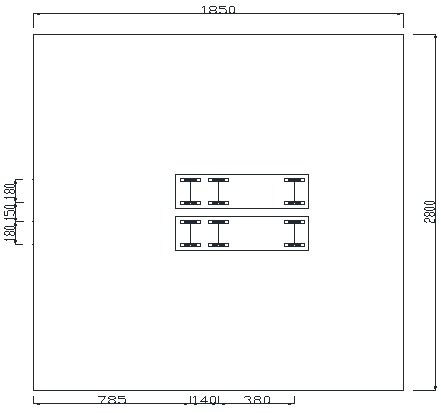
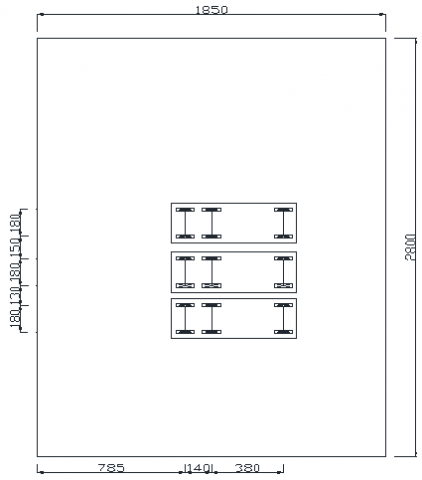
In the load test, 4 three-axle trucks with a weight of about 440kN were used for multi-stage loading. The four trucks were loaded in each working condition for 2 times; two vehicles were placed for the first time, and four for the second time, to ensure the structure safety. The calculations were made using the software MIDAS2019. Due to the small-range difference between the actual vehicle beam and the design vehicle heavy beam, the actual load of each axle of the vehicle was checked and calculated again after the test. Table 1 lists the actual axle weights of the vehicle. The working condition was the maximum positive bending moment in the midspan of 18.5m-span prestressed concrete slab beam. The first-stage loading position of the vehicle in this condition is shown in Figure 2, and the second-stage loading of the vehicle is shown in Figure 3. The load efficiency coefficient of vehicle loading is shown in Table 2.
Table 1. Parameters of the loaded vehicle
|
License plate number |
Axle weight (t) |
|||
|
Front axle |
Middle axle |
Rear axle |
Total weight |
|
|
Jilin H02051 |
9.55 |
17.25 |
17.25 |
44.05 |
|
Jilin H93499 |
10.20 |
17.70 |
17.70 |
45.60 |
|
Jilin H06512 |
7.63 |
18.00 |
18.00 |
43.63 |
Table 2. Calculation of Load efficiency coefficient in the specified testing condition
|
Testing condition |
Design load (kN.m) |
Test load (kN.m) |
Load efficiency coefficient |
|
18.5-span girder |
335.5 |
338.0 |
1.007 |
Figure 2. First-stage loading layout (cm)
Figure 3. Second-stage loading layout (cm)
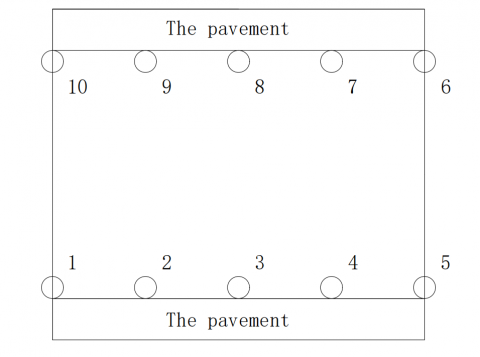
Figure 4. The locations of the dial gauge and the stress measuring points
Table 3. Results of deflection test
|
Testing condition |
No. |
Description of measuring points
|
50% loading |
100% loading |
Unloading value(mm) |
Test results |
|||
|
Theoretical value (mm) |
Test value(mm) |
Theoretical value (mm) |
Test value(mm) |
Calibration coefficient |
Relative residual deflection (%) |
||||
|
18.5m span
|
1 |
Table 1 |
1.35 |
1.27 |
2.91 |
1.67 |
0.02 |
0.57 |
1.2 |
|
2 |
Table 2 |
1.75 |
1.34 |
3.62 |
2.23 |
0.09 |
0.62 |
4.0 |
|
|
3 |
Table 3 |
1.68 |
1.22 |
3.59 |
2.06 |
0.05 |
0.57 |
2.4 |
|
|
4 |
Table 4 |
1.35 |
1.28 |
2.91 |
1.51 |
0.02 |
0.52 |
1.3 |
|
Table 4. Results of strain test
|
Testing condition |
No. |
Initial value |
50% loading (με) |
100% loading SL (με) |
Unloading Su (με) |
Elastic strain Se (με) |
Residual strain Sp (με) |
Relative residual strain $S_{p}^{\prime}$ (%) |
Theoretical value (με) |
Calibration coefficient $\eta_{q}$ |
|
|
A1 |
3742 |
3747 |
3730 |
3741 |
-12 |
-1 |
8.3 |
-20 |
0.6 |
|
B1 |
3983 |
3988 |
3994 |
3984 |
12.5 |
1 |
8 |
17 |
0.74 |
|
|
B2 |
4021 |
4028 |
4035 |
4022 |
||||||
|
B3 |
3781 |
3802 |
3821 |
3782 |
41.5 |
1.5 |
3.6 |
67 |
0.62 |
|
|
B4 |
3332 |
3338 |
3375 |
3334 |
||||||
|
B5 |
3663 |
3672 |
3681 |
3665 |
18 |
1.5 |
8.3 |
32 |
0.56 |
|
|
B6 |
3823 |
3831 |
3841 |
3824 |
||||||
|
A2 |
4216 |
4208 |
4199 |
4215 |
-17 |
-1 |
5.9 |
-32 |
0.53 |
|
|
B7 |
3802 |
3810 |
3818 |
3804 |
16.5 |
1.5 |
9.1 |
32 |
0.52 |
|
|
B8 |
3912 |
3919 |
3929 |
3913 |
4.2 Measuring point location and data
In the test, the deflection was collected using a 0-50mm dial gauge. The dial gauges were arranged at the middle edge of the 18.5m-span girder midspan and the lower edge of the side span beam for deflection test; Changsha Yankang YKYB-1140I vibrating wire sensor was used for strain measurement and data collection, and they were also arranged in the test section of the midspan and side span. Figure 4 shows the schematic diagram of the sensors arrangement.
4.3 Static load test results
The vertical deflection test results of the first-stage loading and the second-stage loading are shown in Table 3. The deflection calibration coefficient in the table is the ratio of the second-stage loading test value minus the residual deformation value to the theoretical value. The deflection symbol is "+" downwards and "-" upwards in mm. Table 4 lists the strain test results of the first-stage loading and second-stage loading. The strain calibration coefficient in the table is the ratio of the second-stage loading test value minus the unloading value to the theoretical value. The tensile strain is "positive" and the compressive strain is "negative".
The vertical deflection test results show that:
(1) From the relative residual deformation calculated in the table, it can be seen that under test load, the relative residual deformation of the unloaded test section was within 20% of the specified value, indicating that the deformation generated by the structure can be recovered, and the structure is in a flexible working state.
(2) Under the test load, the actual measured deflection of each control section was less than the theoretical calculated value, the deflection calibration coefficient was 0.52-0.79, below 1.0, and the maximum measured deflection was far less than L/600; the structural rigidity meets the design requirements.
The strain test results show that:
(1) The measured strain calibration coefficient at the measuring point of each test cross-section under loading conditions was between 0.32 and 0.74, and the strain calibration coefficients were all less than 1, indicating that the actual state of the structure is better than the theoretical state.
(2) The relative residual strain rate of the measured strain was between 3.6% and 9.5%, both lower than 20%, indicating that the structure has a certain elastic recovery capacity.
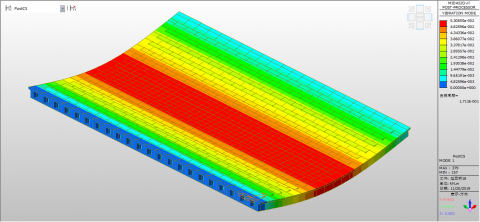
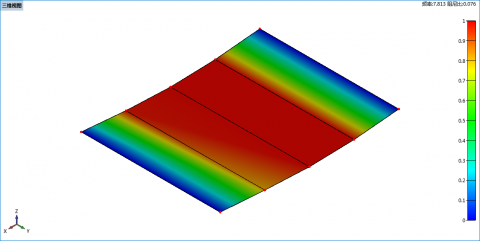
At present, the dynamic load test of the bridge is theoretically mature and then widely used. It is not only used in the inspection of old bridges, but also the acceptance of new bridges, as an extremely important part. The dynamic load test can measure the dynamic parameters of the bridge, to obtain the damping ratio, natural frequency, and impact coefficient of the bridge. Under the dynamic load of the bridge, its forced vibration response includes the dynamic displacement, dynamic stress and impact coefficient. The dynamic load test is the use of non-artificial excitation method to collect the micro-amplitude vibration information under the environmental excitation of microseism, water flow, wind load and the like when the brick traffic is prohibited [15]. Through the modeling analysis, the first-order vibration mode of an 18.5m-span prestressed concrete slab beam was obtained, as shown in Figure 5. The DHDAS dynamic signal acquisition and analysis system was used for data acquisition, and the vertical vibration pickup arrangement was adopted, as shown in Figure 6. The spectrum analysis method was used to identify the dynamic modal parameters of the structure, to obtain the first-order mode through the tests (Figure 7). The theoretical frequency of the model was 5.845Hz, the measured frequency was 7.813Hz, and the measured damping ratio was 7.6%.
Figure 5. 1st order vertical bending pattern of the 18.5m-span girder
Figure 6. Sensors layout
Figure 7. The measured first-order pattern
(1) Under the test load, the measured deflection of each control section was less than the theoretical calculation value, the deflection calibration coefficient was less than 1.0, the maximum measured deflection was far less than L/600, and the structural stiffness meets the design requirements; the strain values at the key measuring points of each test section were less than the theoretical value, the strain calibration coefficient was below 1.0, and the structural strength meets the design requirements; the relative residual deformation measured by the displacement test control section was mostly within 20% of the standard requirements, indicating that the deformation of the structure can be restored in time after unloading, and the structure is in an elastic working state.
(2) The measured frequency> theoretical frequency of Yanxi Bridge indicates that the actual stiffness of the structure is greater than the theoretical value; the damping ratio of the first-order vertical bending pattern in the bridge structure was 7.6%, which is within the normal range 0.01- 0.08 of the bridge structure.
[1] Gatti, M. (2019). Structural health monitoring of an operational bridge: A case study. Engineering Structures, 195: 200-209. https://doi.org/10.1016/j.engstruct.2019.05.102
[2] Lam, H.F., Yang, J., Au, S. (2015). Bayesian model updating of a coupled-slab system using field test data utilizing an enhanced Markov chain Monte Carlo simulation algorithm. Engineering Structures, 102: 144-155. https://doi.org/10.1016/j.engstruct.2015.08.005
[3] Beck, J.L., Katafygiotis, L.S. (1998). Updating models and their uncertainties. I: Bayesian statistical framework. Journal of Engineering Mechanics-asce, 124(4): 455-461. https://doi.org/10.1061/(ASCE)0733-9399(1998)124:4(455)
[4] Katafygiotis, L.S., Beck, J.L. (1998). Updating models and their uncertainties. II: Model identifiability. Journal of Engineering Mechanics, 124(4): 463. https://doi.org/10.1061/(ASCE)0733-9399(1998)124:4(463)
[5] Gara, F., Nicoletti, V., Carbonari, S., Ragni, L., Dallasta, A. (2020). Dynamic monitoring of bridges during static load tests: influence of the dynamics of trucks on the modal parameters of the bridge. Journal of Civil Structural Health Monitoring, 10(2): 197-217. https://doi.org/10.1007/s13349-019-00376-1
[6] Laura, M., Francesco, C., Antonio, F. (2020). Static and dynamic testing of highway bridges: a best practice example. Journal of Civil Structural Health Monitoring, 10(1): 43-56. https://doi.org/10.1007/s13349-019-00368-1
[7] Ye, J. (2017). Research on dynamic and static load test in bridge inspection. Urban Roads Bridges & Flood Control, 2017(7): 225-229. https://doi.org/10.16799/j.cnki.csdqyfh.2017.07.070
[8] Zeng, B.C., Du, P., Sun, X.W. (2016). Static loading test and result analysis of prestressed concrete hollow slab (20m). Construction Technology, 45(S1): 274-277.
[9] Bai, B.F. (2014). Performance evaluation of a municipal bridge based on static and dynamic load test. Shanxi Architecture, 40(35): 202-204. https://doi.org/10.3969/j.issn.1009-6825.2014.35.111
[10] Benedettini, F., Dilena, M., Morassi, A. (2015). Vibration analysis and structural identification of a curved multi-span viaduct. Mechanical Systems and Signal Processing, 54: 84-107. https://doi.org/10.1016/j.ymssp.2014.08.008
[11] Lamonaca, F., Scuro, C., Grimaldi, D., Olivito, R.S., Sciammarella, P.F., Carni, D.L. (2019). A layered IoT-based architecture for a distributed structural health monitoring system. Acta Imeko, 8: 45. https://doi.org/10.21014/acta_imeko.v8i2.640
[12] Scuro, C., Sciammarella, P.F., Lamonaca, F., Olivito, R.S., Carni, D.L. (2018). IoT for structural health monitoring. IEEE Instrumentation & Measurement Magazine, 21(6): 4-14. https://doi.org/10.1109/MIM.2018.8573586
[13] Zheng, Y.W., Fox, P.J., Shing, P.B., McCartney, J.S. (2019). Physical model tests of half-scale geosynthetic reinforced soil bridge abutments. I: Static loading. Journal of Geotechnical and Geoenvironmental Engineering, 145(11): https://doi.org/10.1061/(ASCE)GT.1943-5606.0002152