Sreenivasulu Annam*![]() | Subramanian Srikrishna
| Subramanian Srikrishna![]() | Sangameswara Raju Prabandhankam
| Sangameswara Raju Prabandhankam![]() | Ganesan Sivarajan
| Ganesan Sivarajan![]()
© 2023 IIETA. This article is published by IIETA and is licensed under the CC BY 4.0 license (http://creativecommons.org/licenses/by/4.0/).
OPEN ACCESS
Past studies, current conditions and future energy needs lead to a man’s move to renewable energy sources, especially solar energy due to its benefits such as high availability, pollution, low gas emissions, low maintenance costs, limited site selection, no machine noise etc. Solar systems, however, have their drawbacks, which work well with different temperature and solar irradiance conditions. To get high energy in those conditions, following the point of high energy is very important in Photovoltaic systems. To date many alternatives to high power was proposed and successfully implemented. In this paper the best perturb strategies were proposed and look at the genre with the MATLAB / SIMULINK Environment where there are solar panels to serve as good reference in upcoming users of the direct of great energy in Photovoltaic systems.
MPPT methods, photovoltaic system, perturb and observe
With the purpose of increasing electricity generation and contributing to national income. Because nonrenewable energy sources such as petroleum, coal, and others have limited supplies and rising prices, renewable energy sources, particularly photovoltaic energy, offer another hopeful option because they are easily available, recyclable, and less efficient while offering cost savings [1-3]. As a result, it appears that there is an increasing need for solar generation in both on-grid and off-grid applications. It is critical for the construction of a solar system to extract large amounts of energy from a photovoltaic cell in order to improve photovoltaic system efficiency and reduce overall expenses. There is a working area of the solar cell that can provide the most electricity at certain points throughout its operation. The most essential issue with Maximum Power Point Tracking is the automatic estimation of the yield (output) voltage or current when the photovoltaic range produces more production power under the varied irradiation and heat conditions that are available. To attain a high level of power, the load lines must be adjusted in various degrees of irradiation and temperature. Power point tracking not only increases the amount of power that can be supplied from a solar module to a load, but it also enhances the amount of time that a photovoltaic system can remain active [4]. A variety of MPPT techniques have been developed and implemented [5, 6]. As a result, a high-power tracking mechanism that is both efficient and effective is required. This procedure should be able to track the high power point under all natural conditions and compel the photovoltaic system into functioning at that high power point. Users are frequently perplexed when it comes to choosing the MPPT mechanism for their app. As a result, it is critical to create a comprehensive review of effective MPPT processes for use in future work.
In this paper mainly concentrates on most widely used and more convenient method perturb and observe and it is organized into different sections like Introduction in section I, section II includes block diagram of Photovoltaic system, section III consists Mathematical Modelling of Photovoltaic cell, section IV, consists DC-DC converter, Section V is MPPT classification, and Perturb and Observe Methods, In section VI simulation and test results are included, Section VII consists Conclusion and finally References are provided.
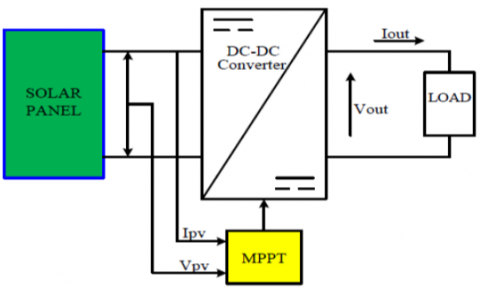
Figure 1. Schematic diagram of photovoltaic system
Figure 1 represents basic illustration of Photovoltaic System with MPPT. When the same number of photovoltaic cells are connected in series to make a solar array, the voltage and current of the same sort of photovoltaic cells will increase. The competition (resistance) of the panel that is set up to work with the load is altered by using the DC-to-DC converter's resistance, which changes depending on the painting cycle [7]. The lift converter's output is a solar panel that is connected to the entry, and the weight is connected to the output of the lift converter. The MPPT block is in charge of the judgements taken and the signs that the solar panel produces. Strength conversion was given to a series of pulses that were thought to be discharges from the MPPT block. These pulses then control how the Converter operates [8], ensuring that the photovoltaic device operates during the time when the most electricity is produced (MPP). Figure 2 displays the total performance of the photovoltaic cell system.
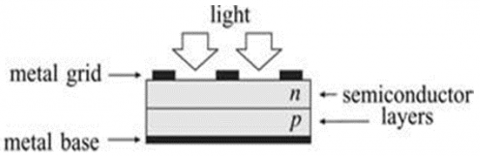
The theory at the core of how it generates power from sunlight is the photovoltaic effect (in the form of photons). Photons are capable of holding all of the energy and power found in the sun's spectrum. A photovoltaic cell may absorb photons when exposed to light, which can subsequently be utilised to generate energy when the light reaches the cell.
Figure 2. Structure of photovoltaic cell
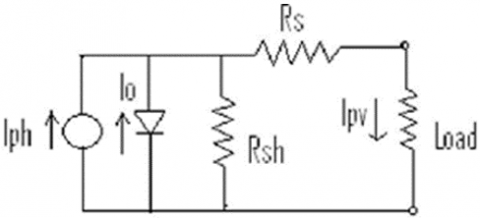
Figure 3 shows a modelled photo voltaic mobile using a corresponding electric circuit. Current supply, a diode, a resistance series Rs, a shunt resistance, and cargo are all included in the model. Radiation influences the current supply.
Figure 3. Equivalent circuit of photovoltaic cell
The equations of Photovoltaic module are as follows:
Output current of Photovoltaic module is:
$I_{p v}=N_p \times I_{p h}-N_p \times I_o\left[\exp \left(\frac{q\left(V_{p v}+I_{p v} \times R_s\right)}{N s k T c A}\right)-1\right]-\frac{V_{p v}+I_{p v} \times R_s}{R_{s b}}$ (1)
Output voltage of Photovoltaic cell is:
$V_{p v}=\frac{N s A K T}{q}\left[\ln \left(\frac{N_p \times I_{p h}-I_{p v}}{N_p \times I_o}\right)+1\right]-I_{p v} R_s$ (2)
Photovoltaic cell yield (output) voltage is a photocurrent pastime mainly dictated by means of the modern-day load relying on the extent of solar radiation for the duration of hobby. Module picture cutting-edge:
$I_{p h}=\left[I_{s c}+K_i(T-298) \times \frac{\lambda}{1000}\right]$ (3)
Module turn around (reverse) saturation current:
$I_{r s}=\frac{I_{s c}}{\exp \left(\frac{q \times V_{o c}}{N s A K T}\,\,\,\,\,\,\,\,-\,\,1\right)}$ (4)
Module saturation current:
$I_o=I_{r s}\left(\frac{T}{T_r}\right)^3 \exp \left\{q \times E_{g o} / B \times K\left[\frac{1}{T_r}-\frac{1}{T_k}\right]\right\}$ (5)
where,
Iph: Light is currently produced in Photovoltaic cell
Io: Photovoltaic cell filling current in (A)
I: Current output of Photovoltaic cell (A)
V: Power output of Photovoltaic cell (V)
Ns: The number of cells connected to the series
Np: Number of cells connected in parallel
A: Positive view=1.6
K: Boltzmann regular=1.3805e-23Nm/K.
T: Cell heat acting on Kelvin
Tr: Reference temperature for Kelvin
q: Electron charge=1.6e-19 coulombs
Ki: Temperature coefficient
Sc: Short circuit current (A)
Irs: Reverse saturation current in (A)
Ego: Power gap of silicon belt=1.1ev
Rsc: Series resistance
Rsh: Shunt resistance
B: Positive view=1.6
Λ: Photovoltaic cell light (w/m2)
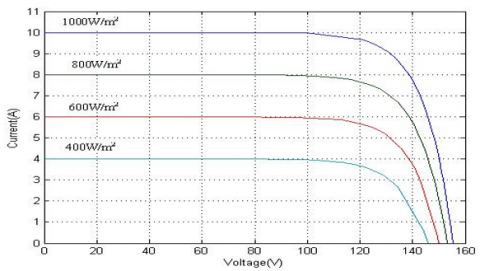
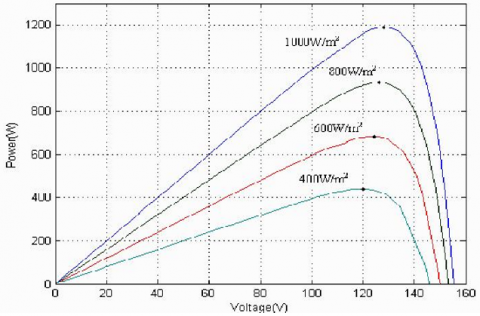
Multiplication of voltages, cells linked in collection deliver the entire variety of sun panels and the present day variety of the to be had panel, by means of dividing the current cellular and the number of cells connected in the equal way. Normally the electric and current results of the panel will change relying on temperature and light irradiance conditions. The V and Photovoltaic features of the Photovoltaic panel [9] of different temperatures and sunlight are represented on Figures 4 (a) and (b).
Figure 4. (a) I-V characteristics sun oriented exhibit for various illuminations and consistent temperature of 25℃
Figure 4. (b) P-V characteristics sun powered exhibit for different lights (irradiations) and consistent temperature of 25℃
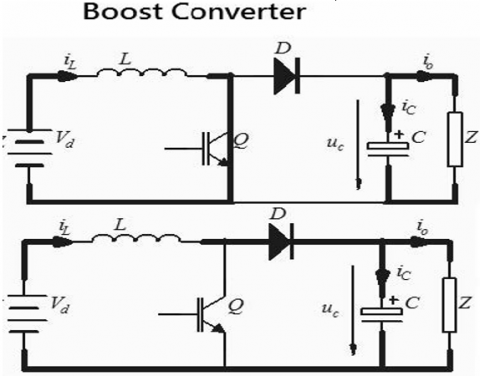
The output of the photovoltaic panel is sent on to the DC-DC converter so that it can either Buck or Boost the voltage. This is demonstrated in Figure 5. It serves this purpose, and one of the other names for it is the step-up converter. Inductor, diode, and capacitor are all components of it. Turning the switch on and off will sometimes cause the increase converter to function. While the transfer is in the "ON" position, the inductor stores the power, and when it is in the "OFF" position, the quantity of inductor strength and supply appears in the "yield" (output) position. The normal yield (Output) voltage is dictated by the accompanying condition given:
Vo/Vin =T/t off = 1/1 – D (6)
Figure 5. Circuit diagram of boost converter
There are many MPPT techniques, but they can be divided into three categories: offline techniques that rely heavily on solar mobile modelling, online techniques that do not rely on solar mobile modelling, and hybrid techniques that combine the two methods described above. When discussing offline and offline procedures, the phrases "model" and "non-version methods" can be used interchangeably. Both of these expressions refer to offline processes. Offline techniques, in addition to radiation, take into account solar panel-specific factors. Temperature, open-circuit voltage (VOC), and short-circuit current (ISC) are among the variables. These statistics are critical in the development of the control signal required to propel a solar-powered mobile device to its maximum power output (MPP). The control indicators for online methods are generated from the Photovoltaic output frequencies that are either the fastest or the most common. The control signal is used within the Photovoltaic system to ensure that the optimal route is free of disruptions. It is also adjusted to the voltage, current, or hobby cycle (manage signal), and it finally determines the quantity of output power produced. As a result, monitoring excessive output power levels necessitates monitoring output levels close to large volumes. In terms of hybrid additives, we have the following: Maximum PowerPoint tracking consists of two stages: the first is the single Maximum PowerPoint size, and the second is the single direct Maximum PowerPoint modify. Ratings for Maximum Power Point, with a focus on employing offline tactics to get a factor that is comparable to Maximum PowerPoint. Direct MPP management is a planning process that is usually done online and consists of a series of instructions delivered in a step-by-step fashion. The MPPT type, which is one of the most important processes, is proposed within the Photovoltaic machine analysis programme with the purpose of being explored more thoroughly in the following sections of this article.
Perturb and observe method
In this procedure, it continuously interrupts the voltage and contemporary power of the Photovoltaic, and the power from which it compares with the electricity that came before it in order to decide which version will come next. This transformation indicates that it will proceed to the level that comes after it in order to obtain the MPP. Here in particular, the three approaches—Perturb and Observe—come into play (P&O).
a). P&O with fixed perturb
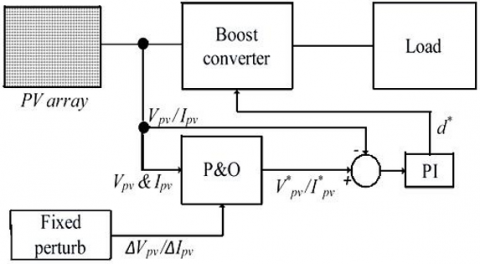
Figure 6. Block diagram of P&O MPPT
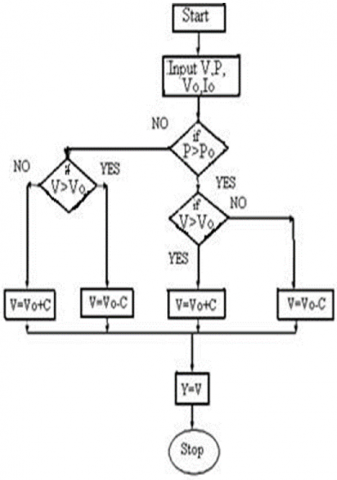
For clarity, Figure 6 shows the P&O approach block diagram. This mountain is currently being climbed by the software. Even if it is of much less relevance, the light's fading helped to reduce the intensity of the enjoyment. This method will only use a small number of sensors to keep things reliable. When you walk, you generate force, which the sensor will experience. After the working energy has been sampled, the P&O set of rules converts the energy to MPP by weakening the voltage of the photovoltaic array. Perturbed means to go upward or downward. A photovoltaic array's output strength is proportional to its voltage; as a result, an increase in voltage causes an increase in the array's output strength. As a result, the voltage will increase as the deviation occurs once more. Unless strength is added to the Maximum Point, this approach will remain in effect. Every time there is a period of time when the electric current is increasing, the electricity of an equivalent number of photovoltaic cells decreases. This causes the interruption to be more severe at this time, which results in a reduction in the amount of energy delivered. The MPP is accessible by the system's operating device using this method. This method uses the alternate processes that are shown in the glide chart diagram below Figure 7 in order to obtain the best electricity element feasible. the block diagram is depicted in Figure 8 below. with reference to the Adaptive P&O Technique. In traditional P&O, it is necessary to cause the disruption of an energy strain that is equal to or already present [10].
Figure 7. Stream outline chart of P&O MPPT strategy
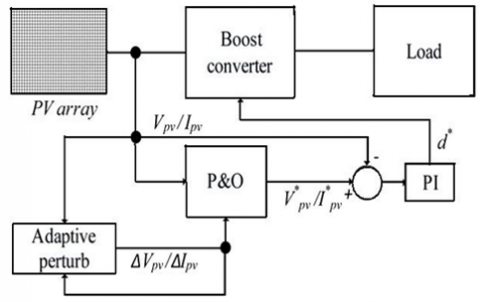
b). P&O with adaptive perturb
Figure 8. Block diagram of adaptive P&O technique
The size of the perturbation slows down the system. So the problem of speed compared to the oscillations exists in the standard P&O system with a fixed Perturb esteem. To stay away from this issue using the flexible perturb strategy. In this method, the first major steps of the village are used to reach MPP faster, and as the MPP is reached, the amount of perturb is reduced to avoid large outputs around MPP. This approach creates a dynamic distortion by using an error between two consecutive power values. In general, at the beginning of the process, this error is high, after which it decreases as the MPP approaches a stable position. Unlike a closed system error signal is minimized, here the PI controller is used as a generator that occurs with perturb value by reducing the error signal between the power values.
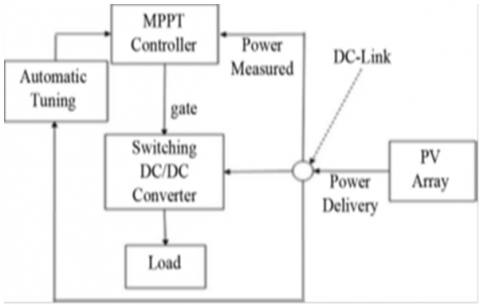
c). Modified adaptive P&O MPPT technique
Figure 9. Block diagram of modified adaptive P&O MPPT
Instead of using equal or current-voltage voltage as a perturb sign, this approach uses the conversion rate. In Figures 9 and 10, a block diagram and MAP & O Stream outline map are displayed side by side. This method uses automated parameter adjustment to calculate the value of perturbing. In P&O, the conversion process uses an alternative that does not resolve the conflict between strong country performance and strong reaction. Generally speaking, the size of the boom within the hobby cycle should be small in a stable condition and excessive during a short period of time. Through the use of a quote, the interest cycle price can be automatically tuned.
a(k)=M*∆P/a(k-1) (7)
where, a(k)=perturb value of duty cycle:
a (k-1)=historic value of a(k) (8)
Δp=p(k)–p(k-1) (9)
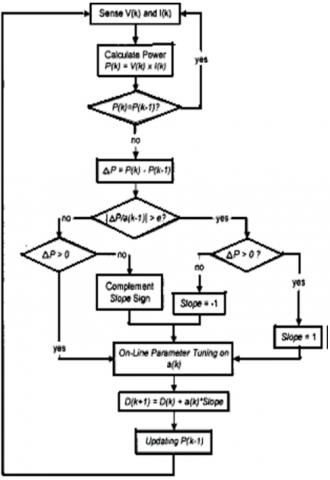
The power conversion is too high at the start of the procedure, causing the tuner to supply an extra fee of "a" from the previously mentioned amount. This enormous array of "a" satisfies the desire for a prompt response. As the strength conversion is low in a solid situation, the tuner will allow the controller to provide only a tiny amount of "a", which is utilised to reduce the stability of the solid situation and to satisfy the requirements for a solid response [11]. This results in several activity cycles, each of which produces transient reactions and minimal oscillation demands [12-14]. This issue is also resolved by altering the control algorithm [15-18] depicted in graph chart Figure 8, where "P" and "D" correspond to the electricity level of Photovoltaic and the number of work cycles, respectively. P / a(k-1) is a state of flux. If the solar fluctuation causes a power difference, then the controller indicates the value of ∆P / a(k-1) is greater than the "e" limit, then the increase in the activity cycle is in the same position as P. Disruption indicator is addressed by "Slope" in the stream outline chart (Figure 8). The system is in the correct position when the value of ∆P / a(k-1) is small. The MPPT effect is provided to amplify the converter.
Figure 10. Stream outline chart of modified adaptive P&O MPPT
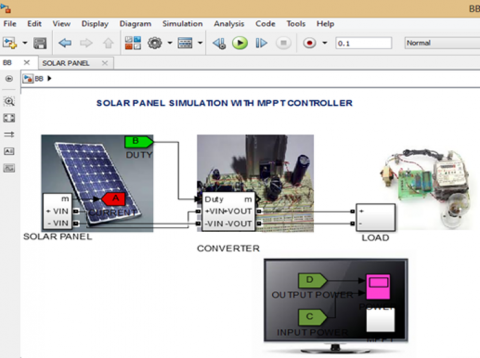
It is possible to get the greatest possible energy thing from phase II all the way up to section V by using the MATLAB SIMULINK region simulated Simulink Photovoltaic device. This is something that can be done. The manufacturer decided on this course of action. Eleven. Analyzing the proposed method for a diffusion of solar and temperature conditions in order to enhance the performance and reduce the overall cost of Photovoltaic structures, it is essential to extract a high quantity of power from the sun cell all through the process of the device's design. This can be accomplished by using a diffusion of solar and temperature conditions.
From the Figure 11 it is observed that the maximum power point for with and without MPPT methods are tabulated in Table 1.
According to Table 1, it can be seen that the absence of MPPT techniques results in a very low level of system efficiency—only 27 percent—while the presence of adaptive techniques results in a level of system efficiency that is higher than that of the fixed perturbation approach (71 and 73 percent, respectively).
Figure 11. Simulink diagram of photovoltaic system
Table 1. Correlation of MPPT techniques
|
Methods of MPPT |
Voltage (V) |
Current (A) |
Power (W) |
Efficiency (%) |
|
|
Without MPPT |
PHOTOVOLTAICArray |
149 |
2 |
398 |
27 |
|
With MPPT |
P&O |
138 |
7 |
966 |
64 |
|
Adaptive P&O |
133 |
8 |
1064 |
71 |
|
|
Modified Adaptive P&O |
136 |
8 |
1088 |
73 |
|
The maximum energy factor tracking strategies are those that are utilised in order to track the greatest amount of energy from a solar-powered (solar) machine. In order to track oscillations and associated exchange-off problem, the P&O method with a constant perturb esteem is utilised. But it is unable to song for a short alternate under conditions involving the weather. As a result, adaptive tactics are utilised so as to achieve greater performance. This article presents a simulation of a Photovoltaic array as well as a correlation analysis of several various techniques, including P&O, Adaptive P&O, and Modified Adaptive P&O Approaches. The results of implementing all of these different tactics have resulted in a greater level of performance being documented in versatile strategies in comparison to constant perturbation methods.
[1] Wu, T.F., Chang, C.H., Liu, Z.R., Yu, T.H. (1998). Single-stage converters for photovoltaic powered lighting systems with MPPT and charging features. In APEC'98 Thirteenth Annual Applied Power Electronics Conference and Exposition, Anaheim, CA, USA, pp. 1149-1155. https://doi.org/10.1109/APEC.1998.654041
[2] De Broe, A.M., Drouilhet, S., Gevorgian, V. (1999). A peak power tracker for small wind turbines in battery charging applications. IEEE Transactions on Energy Conversion, 14(4): 1630-1635. https://doi.org/10.1109/60.815116
[3] Ameli, M.T., Moslehpour, S., Shamlo, M. (2008). Economical load distribution in power networks that include hybrid solar power plants. Electric Power Systems Research, 78(7): 1147-1152. https://doi.org/10.1016/j.epsr.2007.09.009
[4] Joni, Numberi, J.J., Tambing, E., Siregar, S.P., Setiawan, R.P.A., Tambunan, A.H., Siregar, K. (2023). Evaluating the application of bubble wet scrubber systems for gas cleaning in gasification. Instrumentation Mesure Métrologie, 22(1): 21-27. https://doi.org/10.18280/i2m.220103
[5] Salas, V., Olias, E., Barrado, A., Lazaro, A. (2006). Review of the maximum power point tracking algorithms for stand-alone photovoltaic systems. Solar Energy Materials and Solar Cells, 90(11): 1555-1578. https://doi.org/10.1016/j.solmat.2005.10.023
[6] Esram, T., Chapman, P.L. (2007). Comparison of photovoltaic array maximum power point tracking techniques. IEEE Transactions on Energy Conversion, 22(2): 439-449. https://doi.org/10.1109/TEC.2006.874230
[7] Chermitti, A., Boukli-Hacene, O., Mohamed, B. (2012). Improvement of the "perturb and observe" MPPT algorithm in a photovoltaic system under rapidly changing climatic conditions. International Journal of Computer Applications, 56(12).
[8] Altas, I.H., Sharaf, A.M. (2007). A photovoltaic array simulation model for Matlab-Simulink GUI environment. In 2007 International Conference on Clean Electrical Power, Capri, Italy, pp. 341-345. IEEE. https://doi.org/10.1109/ICCEP.2007.384234
[9] Domathoti, B., Ch, C., Madala, S., Berhanu, A.A., Rao, Y.N. (2022). Simulation analysis of 4G/5G OFDM systems by optimal wavelets with BPSK modulator. Journal of Sensors, 2022. https://doi.org/10.1155/2022/8070428
[10] Abdelsalam, A.K., Massoud, A.M., Ahmed, S., Enjeti, P.N. (2011). High-performance adaptive perturb and observe MPPT technique for photovoltaic-based microgrids. IEEE Transactions on Power Electronics, 26(4): 1010-1021. https://doi.org/10.1109/TPEL.2011.2106221
[11] Xiao, W., Dunford, W.G. (2004). A modified adaptive hill climbing MPPT method for photovoltaic power systems. In 2004 IEEE 35th Annual Power Electronics Specialists Conference (IEEE Cat. No. 04CH37551), Aachen, Germany, Vol. 3, pp. 1957-1963. IEEE. https://doi.org/10.1109/PESC.2004.1355417
[12] De Cesare, G., Caputo, D., Nascetti, A. (2006). Maximum power point tracker for portable photovoltaic systems with resistive-like load. Solar Energy, 80(8): 982-988. https://doi.org/10.1016/j.solener.2005.07.010
[13] Salas, V., Olias, E., Lazaro, A., Barrado, A. (2005). New algorithm using only one variable measurement applied to a maximum power point tracker. Solar Energy Materials and Solar Cells, 87(1-4): 675-684. https://doi.org/10.1016/j.solmat.2004.09.019
[14] Lim, Y.H., Hamill, D.C. (2000). Simple maximum power point tracker for photovoltaic arrays. Electronics Letters, 36(11): 1.
[15] Liu, F., Kang, Y., Zhang, Y., Duan, S. (2008). Comparison of P&O and hill climbing MPPT methods for grid-connected PV converter. In 2008 3rd IEEE Conference on Industrial Electronics and Applications, Singapore, pp. 804-807. IEEE. https://doi.org/10.1109/ICIEA.2008.4582626
[16] Sreenivasulu, A., Subramanian, S., Raju, P.S. (2023). Design and simulation of advanced intelligent deep learning MPPT approach to enhance power extraction of 1000 W grid connected photovoltaic system. Journal of Intelligent & Fuzzy Systems, 44(3): 3987-3998. https://doi.org/ 10.3233/JIFS-221465
[17] Piegari, L., Rizzo, R. (2010). Adaptive perturb and observe algorithm for photovoltaic maximum power point tracking. IET Renewable Power Generation, 4(4): 317-328. https://doi.org/10.1049/iet-rpg.2009.0006
[18] Femia, N., Granozio, D., Petrone, G., Spagnuolo, G., Vitelli, M. (2007). Predictive & adaptive MPPT perturb and observe method. IEEE Transactions on Aerospace and Electronic Systems, 43(3): 934-950. https://doi.org/10.1109/TAES.2007.4383584