Tariq M. Younes
OPEN ACCESS
The non-linearity analysis is one of the most important issue when defining the static characteristics of temperature sensors, namely thermoresistive sensors. The purpose of this work is to propose a simple approach based on measuring the signal conditioning parameters to define the model of measured temperature. The developed approach is utilized to obtain a relationship between the bridge parameters and the final measured value of temperature. The data acquisition and signal processing are carried out by Arduino Uno and LabVIEW software.
signal conditioning, thermoresistive, bridge parameters, non-linearity analyses
Most of technological processes are now on the path to automation. Since controlling of numerous mechanisms and machines is simply unthinkable without accurate measurements of various physical quantities. Among these physical quantities are the measurement of pressure, measurement of angular velocity, measurements of linear displacement and temperature and many other quantities. But the most common (about 50 %) are temperature measurements. For example, the average nuclear power plant has approximately 1500 control (measuring) points for temperature measurement, and large-scale chemical production has about 20 thousand of them [1-3].
Another example of temperature measurement is when temperature sensors are used to monitor the air temperature in rooms, for example, in storages. On the other hand, in boiler rooms, the temperature sensor ensures that the temperature of steam (gas) or liquids (water, oil, etc.) is kept constant to ensure safety and comfort conditions [4].
In hydraulic drive system, the set fluid or oil temperature is maintained to ensure the efficiency of the equipment. As well as in many other industries, the main production factor is temperature [5].
Since the measurement range and their conditions can vary for different types of sensors (and primary transducers) that have been developed in terms of accuracy, noise immunity and speed response. Whatever type of temperature sensor, the principle of conversion is common to all. Namely: the measured temperature is converted into an electrical value). This is due to the fact that it is easy to transmit an electrical signal over long distances (high speed reception and transmission).
A temperature sensor is a test instrument that reports the temperature in a system that it controls. In this case, the temperature value is determined using an electrical signal at the output of the instrument, for example the instrument could be a thermal resistance which can vary according to the temperature change [6].
Thermal resistor is also sometimes called a resistance thermometer. The principle of operation is based on the measurement of platinum or copper calibrated resistance.
Temperature sensors can be divided into non-contact (or contactless) temperature sensors and contact temperature sensors. Contactless temperature sensors apply the principle of measuring the power of infrared radiation that comes from any object (cold or hot). Non-contact temperature sensors are used in industries where it is difficult to access the measured parts or, if necessary, to measure high temperatures - from 1500 to 3000 °C [7].
Some models of such contactless sensors are specifically designed to measure the temperature of transparent objects - film and glass, there are sensors for working in dusty or smoky environments.
Contact temperature sensors are mainly represented by thermocouples and thermal resistances. This method of temperature measurement is based on the fact that various metals and semiconductors change their electrical resistance with temperature, as a result of which an electrical signal is obtained at their outputs.
As a special case that should be noted is silicon temperature sensors. The principle of their work is based on the ability of silicon, as a semiconductor, to change its own electrical resistance due to temperature changes. Such temperature sensors, as a rule, are equipped with additional amplification and signal processing circuits, which allows to connect such a temperature sensor directly to a computer [8-12].
Thermal resistive temperature sensors are based on the principle of variation of electrical resistance (semiconductor or conductor) with temperature. They were developed for the first time for oceanographic research. The main element of these researches is a thermistor - an element that changes its resistance depending on the ambient temperature [13].
The undoubted advantages of thermal sensors of this type are: long-term stability, high sensitivity, as well as the simplicity of developed interfacing circuits.
Depending on the materials used to produce thermal resistance sensors, there are Ref. [14-16]:
1) Resistive temperature detectors (RTD). These sensors consist of metal, most often platinum. In principle, any metal changes its resistance when exposed to temperature, but platinum is used since, it has long-term stability, strength and reproducibility of characteristics. Tungsten can also be used to measure temperatures above 600 °C. The disadvantage of these sensors is the high cost and non-linearity of the characteristics.
2) Silicon resistive sensors. The advantages of these sensors are good linearity and high long-term stability. Also, these sensors can be embedded directly into the microstructure.
3) Thermistors. These sensors are made of metal-oxide compounds. Sensors measure only absolute temperature. Significant disadvantages of thermistors are the need for calibration and high nonlinearity, however, when carrying out all the necessary settings, they can be used for precision measurements.
Semiconductor sensors register changes in the characteristics of the p–n junction under the influence of temperature. In practice, any diode or bipolar transistor can be used as thermal sensor. The dependence of the voltage across the transistor on the absolute temperature (in Kelvin) makes it possible to implement the transistor as an accurate sensor.
The advantages of such sensors are simplicity and low cost, linearity of characteristics, small error. In addition, these sensors can be formed directly on a silicon substrate. All this makes semiconductor sensors very popular.
This article is concerned about the quality of research results when measuring temperature using RTD. It was shown that in many research papers and reports, the error or the errors of measurement(s) are described in the intermediate measurement results or the final conclusions of the experiment.
The true value of temperature can be established only by taking an infinite number of measurements, which is impossible to implement in practice and this true value is unachievable, and for error analysis, the actual value of temperature is used for analysis of errors using the most advanced measurement method and the most high-precision measuring instruments. Thus, the measurement error is a deviation from the real value ∆ = tM- ta. where tM. - the value of temperature obtained on the basis of measurements; ta. - the actual value of temperature.
In this paper, the author, presents a novel approach of error analysis of resistive temperature detector according to the signal conditioning parameters to which the sensor is connected into.
The error analysis of resistive temperature sensors is considered as one of the most important issue in measurement and instrumentation. In work [17], the author makes a comparison between different RTD signal conditioning circuits. It was shown that accuracy improvement of the measured temperature depends on the selected temperature sensor, the signal conditioner and the area where the temperature sensor is implemented.
The authors of work [18] present a software-based approach to calculate the error of measurement when RTD is used to measure temperature. The statistical methods of analyses are utilized to calculate the error of measurement and the confidence intervals. It was shown that uncertainties will be higher for the higher standard deviation.
In work [19], the authors provided uncertainty analysis of temperature–resistance relationship of temperature sensing fabric. Experimental data were collected and analysed by LabVIEW software. The authors utilized regression model to analyse the error of measurements. It was shown that, the temperature and resistance values are not only repeatable, but reproducible, with minor changes.
In work [20], the author provides the description of errors that are important for both passive and active transducers, including resistive temperature sensor. The work illustrates the error of measurement as an important issue in theoretical study of principles of operations for active and passive transducers.
RTD is also used in work [21] to test uncertainty analysis of temperature measurement system using interval arithmetic. It was shown that, using the interval method to analyse the uncertainty in the temperature measurement system provides a coincidence, which certainly includes all the possibilities resulting from the full range of input uncertainty.
In work [22], the authors focus on the problems of connecting temperature sensors into Analog-to-Digital Converter (ADC). The aim of their work is to eliminate the effect of lead wire connections which plays a great role in sensitivity analyses and error of measurement.
The literate review shows that most of researches regarding error analyses (when RTD is used to measure temperature of an object), and these researches can be classified into the following categories
In this paper the author illustrates a novel approach of non-linearity analyses for resistive temperature sensors, namely RTD. The approach is based on proposing a nonlinear representation of the measured value as a function of signal conditioning circuit parameters.
We describe in a mathematical form the conversion of the measured signal, assuming that the temperature of the controlled medium does not change with time.
The dependence of the resistance of a metal thermoresistor on the temperature with sufficient accuracy for practice is described by a power series [22]:
$R_{t}=R_{0}\left(1+\alpha_{1} t+\alpha_{2} t^{2}+\cdots+\alpha_{n} t^{n}\right)$ (1)
In this case, Eq. (1) is called the calibration characteristic of a thermoresistor. The greater degree of the polynomial, the more accurate static characteristic of the thermoresistor.
In Eq. (1), the variable t expresses the deviation of the temperature of the controlled medium from a certain temperature, taken as the normal temperature (for example, from temperature $\theta_{0}=20^{\circ} \mathrm{C}$). In this case $t=\theta-\theta_{0}$, $R_{0}$ is the resistance of the thermoresistor at normal temperature $\theta_{0}$.
In the average range of a temperatures ($-50 \ldots+200^{\circ} C$) for copper thermoresistor $\alpha_{1}=4,28 \cdot 10^{-3{\circ}}C^{-1}$, $\alpha_{2}=\alpha_{3}=\dots=0$. The static characteristic of a copper thermoresistor in this temperature range can be considered linear. With an increase in temperature of 10 degrees, the resistance of such a thermoresistor increases by 4.28 %.
For platinum thermoresistor $\alpha_{1}=3.96847 \cdot 10^{-3} {\circ}\mathrm{C}^{-1}$, $\alpha_{2}=-5.847 \cdot 10^{-70}{\circ} C^{-2}, \alpha_{3}=\alpha_{4}=\cdots=0$, for nickel $\alpha_{1}=5.86 \cdot 10^{-3^{0}} C^{-1}, \alpha_{2}=8 \cdot 10^{-6^{0}} C^{-2}$, $\alpha_{3}=\alpha_{4}=\dots=0$, i.e. their static characteristics in the average range of temperatures are nonlinear.
More detailed information about the results of the calibration of thermoresistor for general industrial use can be found from the reference data. These data should be considered as averaged for a set of thermoresistor, which may differ from each other (for example, by the composition of micro-impurities of a heat-sensitive material). Therefore, with high demands on the accuracy of measurement results, the individual calibration of static characteristic of a thermoresistor (in general case is nonlinear) is used.
However, in order to simplify the subsequent analysis and assuming that the temperature range of the controlled medium is insignificant, we will neglect the nonlinear terms in Eq. (1), i.e. assume that the dependence of the resistance of the thermoresistor on the measured temperature is
$R_{t}=R_{0}^{\prime}\left(1+k_{1}^{\prime} t\right)$ (2)
The values of $R^{\prime}_{0}$ and $k^{\prime}_{1}$ can be determined by considering Eq. (2) as an equation of the approximating straight line using least squares method.
The deviation of the actual characteristic of the thermoresistor Eq. (1) from the linear characteristic Eq. (2) can be taken into account as a nonlinearity. If this error exceeds the permissible value, then its reduction is one of most important tasks of the instrument design.
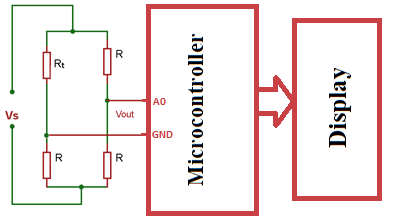
As an example, in order to demonstrate typical tasks appearing in the initial stages of designing measuring device, we will show the development of a mathematical model of a thermoresistor that is designed to measure the temperature of a controlled medium (liquid or gas). In this case, we assume that the measurement method and the elements of the device are known. The connection of the thermoresistor into a bridge and microcontroller is shown in Figure 1.
Figure 1. Connecting a bridge into a microcontroller
Let us assume that the resistances of the other three arms of the bridge are independent of temperature t and they are equal in a magnitude, and their nominal values are equal to the initial resistance of the thermoresistor, i.e. $R=R_{0}^{\prime}$. In this case, the bridge is called equal-armed bridge. At temperature t=0 ℃ (when $R_{t}=R_{0}^{\prime}=R$) the bridge turns out to be balanced and the voltage in its measuring diagonal ab is zero. If $R_{t} \neq R$, then the bridge is unbalanced.
Then a voltage appears in the measuring diagonal of the bridge $V_{out}$, which is part of the supply voltage of the bridge $V_{S}$. The magnitude and the sign of this voltage depends on the degree and direction of the unbalance of the bridge, i.e. on the resistance value of the thermoresistor. For the adopted circuit of switching on the thermoresistor, this dependence has the form
$V_{o u t}=V_{S} \frac{R_{L}\left(R_{t}-R\right)}{R\left(2 R_{L}+R\right)+\left(2 R_{L}+3 R\right) R_{t}}$ (3)
As shown in Figure 1, the output voltage of the bridge is considered as an input voltage of an Analog-to-Digital Converter which is a part of a microcontroller system, the voltage can be represented as
$V_{A D C}=V_{o u t}$ (4)
We will conduct a primary analysis of the results. Carrying out substitutions Eq. (2), Eq. (3) and Eq. (4) into Eq. (5), it is possible to determine the overall calculated non-linearity of the device, i.e. to find the dependence of its testimony on the measured temperature $\overline{t}$. Regarding to Eq. (3), the measured temperature is reduced to
$\overline{t}=\frac{a t}{1+b t}$ (5)
where,
$a=V_{S} \frac{R_{L} G}{4\left(R+R_{L}\right)} k^{\prime} 1$, $b=\frac{2 R_{L}+3 R}{4\left(R+R_{L}\right)} k_{1}^{\prime}$ (6)
On the other hand, the resistance thermometer reading at each point of the measurement range should be equal to the measured temperature. Therefore, the desired static characteristic of the device has the following form
$\overline{t}=t$ (7)
Therefore, the choice of instrument parameters should be selected regarding to at least two conditions a=1 and b=0. The first condition can always be met by selecting the appropriate voltage gain of the amplifier.
The second condition cannot be strictly fulfilled, so $k_{1}^{\prime} \neq 0$ .
Therefore, the choice of coefficients and, consequently, the physical parameters of the device that affect the values of these coefficients, must be subordinated to the following condition: the approximation error should not exceed the specified value.
This error is the difference between the calculated and the desired static characteristics of the device, i.e. it looks like:
$\mathrm{N}(t, a, b)=\frac{a t}{1+b t}-t$ (8)
From a brief analysis, the calculated static characteristic Eq. (5) allows to go directly to solving the problems of signal conditioning, i.e. the choice of such parameters at which the device has the desired output characteristics (in this case, the desired static characteristic Eq. (7)).
The experimental setup exists at the laboratory of Measurement and Transducer at Mechatronics Engineering Department and it consists of the following parts:
1. Heater system which includes: housing for 4 types of temperature sensors, a ventilation system.
2. AC power supply 30 Volts
3. Trainer kit which contains 4 plugs for 4 types of temperature sensors.
4. Arduino Uno microcontroller platform.
The connection of signal conditioning for RTD is shown in Figure 2.
Figure 2. The connection of signal conditioning for RTD
The chain of measurement and the considered transformations for thermoresistor can be represented by a sequence of five physical quantities $t \rightarrow R_{t} \rightarrow V_{o u t} \rightarrow V_{A D C} \rightarrow \overline{t}$, so to calculate the measured temperature, first we find the output of the bridge which can be written as
$V_{A D C}=V_{o u t}=V s\left(\frac{R_{\overline{t}}}{R_{\overline{t}}+R}-\frac{R}{R+R}\right)$ (9)
This can be reorganized in the following form
$\left(\frac{R_{\overline{t}}}{R_{\overline{t}}+R}\right)=\frac{V_{A D C}}{V_{S}}+\frac{1}{2}$ (10)
Assuming that $M=\frac{V_{A D C}}{V s}+\frac{1}{2}$ so the resistance of thermoresistor is
$R_{\overline{t}}=\frac{M \cdot R}{(1-M)}$ (11)
Substituting Eq. (1) in Eq. (10) we can write
$\overline{t}=\left(\frac{\frac{R_{t}}{R^{\prime}_{0}}-1}{k_{1}^{\prime}}\right)$ (12)
or
$\overline{t}=\left(\frac{\frac{M \cdot R}{\frac{(1-M)}{R^{\prime}_0}}-1}{k_{1}^{\prime}}\right)$ (13)
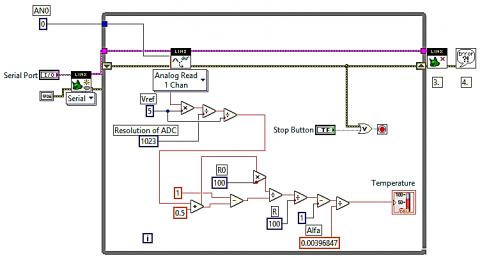
The Arduino program which allows to calculate the measured temperature from Eq. (13) is shown in Figure 3.
The program is developed using Mark hub package under LabVIEW environment.
Figure 3. The Arduino programs
The experimental procedure is following.
After running the experemental procedure a table (which contains the values of actual temperature t and the value of the measured temperature $\overline{t}$) is obtained.
Table 1. Experimental results
|
Vout, mV |
t, ℃ |
$\overline{t}$, ℃ |
|
100 |
20 |
19.25 |
|
120 |
25 |
25.61 |
|
140 |
30 |
29.41 |
|
170 |
35 |
34.85 |
|
190 |
40 |
39.35 |
|
210 |
45 |
44.54 |
|
230 |
50 |
49.12 |
|
250 |
55 |
55.91 |
|
270 |
60 |
60.53 |
|
290 |
65 |
64.84 |
|
310 |
70 |
70.12 |
|
330 |
75 |
74.21 |
|
350 |
80 |
79.13 |
|
360 |
85 |
85.94 |
|
380 |
90 |
90.85 |
|
400 |
95 |
94.35 |
|
420 |
100 |
100.75 |
This table is used to define the values of a and b of Eq. (5). This can be done by using cftool GUI under MATLAB software.
It was shown that the value of a and b vary according to the model of representation of the values to be measured (experimental results).
It was found that in Eq. (5) the constant a is less than 1 (0.9738) and the value of b is about -0.0003041. This resulting in considering the signal conditioning circuit design as a main issue in non-linearity analyses.
In this paper, a novel approach of non-linearity estimation is presented. Experimentally, it was shown that there is a relationship between conditioning circuit parameters and the measured temperature. A nonlinearity of temperature measurement was expressed as a function of a bridge parameters which are an important factor that have influence on the resulting measured temperature.
|
$R_t$ |
The resistance of the wire at a temperature depending on its size and material properties, ohm |
|
t |
The calculated value of temperature, ℃ |
|
$R_0$ |
The resistance of the thermoresistor at normal temperature $\theta_{0}$ , |
|
$R_{0}^{\prime}$ |
Resistance of the arm of the bridge |
|
$k_{1}^{\prime}$ |
a constant coefficient |
|
a,b |
Constant coefficients depending only on the parameters of the device |
|
$\overline{t}$ |
The measured temperature ℃ |
|
$R_{L}$ |
the load resistance of the bridge, ohm |
|
$V_{out}$ |
the output voltage of the bridge, mV |
|
$V_{s}$ |
the power supply voltage of the bridge, V |
|
R |
Fixed value resistance, ohm |
|
G |
voltage gain of the amplifier, |
|
N |
Non-linearity, ℃ |
|
Greek symbols |
|
|
$\alpha_{1}, \alpha_{2}, \dots, \alpha_{\mathrm{i}}$ |
constant coefficients, the values of which (as well as the degree of the polynomial) are determined from the results of calibration of a thermoresistor, $C^{-1}$ |
|
$\theta_{0}$ |
normal temperature, ℃ |
[1] Kesriklioglua, S., Pfefferkorna, F.E. (2018). Real time temperature measurement with embedded thin-film thermocouples in milling. Procedia CIRP, 77: 618-621. https://doi.org/10.1016/j.procir.2018.08.193
[2] Ross-Pinnock, D., Maropoulos, P.G. (2015). Review of industrial temperature measurement technologies and research priorities for the thermal characterisation of the factories of the future. Proceedings of the Institution of Mechanical Engineers, Part B: Journal of Engineering Manufacture, 230(5): 793-806. https://doi.org/10.1177/0954405414567929
[3] Goumopoulos, C. (2018). A high precision, wireless temperature measurement system for pervasive computing applications. Sensors (Basel), 18(10): 3445. https://doi.org/10.3390/s18103445
[4] Yu, Y.B., Chow, W.K. (2009). Review on an advanced high-temperature measurement technology: The optical fiber thermometry. Journal of Thermodynamics, 11. http://dx.doi.org/10.1155/2009/823482
[5] Minava, T.A., Heikkinen, J.E., Pietola, M. (2017). Direct driven hydraulic drive for new powertrain topologies for non-road mobile machinery. Electric Power Systems Research, 152: 390-400. https://doi.org/10.1016/j.epsr.2017.08.003
[6] Sardini, E., Serpelloni, M. (2012). Wireless measurement electronics for passive temperature sensor. IEEE Transactions on Instrumentation and Measurement, 61(9): 2354-2361. https://doi.org/10.1109/TIM.2012.2199189
[7] Kim, R., Park, C.H., Lee, A., Moon, J.H. (2015). Development of the noncontact temperature sensor using the infrared optical fiber coated with antifog solution, science and technology of nuclear installations. Hindawi Publishing Corporation, 4 pages. https://doi.org/10.1155/2015/718592
[8] Alsabbah, S., Mughrabi, T. (2008). Neural network-based waveguide acoustic gas detector. 2008 5th International Symposium on Mechatronics and Its Applications. IEEE Xplore, p. 14. https://doi.org/10.1109/ISMA.2008.4648867
[9] Younes, T.M., Alia, M.A.K., Al-Sabbah, S. (2010). Acoustic temperature transducer. Sensors & Transducers Journal, 119(8): 46-57.
[10] Younes, T.M., Al-Khedher, M.A., Alia, M.A.K. (2012). Thermoacoustic analyzer for water content detection in hydrocarbon emulsion. International Journal of Research and Reviews in Applied Sciences, 10: 145-150.
[11] Al-Khedher, M.A., Younes, T.M., Alia, M.A.K. (2012). Thermo-acoustic water analyzer in hydrocarbon emulsions with Kalman filter. American Journal of Applied Sciences, 9(5): 717-723.
[12] Alia, M.A.K., Younes, T.M., Zalata, M.A. (2011). Development of equivalent virtual instruments to plc functions and networks. Journal of Software Engineering and Applications, 4: 172-180. https://doi.org/10.4236/jsea.2011.43019
[13] Cheneler, D., Ward, M.C.L. (2018). Active thermal sensor for improved distributed temperature sensing in haptic arrays. Hindawi Journal of Sensors, 2018: 14 pages.
[14] Sassine, E. (2016). A practical method for in-situ thermal characterization of walls. Case Studies in Thermal Engineering, 8: 84-93. https://doi.org/10.1016/j.csite.2016.03.006
[15] Balakrishnan, V., Phan, H.P., Dinh, T., Dao, D.V., Nguyen1, N.T. (2017). Thermal flow sensors for harsh environments. Sensors (Basel), 17(9): 2061. https://doi.org/10.3390/s17092061
[16] Aznar, F., Echarri, V., Rizo, C., Rizo, R (2018). Modelling the thermal behavior of a building facade using deep learning. PLoS ONE, 13(12): e0207616. https://doi.org/10.1371/journal.pone.0207616
[17] Prentice, G. (2019). National sales manager moore a practical guide to improving temperature measurement accuracy. Industries-International, Inc, 18.
[18] Hambali, N., Shahrizal, Saat, Ahmad, M.A., Ramli, M.S. (2010). Computer-based system for calibration of temperature transmitter using RTD. 2010 3rd International Conference on Information Management, Innovation Management and Industrial Engineering, pp. 26-28. https://doi.org/10.1109/ICIII.2010.400
[19] Husain, M.D., Atalay, O., Atalay, A., Kennon, R. (2016). Uncertainty analysis of the temperature–resistance relationship of temperature sensing fabric. Fibers, 4: 29. https://doi.org/10.3390/fib4040029
[20] Abhishek, S. (2015). The study of active and passive transducers. International Journal of Innovative Research in Electrical, Electronics. Instrumentation and Control Engineering, 3(9): 70-73. https://doi.org/10.17148/IJIREEICE.2015.3914
[21] Vasuki, B., Umapathy, M., Akhilan, S. (2007). Uncertainty analysis of temperature measurement system using interval arithmetic. Sensors & Transducers Journal, 84(10): 1619-1624. https://doi.org/10.1080/10739140701750037
[22] Boya, N.R., Kande, S., Jinde, V.K., Chintakunta, S., Ungarala, M., Thogata, R. (2013). Design and development of FPGA based temperature measurement and control system. International Journal of Electronics and Communication Engineering & Technology (IJECET), 4(4).
[23] Callejas, I.J.A., Durante, L.C., de Oliveira, A.S. (2017). Thermal resistance and conductivity of recycled construction and demolition waste (RCDW) concrete blocks. REM, Int. Eng. J., 70(2): 167-173. https://doi.org/10.1590/0370-44672015700048