Wenjuan Jiang![]()
© 2023 IIETA. This article is published by IIETA and is licensed under the CC BY 4.0 license (http://creativecommons.org/licenses/by/4.0/).
OPEN ACCESS
In the rapidly evolving domain of global e-commerce, operational organizations are increasingly grappling with unprecedented competitive pressures and challenges in operational efficiency. This study investigates the integration of artificial intelligence (AI) and information management as a transformative approach to augment operational efficiency in e-commerce organizations. The research delves into the optimization of organizational structures, leveraging the predictive capabilities of key information facilitated by AI. A novel decision-making model, integrating AI techniques, is developed to address the limitations inherent in existing decision-making technologies. The model's efficacy is demonstrated through a detailed case study of an e-commerce platform, where objectives and constraints for optimizing e-commerce operational organizations are meticulously constructed. The research identifies critical optimization points, including resource allocation, inventory management, logistics distribution, and customer relationship management. A distinctive organizational operation decision-making model, synergizing with the established Technique for Order Preference by Similarity to an Ideal Solution (TOPSIS), is proposed. This model focuses on optimizing variables pivotal to operational efficiency, with the dual goals of elevating efficiency and enhancing customer satisfaction. The findings underscore the significant role of AI technology in amplifying decision quality and boosting operational efficiency in e-commerce operational organizations, while also presenting potential applicability to a broader spectrum of organizational types.
e-commerce operational organization, artificial intelligence, information management integration, operational efficiency, decision model, Technique for Order Preference by Similarity to an Ideal Solution
In the context of rapid advancements in information technology, particularly the significant breakthroughs in AI, the enhancement of organizational operational efficiency has been identified as a pivotal element for sustainable corporate development [1-3]. Organizations operating within the e-commerce sector, characterized as information-intensive entities, are observed to require critical optimization and improvement in their operational efficiency [4, 5]. This necessity is underscored not only by the imperative of maintaining competitive enterprise viability but also due to its impact on the stability and efficiency of the entire supply chain [6-8]. Consequently, the exploration into how the integration of AI and information management influences the operational efficiency of e-commerce and similar organizations has gained prominence as a research focus.
The fusion of AI technology with internal information management processes has induced revolutionary changes, particularly in applications encompassing data analysis, prediction, and the optimization of decision-making processes. These advancements have been instrumental in significantly enhancing the quality and efficiency of decisions [9, 10]. Despite these developments, a comprehensive understanding of the precise application of these technologies in optimizing the structures of operational organizations and maximizing their effectiveness in actual operational decisions is yet to be fully realized, warranting further in-depth research [11-15]. The present study is undertaken with the objective of addressing these gaps, both theoretical and practical, aiming to contribute scientifically grounded strategies for augmenting operational efficiency in e-commerce and analogous organizations.
Existing research within the realm of AI and information management integration, while having achieved certain advancements, exhibits notable deficiencies [16-19]. Some studies have been critiqued for their excessively theoretical nature, lacking sufficient depth in analysis and practical applicability to specific industrial contexts [20, 21]. Other research efforts have neglected to consider the influence of organizational structure on operational efficiency, resulting in decision models that do not align effectively with real-world business processes. Such limitations have restricted the practical applicability and utility of these research outcomes in operational contexts [22].
This paper is structured into two main research components. The first entails a focused study on the optimization of organizational structures within e-commerce operational organizations. This is approached through a predictive analysis of key information, leading to the establishment of specific objectives and constraints essential for optimizing e-commerce operational organizations. A unique optimization methodology is thus proposed. The second component involves the development of an AI-based model for organizational operation decisions. This model, which incorporates elements of the established decision technology TOPSIS, optimizes variables critical to organizational operational efficiency, thereby aspiring to enhance overall organizational performance. The model not only opens new avenues for efficiency optimization in e-commerce operational organizations but also presents an innovative approach to operational decision-making applicable to a broader range of organizational contexts, holding substantial research value and practical implications.
In the realm of organizational operations, the prediction of future market trends, consumer behavior, and supply chain dynamics is recognized as essential. The integration of AI technology in the development of an operational decision-making model offers substantial value for enhancing operational efficiency. Figure 1 delineates the schematic process of optimizing organizational operational efficiency, as explored in this study. Predominantly focusing on e-commerce organizations, this research investigates the optimization of operational organizational structures, advocating for a method predicated on the prediction of key information. This approach is not only instrumental in formulating more scientifically grounded and rational operational structures but also facilitates operational organizations in achieving a delicate balance between augmenting service levels and managing cost control. Furthermore, it serves as a theoretical framework and point of reference for the structural optimization of diverse organizational types.
This study initiates with the delineation of variables pertinent to the operational organization of e-commerce entities. It is posited that a typical e-commerce distribution network encompasses l distribution centers, encapsulated as {T1,T2,...,Tl}. The endpoints of distribution routes, equipped for round-trip logistics, are identified as T1 and Tl. Mid-route logistic centers, pivotal for the temporary storage of goods and providing space for delivery vehicles and cargos, are denoted as $\left\{T_{z 1}, T_{z 2} \mid z_1, z_2 \in[1, l]\right\}$. Correspondingly, $\left\{T_{y 1}, T_{y 2} \mid y_1, y_2 \in[1, l]\right\}$ represent the origination and culmination points of delivery vehicles, integral to the round-trip requisites of delivery tasks. Distances from logistic centers to turnaround points, specifically from Tz1 to Tγ1 and from Tz2 to Tγ2, are expressed as Uz1,γ1 and Uz2,γ2, respectively. A set of DP options is defined, represented by O={Oj|j=1,2,...,J}, where Oj denotes the turnaround point information for the j-th DP. The ensemble of delivery vehicle grouping schemes is symbolized by Y={Yl|l=1,2,...,L}, with Yl illustrating a specific vehicle grouping scheme. Building on these definitions, the number of delivery vehicles added to DP Oj under grouping Yl is quantified by V(Ej,l). $E=\left\{E_{j, l} \mid j \in J, \quad l \in L\right\}$ encapsulates the combination of vehicle types across various tasks and groupings, with the temporary increment in delivery numbers for these vehicles represented by $V(E)=\left\{V\left(E_{j, l}\right) \mid j \in J, l \in L\right\}$.
Figure 1. Schematic diagram of the organizational operational efficiency optimization process
The scheme for operational organization within the e-commerce domain is influenced by the intersecting interests of the e-commerce platform and consumers. The constructed model for optimizing the operational organizational structure swiftly formulates adjustment schemes, accommodating the delivery capacity requirements projected for future periods. These schemes prioritize the mutual interests of both the e-commerce platform, which aims to maximize profits while upholding order processing efficiency and delivery speed, and the consumers, whose enhanced service expectations necessitate faster delivery services from the e-commerce platform, directly impacting the enterprise's operational costs. Thus, the model converges the analysis by selecting the required adjustments in delivery resources within the e-commerce network, predicated upon the desired delivery timeliness and package density parameters. Consequently, an operational organizational optimization model is formulated, which meticulously considers both consumer service satisfaction and the e-commerce operational organization's costs, striving to balance consumer service levels with organizational operational costs.
In this study, a statistical approach is employed to assess e-commerce distribution capabilities, focusing on the spatial interrelations among various logistics nodes and distribution routes within the network. It is initially determined how many orders each logistics node within diverse distribution route plans currently processes. For each route plan, the maximum number of orders processed by any node is selected to represent the current maximum processed order number for that plan. This figure is then compared to the maximum order number that the logistics node is capable of processing within the analyzed period. A route plan is considered to be in a normal demand state if this maximum processed order number is less than the node's capacity; otherwise, it is categorized as being in a high demand state.
For a given distribution plan, represented as Oj, its set of distribution sections is denoted by {SE1, SE2,...,SEk}j, and the minimum departure interval for delivery vehicles is indicated by dMIN. Concurrently, the number of delivery vehicles in each distribution section during a specific period S is calculated as {v1,v2,...,vk}, based on the processing capacity data within these sections. A distribution network's maximum number vOj of delivery vehicles is deemed to be in a normal demand state if it satisfies a specified equation; if not, the section is identified as a high demand segment.
$v_{o_j}=M A X\left\{v_1, v_2, \ldots, v_k\right\}<\frac{S}{d_{M I N}}$ (1)
Subsequent to the evaluation of actual operational conditions in e-commerce and the integration of distribution adjustment plans within the corresponding period, the distribution organization plan for that period is ascertained. The processing capacity data of the delivery vehicles within their respective distribution sections are then derived. This data considers the effective utilization area of the cargo space of various types of delivery vehicles and the number of delivery batches. The distribution sections for these vehicles are determined based on the starting and ending points of their delivery routes. A matrix is then constructed to assess the relationships between distribution routes and logistics nodes for both high demand and normal demand sections. Each column of this matrix is aligned with a distribution plan, while each row correlates with different logistics nodes in the distribution network. Elements within the matrix indicate the involvement of specific distribution plans with particular logistics nodes, thereby facilitating the statistical analysis of node processing capability changes post plan adjustment. This matrix is instrumental in comprehending the impact of each adjustment plan on e-commerce distribution capability, leading to the establishment of an optimization model. The model is designed to identify and adjust the distribution of resources, ensuring the augmentation of delivery batches or the enhancement of existing distribution routes during peak demand periods. This is done while maintaining a balance between cost control and service level. Additionally, the optimization model is integral in supporting decision-making processes to address order volume fluctuations.
In this study, the evaluation of order processing times within various e-commerce delivery areas, as envisaged by operators, is initially undertaken. The actual versus expected values of order processing times across the entire e-commerce network are utilized to reflect the delivery service level, with smaller discrepancies indicating higher levels of service. The analysis categorizes delivery areas into high demand segments (akin to saturated rail segments) and normal demand segments (analogous to unsaturated segments). The delivery capacity contributed by respective adjustment plans in these areas is calculated. For e-commerce operational organizations, the processing and delivery of orders within timeframes anticipated by customers are paramount indicators of service quality. The objective is to optimize the distribution network and resource allocation, ensuring that actual order processing times align closely with or surpass the set targets, thus enhancing customer satisfaction and competitive edge in the market. E-commerce platforms are tasked with monitoring and analyzing the processing times of orders in different delivery areas, assessing deviations from the expected benchmarks. Through such analysis, areas exhibiting lower service levels are identified, and appropriate improvement measures are formulated. Additionally, based on the distinction between high and normal demand areas, detailed statistics regarding the delivery capability of each area are compiled, enabling precise resource allocation. In high demand areas, an increase in delivery resources or optimization of delivery routes might be necessary to boost capacity, whereas in normal demand areas, it is crucial to avoid overinvestment in resources to curb unnecessary operational expenses. This segmentation facilitates more refined management of logistics networks, ensuring efficient utilization of resources while maintaining or elevating service levels.
The desired parcel density in each delivery segment, as defined by the railway operator, is denoted by w0. The set of delivery segments within the e-commerce distribution network, identified as requiring and capable of adjustment, is represented by K, with the corresponding length of the analysis period indicated by S. The frequency of delivery tasks in the segment from tk to tk+1 during period S is labeled WSk,k+1, and the current processing capability of the segment is termed ZSk,k+1. The set of normal demand segment DP is represented by J, with V(Ej,l) depicting the number Yl of round trips for delivery vehicles under additional DP Oj in these segments. An element within the judgment matrix for normal demand segments, vj,lk,k+1, assesses whether the addition of delivery vehicles under plan Oj enhances processing capability in the current delivery segment, taking a value of 1 for affirmative and 0 for negative.
The set of delivery vehicles with adjustable groupings under the current DP is denoted by H, with vhk,k+1 in the judgment matrix indicating whether the h-th delivery vehicle traverses the segment from tk to tk+1. The adjusted and current grouping numbers for the h-th vehicle executing the delivery task are represented by Yhl and Yh0, respectively. The effective utilization area of the vehicle's carriage is symbolized by T. Consequently, for the analysis period S, an objective model is established for optimizing consumer service levels in the e-commerce distribution network, as presented in Eq. (2).
$M I N U_1=\sqrt{\frac{1}{K} \sum_{k=1}^K\left(\frac{W_{k, k+1}^S}{W_{k, k+1}^S+\sum_{j=1}^J \sum_{l=1}^L V\left(E_{j, l}\right) v_{k, k+1}^{j, l} Y_l T+\sum_{h=1}^H \sum_{l=1}^L v_{k, k+1}^h\left(Y_l^h-Y_0^h\right) T}-w_0\right)^2}$ (2)
The solution set derived from the model previously constructed corresponds to two distinct elements: the additional number of delivery vehicles for normal demand segments and the adjustments in the grouping numbers of delivery vehicles within existing plans, symbolized by $\left\{V\left(E_{j, l}\right) \mid j \in J, l \in L\right\}$ and $\left\{Y_l^h \mid h \in H, l \in L\right\}$ respectively.
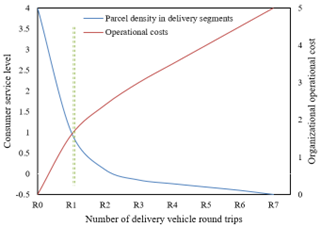
Figure 2. Relationship diagram between e-commerce consumer service level and business operational cost
Figure 2 illustrates the relationship diagram between e-commerce consumer service level and business operational cost. In e-commerce operations, business operational costs are bifurcated into fixed and variable components. Fixed costs, comprising elements like warehouse rent and equipment depreciation, generally remain constant and exhibit minimal correlation with modifications in e-commerce operational organization plans, thus are not factored into the optimization process. The primary focus of this study is on the alterations in variable costs triggered by changes in operational organization plans. The model for e-commerce operational costs is predicated on these variable cost changes. Distinct e-commerce operational organization plans are predominantly discernible in their associated delivery mileages. An empirical analysis of actual e-commerce delivery operations reveals that the driving mileage of each delivery vehicle comprises three components: the mileage incurred on the delivery route, the distance traversed from the warehouse to the delivery route's starting point, and the journey from the delivery route's endpoint back to the warehouse. An objective function is thus established to quantify the driving mileage of vehicles under respective operational organization plans during the operational period. This function enables the e-commerce operational cost model to represent the driving mileage of delivery vehicles, catering to variations in delivery batches and vehicle types. Through this model, e-commerce operational organizations can quantify the total operational mileage under different DPs and convert it into cost implications. This conversion facilitates the evaluation of various delivery strategies’ impacts on variable costs, including choices in delivery routes, vehicle types and quantities, and delivery frequencies. The model aids in optimizing DPs, ensuring the selection of the most cost-effective operational scheme while adhering to customer service level requisites. Assuming MS0 represents the total kilometers traveled by the combination of delivery vehicles under the current operational organization plan during period S, Mj denotes the kilometers traveled by vehicles under additional DP Oj in normal demand segments, and Mh indicates the length of the DP for the h-th vehicle, the e-commerce business operational cost model is expressed as follows:
$\begin{aligned} & \operatorname{MINU}_2=M_0^S+\sum_{j=1}^J \sum_{l=1}^L L\left(E_{j, l}\right) Y_l M_j +\sum_{h=1}^H \sum_{l=1}^L\left(\left(Y_l^h-Y_0^h\right) M_h\right)\end{aligned}$ (3)
In the e-commerce distribution network, the operational organization is stratified into high demand and normal demand areas, for which specific adjustment plan sets are established, thereby forming model solution sets. The model, predicated on the supply and demand dynamics at each distribution node within the e-commerce network, dynamically and expeditiously formulates schemes for increasing delivery batches and adjusting resources, exhibiting the potential to optimize the distribution network's operational organization. To ascertain the applicability of the final distribution operational organization scheme to actual e-commerce operations, the model incorporates constraints reflective of the real operational processes of e-commerce, thereby ensuring the feasibility of the optimization scheme under practical conditions. The model, by integrating the delivery task demands within the distribution segments, resolves to determine the optimal number of additional trips for various types of delivery vehicles in normal demand segments and the adjustments in the grouping numbers of delivery vehicles within existing DP. These are respectively denoted as $\left\{V\left(E_{j, l}\right) \mid j \in J, \quad l \in L\right\}$ and $\left\{Y_l^h \mid h \in H, l \in L\right\}$. Grounded in the processing capability statistics of the delivery segments, the quantity of delivery vehicles capable of executing DP is expressed as [V12,V2,3,...,VK,K+1,...], with k belonging to the range [1,K]. Consequently, the following constraints are delineated within the model:
$\begin{aligned} & \operatorname{MAX}\left\{\sum_{j=1}^J \sum_{l=1}^L\left(\begin{array}{l}V\left(E_{j, l}\right) v_{k, k+1}^{j, l} +V_{k, k+1}\end{array}\right) \mid k \in[1, J]\right\} \leq \frac{S}{d_{M I N}}\end{aligned}$ (4)
$\sum_{j=1}^J \sum_{l=1}^L V\left(E_{j, l}\right) \times Y_l+\sum_{h=1}^H \sum_{l=1}^L\left(Y_l^h-Y_0^h\right) \leq \alpha_{M A X}$ (5)
In scenarios where the residual maximum available number of delivery vehicles is indicated by αMAX, the required number of delivery vehicles for the optimization scheme of the operational organization must comply with specific conditions:
$Y_l^h \geq Y_0^h, V\left(E_{j, l}\right) \geq 0$, and are integers (6)
$O_j \in C$ (7)
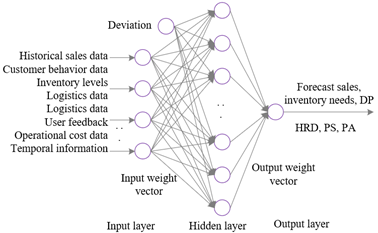
The capability of AI to process extensive datasets and complex algorithms facilitates the provision of decision support that is both more rapid and accurate compared to conventional methodologies. Such an attribute is crucial for e-commerce entities that necessitate swift adaptation to market dynamics. Additionally, AI models are adept at forecasting market demand, optimizing inventory levels, and adjusting distribution resources. The application of AI in these domains leads to reductions in inventory costs and enhancements in delivery efficiencies, thereby contributing to an elevation in overall operational efficiency. The emphasis of this study subsequently shifts towards the formulation of an AI-based decision model for organizational operations, examining its influence on the efficiency of e-commerce operations. The Extreme Learning Machine (ELM) model is selected for the development of the organizational operation decision model, primarily for its rapid learning capabilities. ELM distinguishes itself by its ability to ascertain output weights in a singular learning iteration, thereby circumventing the need for repetitive adjustments. This feature holds particular significance for the dynamic environment of e-commerce operations, where prompt responses to market changes are imperative. Figure 3 delineates the structural design of the ELM model.
Figure 3. Structure of the ELM model
Figure 4. Hierarchical diagram of organizational operation decision model
In the methodology section of the research focused on e-commerce operational organizations, the foundation of any predictive model is established by the input data for the ELM model. This input data encompasses a range of critical components, including historical sales data, customer behavior patterns, inventory levels, logistics information, market data, user feedback, operational cost data, and time-related variables. The output data of the model, crucial in shaping decision-making, encompasses various aspects such as DP, human resources dispatch (HRD), promotion strategy (PS), and price adjustment (PA). Figure 4 in the study delineates the hierarchical structure of the organizational operation decision model. The process of formulating the ELM model, aimed at optimizing decision-making within e-commerce operations, commences with the systematic collection and purification of the aforementioned input data. This step is followed by the meticulous selection of relevant features, serving as input variables for the model. The ensuing phase involves the training of the ELM model. This training process includes the random initialization of parameters for the nodes in the hidden layer, the computation of output weights, and the fine-tuning of model parameters. Methods like cross-validation are employed to prevent the overfitting of the model, ensuring the model's robustness and accuracy in prediction.
In the realm of e-commerce decision support, the ELM model plays a pivotal role, particularly in handling V distinct training samples, denoted as {(ak,sk)}Vk=1. Here, ak belongs to a vector space Ev, and sk to Eu, with v representing the dimensionality of input data and m signifying the dimensionality of output data along with the number of output nodes. The model employs an activation function h(a), alongside a weight vector μu=[μu1,μu2,...,μuv]S for each hidden node. The bias of the u-th hidden node is indicated by yu, while the output weight vector is designated as αu=[αu1,αu2,...,αum]S. The inner product between μu and au is denoted jμu·au, forming a critical part of the model's computation. The output of the ELM model, equipped with l hidden nodes, is articulated through the following expression:
$\begin{aligned} & b_k=\sum_{u=1}^l \alpha_u h_u\left(a_k\right) =\sum_{u=1}^l \alpha_u h_u\left(\mu_u a_k+y_u\right)=s_k, k=1,2, \ldots, V\end{aligned}$ (8)
Under the assumption of an infinitely differentiable set E and V distinct samples represented as $\left(a_u, s_u\right) \in E^f \times E^l$, the actual output value bk of the ELM model is derived. For any given activation function h:E→E, and for randomly generated pairs {(μk,αk)}Vs=1 from Ef×E, the model's output adheres to the condition ||GV×VαV×l-SV×l||=0, leading to the deduction of the subsequent formula:
$\sum_{k=1}^V\left\|b_k-s_k\right\|=0$ (9)
These expressions are further refined as follows:
$\begin{aligned} & \sum_{u=1}^l \alpha_u h_u\left(a_k\right) =\sum_{u=1}^l \alpha_u h_u\left(\mu_u a_k+y_u\right)=s_k, k=1,2, \ldots, V\end{aligned}$ (10)
In this context, the output matrix of the hidden layer, denoted as G, allows for an advanced transformation of the expression:
$G \alpha=B$ (11)
where,
$\begin{gathered}G=\left[\begin{array}{ccc}h\left(\mu_1 a_1+y_1\right) & \cdots & h\left(\mu_1 a_V+y_1\right) \\ \vdots & \ddots & \vdots \\ h\left(\mu_l a_1+y_l\right) & \cdots & h\left(\mu_l a_V+y_l\right)\end{array}\right]_{l \times V} \\ \alpha=\left[\alpha_1, \alpha_2, \ldots, \alpha_l\right]^S, B=\left[s_1, s_2, \ldots, s_m\right]^S\end{gathered}$ (12)
The ELM model, integral to e-commerce operational decision optimization, exhibits a distinctive characteristic where the weights and biases of its hidden layer are generated randomly and remain unchanged throughout the training phase. This initialization process is pivotal for the model's setup, involving the selection of an appropriate random distribution for initializing weights between the input and hidden layers. The dimensionality of these weights is determined by the number of input data features and the quantity of neurons within the hidden layer. The neuron count in the hidden layer, a crucial hyperparameter, is pre-determined, balancing the model's complexity against training efficiency. In scenarios where the M-P generalized inverse of the hidden layer output matrix G is represented as G+, the computation of output weights follows the formula:
$\hat{\alpha}=G^{+} B$ (13)
Transforming the regularized ELM model into a quadratic programming problem with equality constraints simplifies into an unconstrained optimization challenge by constructing a Lagrangian function. This transformation leverages existing optimization theories and algorithms, offering a robust strategy for navigating complex issues in e-commerce operational decision-making, thus enhancing both decision-making efficiency and model performance. Consequently, the study incorporates a penalty term into the ELM model for organizational operation decision optimization, aiming to moderate the model's complexity. Let x1>0 and x2>0, with o and w selected from the set {0,1/2,1,2,..., +∞}. The norms of a matrix vector, Mo and Mw, are represented by ||∙||o and ||∙||w, respectively. The degree of these norms is indicated by x1 and x2. For a given sample ak, the training error value is denoted by ςk=[ςk1,ςk2,...,ςkl]S. The regularization term in the model is represented by ||α||x2w, and the overall training error for the sample is expressed as |ς||x2o. A critical component in the model's construction is the adjustment parameter of the regularization parameter, denoted by ε2> 0.
$\begin{aligned} & \operatorname{MIN} \frac{1}{2}\|\zeta\|_0^{x_1}+\frac{\varepsilon^2}{2}\|\alpha\|_0^{x_2} \\ & \text { t.s. } \zeta_k^B=s_k^B-g\left(a_k\right) \alpha ; k=1,2, \cdots L\end{aligned}$ (14)
Addressing unconstrained problems often proves more straightforward than their constrained counterparts, allowing the application of numerical methods like gradient descent for computational ease. Transforming the problem into an unconstrained optimization scenario is achieved as follows:
$\begin{aligned} & M(\alpha, \varsigma, \beta)=\frac{\eta^2}{2}\|\alpha\|^2+\frac{1}{2} \sum_{k=1}^L\|\zeta\|^2 -\sum_{k=1}^L \sum_{j=1}^l \beta_{k, j}\left(\varsigma_{k, j}+g\left(a_k\right) \alpha_j-b_{k, j}\right)\end{aligned}$ (15)
The vector of Lagrange multipliers, β=[β1,β2,...,βv]S, and βk=[βk1,βk2,...,βkl]S, facilitates the determination of the regularized ELM's output weight matrix, outlined below:
$\hat{\alpha}= \begin{cases}\left(G^B G+\varepsilon^2 U\right)^{-1} G^B B & B \leq L \\ G^B\left(G G^B+\varepsilon^2 U\right)^{-1} B & B>L\end{cases}$ (16)
Figure 5. Decision accuracy of various outputs of the organizational operation decision model at different iteration counts
Table 1. Decision accuracy of various outputs of the organizational operation decision model after 20 iterations
|
Model |
DP Decision |
HRD Decision |
PS Decision |
PA Decision |
|
RNN |
43.5% |
71.5% |
47.8% |
54.8% |
|
GRU |
31.8% |
71.4% |
51.3% |
52.1% |
|
LSTM |
32.9% |
57.8% |
62.3% |
51.3% |
|
BRNN |
63.5% |
88.9% |
91.7% |
82.3% |
|
SRN |
71.5% |
94.% |
88.7% |
84.5% |
|
PHC-LSTM |
71.6% |
94.7% |
91.2% |
86.3% |
|
The proposed model |
74.3% |
96.3% |
93.6% |
87.9% |
The data derived from Figure 5 and Tables 1 and 2 undergoes thorough examination to ascertain the performance and enhancement in decision-making efficiency of e-commerce operational decision models across varying iteration counts. It is observed that at an initial 20 iterations, all models tend to exhibit lower levels of decision accuracy. Particularly, conventional models like Recurrent Neural Network (RNN), Gated Recurrent Unit (GRU), and Long Short-Term Memory (LSTM) display suboptimal accuracy in both DP and PS decisions, with GRU and LSTM scarcely exceeding a 30% accuracy threshold in DP. In contrast, advanced models such as Bidirectional Recurrent Neural Network (BRNN), Simple Recurrent Network (SRN), and PHC-LSTM show a marked improvement in accuracy, notably in PS decisions where they surpass 88%. Remarkably, the study's proposed model attains the highest accuracy in all categories at this iteration level, demonstrating its robust adaptability to diverse decision-making scenarios. Upon increasing iteration counts to 100, a noticeable uptrend in accuracy is evident across all models, underscoring the critical role of iterative learning in honing model precision. The study's model continues to exhibit superior accuracy post-100 iterations, especially in PS decisions where accuracy escalates from 93.6% to 96.6%. These findings underscore the model’s exceptional performance in the iterative learning process, highlighting its potential for precise and effective operational decision-making in e-commerce settings. The model’s enhanced adaptability and predictive capability with increasing iterations significantly contribute to elevated operational efficiency and competitive advantage.
Table 2. Decision accuracy of various outputs of the organizational operation decision model after 100 iterations
|
Model |
DP Decision |
HRD Decision |
PS Decision |
PA Decision |
|
RNN |
53.5% |
81.2% |
57.3% |
64.8% |
|
GRU |
35.3% |
81.1% |
61.3% |
58.1% |
|
LSTM |
48.5% |
82.8% |
62.3% |
64.3% |
|
BRNN |
73.5% |
96.9% |
92.7% |
87.3% |
|
SRN |
74.5% |
96.3% |
92.7% |
87.5% |
|
PHC-LSTM |
78.6% |
96.7% |
94.2% |
91.3% |
|
The proposed model |
84.3% |
97.3% |
96.6% |
92.9% |
Figure 6-a presents a scatter plot with the regularized ELM’s DP predictions on the horizontal axis against the ANOVA’s DP predictions on the vertical axis, alongside a y=x line representing identical predictions by both models. The proximity of most data points to this line indicates a high degree of similarity in both models' DP predictions, suggesting minimal impact on decision stability irrespective of the chosen model. In Figure 6-b, the regularized ELM’s HRD predictions are plotted against ANOVA’s HRD predictions, with the majority of data points closely aligned with the y=x line. This alignment implies that both models yield highly similar HRD predictions, ensuring stable and reliable outputs for HRD decisions. Such consistency is beneficial for organizations, as it aids in effective workforce planning and accurate human resource demand forecasting. Reliance on these model outputs enables more efficient employee scheduling, reducing resource wastage and enhancing satisfaction levels while fulfilling customer requirements.
The comparative analysis between the ANOVA and regularized ELM models, as depicted in Figure 6-c, pertains to the domain of PS decision-making. It is observed that most scatter points in the graphical representation fall below the y=x line, indicating a tendency of the ANOVA model to yield lower predictive values for PS compared to the regularized ELM model. This disparity suggests a divergence in the models' predictions regarding promotional strategies. However, despite this deviation, a linear trend is discernible among the scatter points, implying a certain level of correlation. The existence of this trend, albeit with some inconsistencies, points to the comparative proximity of the model outputs, which is expected to contribute positively to the operational efficiency of the organization. If the predictions of these models are utilized in optimizing the timing and intensity of promotions or in more precisely targeting customer segments, the derived strategies could potentially enhance organizational revenue and optimize resource allocation for improved market efficiency.
In Figure 6-d, the analysis shifts to the comparison of PA predictions between the regularized ELM and ANOVA models. The majority of the data points cluster near the y=x line, suggesting a high degree of similarity in PA predictions between the two models. This pronounced consistency in prediction is indicative of the decision models' accuracy and stability in forecasting price adjustments, with a consequent positive effect on the organization's operational efficiency. By leveraging these models, organizations can make well-informed decisions about timing and methodology of PA, thereby reducing inventory costs and boosting sales. Furthermore, the notable alignment in predictions allows for a choice between models based on computational complexity, user-friendliness, and interpretability. Nevertheless, the presence of certain data points deviating from the y=x line warrants additional investigation into specific scenarios where the models' predictions diverge. This calls for a deeper exploration of these deviations to uncover their underlying causes, followed by necessary model modifications to enhance prediction precision and stability.
The analysis suggests that employing these models in organizational operations is likely to yield beneficial outcomes, owing to their consistency in providing decision support. The alignment of predictions reveals the models' successful adaptation to the data structure of DP, enabling accurate forecasting of delivery demands. This congruence in model outputs reduces uncertainty, aids in resource planning, and facilitates the optimization of human and material resources. It also minimizes waste while augmenting both efficiency and customer satisfaction.
Figure 6. Comparison of organizational operation decision effects between the ANOVA model and the regularized ELM
Figure 7. Comparison of organizational operation decision effects between ELM and regularized ELM simulations
The analysis of Figure 7-a demonstrates a comparative evaluation of the predictions made by the ELM and regularized ELM models in the context of DP. The scatter plot illustrates data points closely congregating around the y=x line, signifying a high degree of similarity in the predictions of both models for DP. This observation implies that the application of regularization techniques has not introduced substantive discrepancies in the model's predictive outcomes for this specific dataset. Such consistency is advantageous for the construction of decision models, as it mitigates the risk of outcome instability that might arise from the selection of unsuitable models. The uniformity in predictions from both models suggests that the employed data and the chosen model structure are aptly suited for addressing DP challenges within the organizational context.
In the case of Figure 7-b, the performance of the ELM and regularized ELM models in predicting HRD is compared. The proximity of the majority of data points to the y=x line within the chart indicates remarkably similar predictions from both models concerning HRD. This finding suggests that the regularization process has not markedly altered the predictive information relative to the original ELM model. This level of consistency is beneficial for organizational decision-making, as it indicates that dependable and stable predictions can be achieved irrespective of the specific model algorithm utilized.
Figure 7-c presents a comparative analysis between the ELM and regularized ELM models regarding PS predictions. The chart's data point distribution, primarily aligning closely with the y=x line, reveals that both regularized ELM and ELM models typically yield analogous predictions for PS. The observed consistency indicates that the additional regularization has not significantly modified the predictive outcomes or that such modifications are not sufficiently impactful for this dataset.
The comparison of ELM and regularized ELM models in PA predictions is depicted in Figure 7-d. The scatter plot demonstrates data points closely arrayed around the y=x line, signifying a consistent alignment in PA predictions between the ELM and regularized ELM models. This consistency suggests that in this instance, regularization has not significantly influenced the model's predictive capability. The high level of consistency is positively conducive to organizational decision-making processes, particularly by enhancing confidence in the model's predictions and offering decision-makers a reliable foundation for making informed choices. The uniformity of outputs streamlines the decision-making process by reducing the resources and time required to analyze divergent model results. Accurate predictions of PA enable organizations to manage inventory more effectively, reduce surpluses, and optimize supply-demand alignment.
In conclusion, the development of structural optimization strategies and decision models is directly linked to organizational operational efficiency. The congruence observed between the ELM and regularized ELM models in the examples above suggests that the selection of the model exerts minimal influence on their predictive performance. Thus, organizations can base their model choice on other factors without undue concern for variations in predictive outcomes. In practical application, organizations are encouraged to integrate additional data, including market trends and competitor insights, to enhance the accuracy of predictions. Continuous monitoring and model adjustment in response to market shifts are vital to maintaining long-term decision-making efficacy and organizational effectiveness.
Table 3. Maximum and minimum values of organizational operation decision effects
|
Method |
Organizational Operation Decision Item |
Maximum Value |
Minimum Value |
|
ANOVA |
DP |
0.03 |
-0.97 |
|
HRD |
25.36 |
13.58 |
|
|
PS |
412.52 |
224.87 |
|
|
PA |
725.36 |
246.98 |
|
|
ELM |
DP |
0.06 |
-0.92 |
|
HRD |
28.69 |
1351 |
|
|
PS |
415.23 |
248.68 |
|
|
PA |
723.69 |
246.39 |
|
|
Regularized ELM |
DP |
0.05 |
-0.97 |
|
HRD |
23.54 |
13.74 |
|
|
PS |
421.25 |
246.85 |
|
|
PA |
726.39 |
246.38 |
The data in Table 3 facilitates an assessment of the maximum and minimum values associated with the effects of organizational operation decisions. The analysis highlights that the regularized ELM model closely mirrors the ANOVA model in terms of the minimum values across all decision categories. Although variances are noted in the maximum values, there exists a comparative consistency between the two models. This observation underscores the regularized ELM model's proficiency in maintaining model stability and ensuring consistent results. In comparison to ANOVA, the regularized ELM yields outputs that are smoother and more robust, signifying an improvement in the model's reliability. It can be inferred that the regularized ELM, by moderating the model's complexity and averting overfitting, aligns its outcomes with those of ANOVA. This regularization technique enhances the model's generalization capability, contributing positively to the overall operational efficiency of the organization. The structural optimization strategies and decision models proposed, especially those incorporating regularization techniques, have been found to significantly augment the stability and precision of decision-making. Consequently, these advancements offer substantial benefits in addressing the uncertainties and evolving dynamics within the e-commerce sector. They empower organizations to swiftly adapt to market fluctuations, optimize resource distribution, elevate customer satisfaction, and amplify competitive strength in the marketplace.
This study has centered on the enhancement of decision-making efficiency and accuracy within e-commerce operational organizations. An investigation into the structural optimization of these organizations was initiated, establishing clear objectives and constraints for optimization. The research aimed at improving both the efficiency of decision-making and the flexibility of organizational operations through structural refinement. An innovative AI-based organizational operation decision model was developed, integrating the traditional TOPSIS decision-making technique with AI algorithms. This integration was targeted at optimizing variables impacting organizational operational efficiency, leading to an overall improvement in organizational outcomes.
The effectiveness of various AI algorithms in e-commerce organizational operation decisions was critically assessed. Model performance was evaluated based on accuracy rates post 20 and 100 iterations, with results indicating that iterative learning plays a vital role in enhancing model performance, as evidenced by improved accuracy rates across all models with increasing iteration counts. The model proposed in this research surpassed other algorithms in decision-making accuracy for DP, HRD, PS, and PA after multiple iterations, thereby showcasing its superior performance. Further analysis was conducted on the extreme values of organizational operation decision effects. Here, the regularized ELM model demonstrated a close alignment with ANOVA in terms of model stability, underscoring the value of regularization techniques in augmenting the model's generalizability. In-depth examination of the predictive performance of the ELM, regularized ELM, and ANOVA models across four pivotal operational decision variables revealed that regularization did not significantly alter the models' predictive capabilities for the dataset analyzed.
In conclusion, the structural optimization strategies and decision models proposed in this study are shown to have a positive influence on the overall operational efficiency of e-commerce organizations. Across various domains, such as DP, HRD, PS, and PA, the models provide precise predictions that assist organizations in making informed decisions, thereby elevating operational efficiency. The findings of this research contribute significantly to the understanding of AI's role in operational decision-making within the dynamic e-commerce sector, offering valuable insights for future applications in similar organizational contexts.
[1] Tuktarova, L.R. (2023). Economic aspects of enterprises’ sustainable development. In International Conference Engineering Innovations and Sustainable Development, pp. 434-441. https://doi.org/10.1007/978-3-031-38122-5_60
[2] Richnák, P., Fidlerová, H. (2022). Impact and potential of sustainable development goals in dimension of the technological revolution industry 4.0 within the analysis of industrial enterprises. Energies, 15(10): 3697. https://doi.org/10.3390/en15103697
[3] Zhao, J. (2021). Dual innovation: The road to sustainable development of enterprises. International Journal of Innovation Science, 13(4): 423-436. https://doi.org/10.1108/IJIS-07-2020-0096
[4] Cheng, J., Li, W., Zhao, J., Wang, Y., Chang, Y., Wu, L., Meng, W. (2022). Research on the evaluation index system of organizational effectiveness based on multi-integrated and highly elastic energy Internet enterprises. In 2022 2nd International Conference on Computer Science, Electronic Information Engineering and Intelligent Control Technology (CEI), Nanjing, China, pp. 468-472. https://doi.org/10.1109/CEI57409.2022.9950155
[5] Kareem, H.M., Aziz, K.A., Maelah, R., Yunus, Y.M., Alsheikh, A., Alsheikh, W. (2021). The influence of accounting information systems, knowledge management capabilities, and innovation on organizational performance in Iraqi SMEs. International Journal of Knowledge Management (IJKM), 17(2): 72-103. https://doi.org/10.4018/IJKM.2021040104
[6] Iswari, N.M.S., Budiardjo, E.K., Santoso, H.B., Hasibuan, Z.A. (2019). E-business application recommendation for SMEs based on organization profile using random forest classification. In 2019 International Seminar on Research of Information Technology and Intelligent Systems (ISRITI), Yogyakarta, Indonesia, pp. 522-527. https://doi.org/10.1109/ISRITI48646.2019.9034632
[7] Melnik, A., Ermolaev, K., Kuzmin, M. (2019). Requirements for companies’ energy saving programs under the conditions of digitalization of Russian economy. In IOP Conference Series: Materials Science and Engineering, 497(1): p. 012080. https://doi.org/10.1088/1757-899X/497/1/012080
[8] Choi, M.J., Kim, S., Park, H. (2018). Empirical study on the factors influencing process innovation when adopting intelligent robots at small-and medium-sized enterprises—the role of organizational supports. Information, 9(12): 315. https://doi.org/10.3390/info9120315
[9] Hiran, D., Kothari, H., Singh, S. (2023). Impact of Artificial Intelligence on Human Resource Management practices in private organizations of India. In International Conference on ICT for Sustainable Development, pp. 149-164. https://doi.org/10.1007/978-981-99-5652-4_16
[10] Li, Y.P., Yang, S.C., Mao, W.B., Gao, G.Z., Lu, Y.N., Huang, Z.H. (2022). Active power balance scheduling architecture and strategy of distributed flexible resource based on collective intelligence. Dianli Zidonghua Shebei/Electric Power Automation Equipment, 42(7): 174-182.
[11] Gong, F. (2022). Application of artificial intelligence computer intelligent heuristic search algorithm. Advances in Multimedia, 2022: Article ID 5178515. https://doi.org/10.1155/2022/5178515
[12] Grabowski, M., Martelli, P.F., Roberts, K.H. (2023). Reliability-Seeking virtual organizations at the margins of systems, resources and capacity. Safety Science, 168: 106327. https://doi.org/10.1016/j.ssci.2023.106327
[13] Bandyopadhyay, S., Mukherjee, R., Sarkar, S. (2020). A report on the first workshop on software engineering for artificial intelligence (SE4AI 2020). In Proceedings of the 13th Innovations in Software Engineering Conference on Formerly known as India Software Engineering Conference, pp. 1-2. https://doi.org/10.1145/3385032.3385055
[14] Uttarwar, S., Gambani, S., Thakkar, T., Mulla, N. (2020). Artificial intelligence based system for preliminary rounds of recruitment process. In Computational Vision and Bio-Inspired Computing: ICCVBIC 2019, pp. 909-920. https://doi.org/10.1007/978-3-030-37218-7_97
[15] Xia, W. (2023). Research on data resource classification for intelligent highway scenarios. In 2023 7th International Conference on Transportation Information and Safety (ICTIS), Xi'an, China, pp. 1457-1461. https://doi.org/10.1109/ICTIS60134.2023.10243989
[16] Al Yami, M., Ajmal, M.M., Balasubramanian, S. (2022). Does size matter? The effects of public sector organizational size’on knowledge management processes and operational efficiency. VINE Journal of Information and Knowledge Management Systems, 52(5): 670-700. https://doi.org/10.1108/VJIKMS-07-2020-0123
[17] Leite, L., Kon, F., Pinto, G., Meirelles, P. (2020). Platform teams: An organizational structure for continuous delivery. In Proceedings of the IEEE/ACM 42nd International Conference on Software Engineering Workshops, Seoul Republic of Korea, pp. 505-511. https://doi.org/10.1145/3387940.3391455
[18] Wyganowska, M. (2018). Establishing the optimal number of priority communication levels in an organizational structure based on mining companies. In 18th International Multidisciplinary Scientific GeoConferences SGEM 2018, pp. 389-396. https://doi.org/10.5593/sgem2018/1.3/S03.050
[19] Li, Y., Wang, X., Gong, T., Wang, H. (2023). Breaking out of the pandemic: How can firms match internal competence with external resources to shape operational resilience? Journal of Operations Management, 69(3): 384-403. https://doi.org/10.1002/joom.1176
[20] Xiao, L. (2016). Study on the organizational structure of rural land stock cooperative system based on game theory and network data. International Journal of Security and Its Applications, 10(3): 333-344. https://www.earticle.net/Article/A271008
[21] Mayo, G., Shoghli, O., Morgan, T. (2020). Investigating efficiency utilizing data envelopment analysis: Case study of shipyards. Journal of Infrastructure Systems, 26(2): 04020013. https://doi.org/10.1061/(ASCE)IS.1943-555X.0000541
[22] Wang, Y., Liu, J., Zuo, J., Rameezdeen, R. (2019). Ways to improve the project management efficiency in a centralized public procurement system: A structural equation modeling approach. Engineering, Construction and Architectural Management, 27(1): 168-185. https://doi.org/10.1108/ECAM-12-2018-0560