Ohood Fadil Alwan![]() | Qusay Kanaan Kadhim*
| Qusay Kanaan Kadhim*![]() | Rasha Basim Issa
| Rasha Basim Issa![]() | Shaymaa Taha Ahmed
| Shaymaa Taha Ahmed![]()
© 2023 IIETA. This article is published by IIETA and is licensed under the CC BY 4.0 license (http://creativecommons.org/licenses/by/4.0/).
OPEN ACCESS
The clinical differentiation between benign and malignant ovarian tumors represents a substantial challenge in the fields of obstetrics and gynecology, particularly following the detection of ovarian cysts through ultrasound. Ovarian cancers, diverse in type, often exhibit overlapping characteristics that complicate diagnosis. In this study, a deep learning-based methodology was developed to aid in the rapid and accurate differentiation of ovarian cancer types using ultrasound imaging. A deep learning approach, utilizing transfer learning with Convolutional Neural Network (CNN) models, was employed. To ensure the stability and robustness of the solution, ten iterations of training and validation were executed, with data randomly sampled for each iteration. The mean of the ten iterations' outcomes constituted the final evaluation metric. Initially, ultrasound images were enhanced to augment the quality of the training dataset, followed by the extraction of low-level texture features for the segmentation of images. Subsequently, ten established CNN models were utilized for both training and transfer learning processes. In the culmination of the study, a multitask model was proposed, capable of concurrently executing detection and segmentation tasks. The conducted evaluations reveal that the deep learning models can classify ovarian tumors with an accuracy of 98.79%, a rate comparable to that of skilled medical practitioners.
deep learning, convolution neural network, ovarian tumors, ultrasound images, transfer learning
Women of all ages might be affected by ovarian and adnexal tumors, which are frequent gynecological issues. Less than three cm in diameter follicular and corpus luteum cysts appear monthly in premenopausal women. Cyst development is still 13–16% more likely in postmenopausal women. Therefore, ovarian and adnexal tumors need to be assessed, tracked, and treated when performing pelvic ultrasound exams on women in clinical settings [1]. The majority of ovarian cysts is physiological, is more prevalent in premenopausal women, and eventually goes away. Ovarian cysts that are not physiological make up a very small portion of all cysts and will continue to grow. An abdominal or vaginal ultrasound can be done by a gynecologist to differentiate Malignant cysts differ from benign cysts. Frequently, monitoring benign ovarian cancers is possible without adjusting the interval. Only if benign tumors persist or grow further, with the potential for torsion and rupture, are operations undertaken. Nevertheless, to lower subsequent mortality, malignant tumors necessitate prompt cytoreductive surgery and then chemotherapy.
The most deadly malignancy of the female reproductive system is ovarian cancer. Around 240,000 women were given ovarian cancer diagnoses worldwide in 2012, and 150,000 of them women passed away from the disease [2]. 53% of ovarian cancer patients, according to United States Cancer Statistics, pass away within 5 years of their diagnosis, and this death rate can rise as a result of diagnostic lag time and late-stage diagnosis [1].
Gynecologists have a tough time diagnosing ovarian tumors since they affect women of different ages. Upon discovery of an ovarian mass, the clinician's top concern is to ascertain if it is a benign or malignant tumor and to evaluate the alternatives for the best care [2], the most often used imaging technique for evaluating ovarian cancers is pelvic ultrasonography, which offers details about the tumor such as its size, consistency, and type. Because results can differ between interpreters, ultrasonography's main drawback is that it is operator-dependent [3]. Recent studies have looked at the value of texture analysis in the diagnosis of breast lesions on digital X-ray mammography using deep learning and the detection of cervical neoplasms on colposcopy images [4]. By using 187 ultrasound images of ovarian tumors, created a Support Vector Machine (SVM) to distinguish between benign and malignant lesions. Additionally, a three-dimensional texture analysis algorithm was created to assess structural differences in the extracellular matrix between normal ovary and serous ovarian tumors [5].
After ovarian cysts are discovered, the typical clinical difficulty that faces obstetricians, gynecologists, and ultrasound examiners is differentiating between benign and harmful ovarian cancers [6]. Ovarian tumors come in many different varieties, and many of them share traits that make clinical diagnosis more difficult. An unclear diagnosis can make choosing a course of treatment more challenging and make a patient feel more anxious. For instance, debunking surgery, which necessitates significant abdomen incisions, is a typical surgical procedure for treating malignant tumors.
Minimally invasive surgery can be used to monitor or treat benign ovarian tumors. Patients' wounds and prognosis are both impacted by an incorrect diagnosis [7].
Since the concept of the CNN was first presented in 2012, it has been widely applied to tasks like image classification, object identification, and image segmentation [8]. Computer-Aided Diagnosis Systems (CADs) are evolving quickly because of the growth of big data in medicine and deep learning [9]. By 2040, the market for image-based artificial intelligence medical diagnostics would have grown by almost 10000%, predicts IDTechEx, a well-known British research company. Deep learning has so far been widely used in the diagnosis of a variety of ailments, such as the detection of benign and malignant thyroid nodules, thyroid nodule identification, and lung cancer [10].
Deep learning techniques have been used in a few research projects to diagnose ovarian tumors, although the majority of research projects base their categorization of ovarian cancer on artificial image segmentation. With medical photos, locating and defining the tumors' boundaries is equally crucial. The task of segmenting an ovarian tumor is extremely difficult for a number of reasons, though. Due to the limited soft tissue contrast, some tiny tumors can readily be mistaken for adjacent tissues [11].
Moreover, due to individual variance, the ovarian tumor's shape and size are unstable and change irregularly. A polycentric distribution of ovarian carcinoma metastases results from the aberrant cells' capacity to infiltrate or spread to different sections of the body as the cancer progresses.
Obstetricians, gynecologists, and ultrasound examiners must deal with the typical clinical challenge of differentiating between benign and malignant ovarian tumors after finding ovarian cysts. Ovarian tumors come in several different varieties, and many of them share traits that make clinical diagnosis more difficult. We want to create a technique that quickly and accurately supports the various diagnoses of ovarian cancers in ultrasound pictures using the CNN model.
Using 1813 ovarian ultrasound pictures obtained from 1254 individuals, the efficiency of the suggested CNN is verified. The deep learning visualization technique and decline in sorting efficiency verify the qualitative and quantitative effects of picture disruption on texture analysis [12].
Our proposed CNN is what we consider a workable deep learning-based diagnostic tool for differentiating ovarian cancers. As compared to cutting edge approaches, the proposed method has demonstrated greater performance. An innovative deep learning strategy is suggested for the segmentation of ovarian tumors from ultrasound pictures, summarizing the key contributions of our study. This is, as far as we are aware, the first deep learning technique for segmenting ovarian cancers using ultrasound pictures. To address the polycentric and size variation issues associated with ovarian tumors, a multi-scale graph learning framework has been developed. This framework makes use of long-range relationships among the ovarian tumors to improve segmentation performance.
Many other computer vision tasks, such instance segmentation and object tracking, are built on object detection, one of the core computer vision problems. The object detection algorithms provide answers to questions regarding the nature of the objects and their location. By utilizing shared feature information across many tasks, multitask learning — particularly CNN-based multitask learning approaches that can achieve convolutional sharing of network structures — aims to develop stronger semantic representations.
Zhao et al. [13] provided a convolutional neural network technique-based machine learning framework for the detection of ovarian cancer using the photo content for classification. They essentially suggested one methodological characterization (classification) algorithm. They evaluated the multilayer, Convolutional Neural Networks, Linear Regression classifier, a proposed model that abstracts images of obstetric tumors, based on two criteria: precision ratio (96.5%) and recall rate (99.1%).
Schwartz et al. [14] developed a refined model employing a conventional is a convolutional neural network that is 16 layers deep (VGG-16) deep neural network trained on an ImageNet dataset made up of ultrasound images of various female ovaries to determine whether or not they contain cysts. The accuracy of the suggested algorithm was 92.11%. Future research will classify many cyst forms, including functional, desmoids, hemorrhagic, and Polycystic Ovarian Syndrome (PCOS) cysts.
Micci et al. [15] these were the two standard methods for detecting tumors. The conventional method for identifying any type of tumor, whether malignant or not, is a tissue biopsy. The use of liquid-based biopsies, which involve drawing blood for a test to identify any signs of tumor growth, is another way to diagnose cancer. Yet, the traditional approach is still preferable to the current approach. In the future, these liquid biopsies may provide improved outcomes (clinical tools), lowering the death rate of ovarian cancer.
Nagarajan and Tajunisha [16] talked about the sonographic characteristics of different ovarian cystic masses that can be discovered inside or outside the ovary. Ovarian cysts typically come in seven different forms. For the most part, image processing is employed to find ovarian cancers. It will be necessary to use an active contour technique; however genetic algorithms or fuzzy set algorithms can increase detection accuracy.
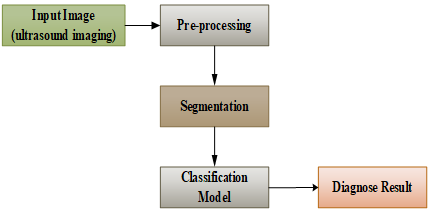
Figure 1. Proposed methodology for the classification of ovarian tumor
This section explains the method for detecting ovarian cancers that is based on deep learning architectures for segmentation and classification a multi-network feature extraction model and deep learning classifier CNN are suggested for use in the implementation of utilizing medical histopathology pictures.
The Convolutional Neural Network (CNN or ConvNet) is a subtype of Neural Networks that is mainly used for applications in image and speech recognition. Its built-in convolutional layer reduces the high dimensionality of images without losing its information. That is why CNNs are especially suited for this use case. The research's methodology is shown in Figure 1.
3.1 Datasets
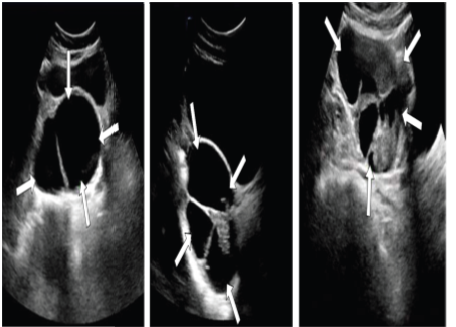
The main source of evidence for the efficiency of the suggested strategy was our collection of images of ovarian tumors. As there isn't a publicly accessible liver image dataset, one was used instead to compare with current medical picture segmentation techniques [16]. Zhejiang University's School of Medicine's Affiliated Women's Hospital offered an ovarian tumor dataset used in this work, which includes 196 Ultrasound Images (UI) in total, as shown in Figure 2 some examples from images.
Figure 2. Examples of ultrasound images [17]
3.2 Pre-processing
Figure 3. Training ovarian ultrasound image
The Image Archiving and Communication Systems in the hospital are used for image segmentation and analysis was used to retrieve all Ultrasound Images. The procedure is provided, spanning data preprocessing and model training in Figure 3. The raw images showed numbers from medical records and other pertinent data. We eliminated medical record information from the photos in accordance with Upgraded Local Binary Pattern (ULBP) standards to protect data confidentiality and prevent it from influencing next model training and classification. A random selection of 60% of the benign and malignant tumor photos were 40% of the datasets were used as validation datasets, and the remaining 60% as training datasets. Images from training datasets had data augmentation done, the machine learning approach used to broaden data sets used for training that are diverse, prevent approach over-fitting, and enhance accuracy [18].
Data augmentation methods used in the current investigation included random flipping, horizontal mirroring, where images were rotated by 60 degrees or less and random rotation, where images were. As a consequence of adding To obtain a number equivalent to the initial training data, white noise was applied in the training data to each image, The final training data set has 2454 total images.
3.3 Classification model using ConvNN
CNN is an example of a deep learning technique that simulates how the brain processes information. In recent years, the CNN has drawn the attention of researchers from numerous nations since it is thought to be a useful tool for enhancing automated diagnosis systems and achieving better results for illness prediction systems. A subclass of artificial neural networks called "Convolutional Neural Networks" (CNNs) create output states, or "pixels" in a visual analogy, by convolution a filter input signal that the particular bank of neurons has already learned. The CNN has a unique architecture made up of many layers that will be organized according to their capabilities. Each layer of CNN processed information, with the output from one layer feeding into the output of the next. A network's the input layer is the top layer, while the output layer is its bottom layer.The network's hidden layers are all of the layers that are present between the input and output layers. Usually each layer contains a simple algorithm and only one type of activation function.Convolution activation pooling and fully connected layers are possible classifications for these layers [19].
In this paper, only a suggested one-dimensional convolutional neural network model (1D-CNN). In general, CNN model had the benefit of capturing high-order interactions between the image and the target class to make accurate predictions. In other words, the prediction model is used to predict a target class for a given instance [20]. CNN can simulate the human brain and one of the main significant benefits of CNN is to predict the diseases. Generally, the distinctive CNN is made up of two main components which are feature extractor and classifier that are clarifying as follows:
3.3.1 Feature extractor
It is the first phase of CNN works; it makes to extract features and convert them into feature maps. CNN consists of multiple filters each with a specific task, multiple feature maps resulted accordingly which are corresponding to multiple filters. The features extraction process passes through some steps to generate the final low dimensional feature vector which is finally fed into a classifier. Feature extractor consists of multiple layers (multiple convolution layers with optional pooling layers). In the first step, it passes through convolution layer to convolve the filter with the input and produces feature maps which are reduced later with pooling layer. Then, it uses the previously generated feature maps to be as input feature maps and applies the same process on them, it still goes on layer by layer and extract powerful feature and get smaller size feature maps. After that, the final powerful feature, reduced dimension feature maps are flattened to generate low dimensional feature vector to be fed into classifier [21].
3.3.2 Classifier
After feature maps are extracted and dimensions are reduced by selecting the best features between them, low dimensional feature vector fed into a classifier. The classifier returns the likelihood of class that the input may belong to it [22]. The classifier includes one or more completely connected layers to do that purpose [23].
3.4 Building prediction model
Before applying the prediction model, the reduced dataset is divided into two phases called the training set and testing set. Typically, when the dataset divides the data into a training set and a testing set, with the majority of the data utilized for training, testing is done using a smaller percentage of the data. The dataset is divided here into training (sixty percent) and testing set (forty percent). Generally, building the prediction model represents the most important step in the proposed system. In this paper, CNN model is utilized since it is straightforward to examine while also having a high level of dataset managing ability. It also has the ability to reach the highest prediction accuracy. All CNN models are of the same structure which is the best one according to trial and error and the 1D-CNN structure is the best one between the numerous structures experiment. The CNN model with carefully selected input data is applied for its observed effectiveness to offer satisfying results, and boosting prediction performance. Therefore, the proposed system was based on the CNN model for predicting samples [24]. The CNN is considered to be black box which is made to extract features according to pre-specified parameters and is proposed to predict overlain tumor for providing the desired results [24]. Figure 4 shows the structure of the CNN model used and the proposed structure of the CNN model in Table 1.
Figure 4. Structure of the used CNN model [25]
Table 1. CNN model proposed structure
|
Layer (Type) |
Layer Information |
Output Shape |
Params Number |
|
convo1d_1 (Conv1D) activation_1 (Activation) max-pooling1d_1 (MaxPooling 1D) |
No. of filters =16, filter size (3,3) ReLU Pool size (2,2) |
(None, 148, 16) (None, 148, 16) (None, 74, 16) |
64 0 0 |
|
convo1d_2 (Conv1D) activation_2 (Activation) max-pooling1d_2 (MaxPooling 1D) |
No. of filters =32, filter size (3,3) ReLU Pool size (2,2) |
(None, 72, 32) (None, 72, 32) (None, 36, 32) |
1568 0 0 |
|
convo1d_3 (Conv1D) activation_3 (Activation) max-pooling1d_3 (MaxPooling 1D) |
No. of filters =64, filter size (3,3) ReLU Pool size (2,2) |
(None, 34, 64) (None, 34, 64) (None, 17, 64) |
6208 0 0 |
|
Flatten dense_1 (Dense) dropout_1 (Dropout) |
256 0.6 |
(None, 1088) (None, 256) (None, 256) |
0 27874 0 |
|
dense_2 (Dense) dropout_2 (Dropout) dense_3 (Dense) |
512 0.6 1024 |
(None, 512) (None, 512) (None, 1024) |
131584 0 525312 |
|
dense_4 (Dense) |
Number of classes |
(None, 3) |
3075 |
The evaluate the performance of the suggested strategy, we used four metrics: Generally speaking, sensitivity, specificity, and accuracy [26]. These measurements written as the following equations:
Accuracy $=\frac{T P+T N}{T P+F N+F P+T N} $ (1)
Sensitivity $=\frac{T P}{T P+F N}$ (2)
Specificity $=\frac{T N}{T N+F P}$ (3)
where, TP stands for a true positive, TN for a true negative, FP for a false positive, and FN for a false negative in the sensitivity, specificity, and accuracy equations. During the deep learning model's training phase, the error (difference between the prediction and the provided real class label) is calculated using a loss function. qqThere are numerous loss functions that can be employed, depending on the application, to assess the error of the final prediction.
For example, mean squared error, categorical cross-entropy and binary cross-entropy. The cross-entropy is a measure of the difference between two probability distributions for a given random variable or set of events. The cross entropy is a useful error measure for neural network training, especially for classification tasks. It is computationally efficient, provides a measure of uncertainty, and encourages well-calibrated models. One of the main disadvantages of cross-entropy loss is that it can be sensitive to outliers and imbalanced data. Cross-categorical entropy is used here to define a loss when the categorical outcomes is a no binary, that is, more than 2 possible outcomes (Yes/No/Maybe) and the mathematical form of loss function would be:
Loss $=-\sum_{i=1}^n y_i^{\prime} \log _2\left(y_i\right)$ (4)
where, n is the number of samples, $y_i^{\prime}$ is the target label, and yi is the output of the classifier [27].
In this section, we offer an empirical examination of the 1D-CNN on the ultrasound pictures dataset presented before. We describe the experimental paradigm before moving on to our discussion of the findings and results. An important but understudied topic is the accurate segmentation of ovarian cancers based on ultrasound images. The high rate of metastasis of ovarian cancer in particular results in a variety of tumor sizes, forms, and locations. Convolutional procedures were used in limited regions by conventional CNN-based tumor segmentation techniques to learn in-depth inherent properties of the input pictures, consequently, as a result of the local receptive field, restricted the prediction's accuracy. A novel graph convolutional module was developed to solve this problem.
At this stage, the CNN model is proposed and proven it’s efficient to classification ovarian tumors. The best subset of image obtained from the segmentation method which is important to get the highest possible accuracy. In general, CNN model for this paper is built using a python package called Keras. A high-level neural network toolkit called Keras was created to facilitate quick experimentation. According to high level, there is no requirement to write code in order to send output from one layer to another. All the requirements to know are the neural network architecture and input data with where the network can be trained. As a result, Keras is appropriate for research in which prototype may be quickly constructed and tested. Particularly, CNN model has been chosen and its architecture consists of sixteen layers, including three convolution layers, three activation function and three max-pooling layers for features extraction and one flatten layer. It is following by four fully-connected layers (three hidden and one output) and two dropout layers for prediction. The dropout layer is a regularization technique used to prevent overfitting in neural networks. It works by randomly dropping out (setting to zero) a certain percentage of input units during training. This forces the network to learn more robust features that are useful in making predictions on new data. The dropout rate is typically set between 0.2 and 0.5, with higher rates resulting in more regularization, which reduces the number of parameters in the model and helps prevent overfitting.
The first layer is the convolutional layer with 3×3 core size and 16 different filters. The second layer is a Rectified Linear Unit (ReLU), which is used as the nonlinear activation function, then followed by a max-pooling in layer three. A conv layer with 3×3 kernel size, 32 different filters, and ReLU activation function are implemented in the fourth and fifth layers. The maximum aggregation layer is at layer six.The seventh layer is the convolution layer with kernel size 3×3 and 64 different filters. The eighth layer is a ReLU activation function and also followed by a max-pooling in layer nine. The tenth layer is the flatten layer. Then, A completely connected layer with 256 neurons and a ReLU activation function makes up the eleventh layer. There is a layer dropdown in layer number twelve to overcome the problem of overfitting.
The 13 layer is a fully connected layer containing 512 neurons, with ReLU activation function.The fourteenth layer is the dropout layer. The fifteenth layer is a fully connected layer with 1024 neurons, and a ReLU activation function. The last fully connected layer has 3 neurons to classification for the ovarian tumors in layer number sixteen and uses a softmax layer as a prediction layer.
In addition, categorical cross entropy as the loss function to compute the loss, accuracy as a metric and the Adaptive Moment Estimation (ADAM) optimizer with learning-rate 0.0001 are selected for CNN model. This model is trained with 100 epochs. Both accuracy and loss are used to evaluate the classification model proposed. The performance of the classify model (Convolutional Neural Network) has been evaluated using the training and testing process. Generally, all the images that appeared as influencing images are taken. Then entered into the model to ensure their importance as well as the extent of accuracy that would be reached by using these images. Actually, the accuracy is dramatically increased after using the segmentation the images. Since the process of identifying the informative segment which passed through several stages and most of segmentation techniques are used. The CNN model's comparing accuracy and loss results before and after applying the segmentation the images method is illustrated in Table 2.
Table 2. The comparative results of accuracy and loss for the CNN model
|
The Method |
Accuracy |
Loss |
|
Raw images + CNN |
0.432 |
1.097 |
|
segmentation + CNN |
0.987 |
0.080 |
Figure 5. Presents the outcomes
Figure 6. Percentage of accurately
The Figure 5 presents the outcomes. Pictures of benign and malignant tumors were both included when the threshold for the confidence score was set at 95%, at a rate of 61.71% and 58.57%, respectively. That instance, when the confidence score was adjusted to between 95 and 100%, approximately 40% of the photos among the accurately interpreted data needed manual reinterpretation; this defies the goal of employing to reduce work and time, use the auxiliary diagnostic system. Results from a ConvNN shows that the total classification performance is 98.79 percent accurate, as shown in Figure 6.
In the current study, we suggested an automated approach that uses a CNN to decipher ultrasound images of ovarian tumors. Any image consists of both practical and useless information, depending on the user's interest. Image segmentation separates an image into regions with its particular shape and border, delineating potentially meaningful areas for further processing; hence, we need to use segmentation. Semantic segmentation is the suggested technique. The goal is to distinguish and separate the ovarian tumor from the nearby healthy organisms. The goal is to distinguish and separate the ovarian tumor from the nearby healthy organisms. The proposed classification deep learning method, performed via the CNN model, is superior to conventional machine learning techniques for detecting objects from many aspects. Generally, the CNN model can produce ovarian tumors from ultrasound images with less possible error after the information have been identified through the sequential segmented selection method. Accordingly, according to some evaluation measures, the proposed system gives promising results in predicting ovarian tumors. To check for model robustness, we ten times over sampled randomly from the training and validation data. To fulfill our primary goal, the study must be given increased emphasis. A few value-added qualities may be provided by instance segmentation, such as the ability to distinguish between specific tumor nodules inside a large tumor organism block. It might be a potential area for this study's future focus. Future research should look into how to spot malignancies in ultrasound imaging. Tumors are rarely seen in ultrasound images taken by ultrasound devices in clinical settings. We can speed up picture screening and preprocessing while lowering the possibility of incorrect diagnosis if we can successfully identify ovarian tumors in an image.
[1] Hsu, S.T., Su, Y.J., Hung, C.H., Chen, M.J., Lu, C.H., Kuo, C.E. (2022). Automatic ovarian tumors recognition system based on ensemble convolutional neural network with ultrasound imaging. BMC Medical Informatics and Decision Making, 22(1): 298. https://doi.org/10.1186/s12911-022-02047-6
[2] Bir-Jmel, A., Douiri, S.M., Elbernoussi, S. (2019). Gene selection via a new hybrid ant colony optimization algorithm for cancer classification in high-dimensional data. Computational and Mathematical Methods in Medicine, 2019: 7828590. https://doi.org/10.1155/2019/7828590
[3] Ahmed, S.T., Kadhem, S.M. (2021). Using machine learning via deep learning algorithms to diagnose the lung disease based on chest imaging: A survey. International Journal of Interactive Mobile Technologies, 15(16): 95. https://doi.org/10.3991/ijim.v15i16.24191
[4] Dash, S., Patra, B. (2013). Redundant gene selection based on genetic and quick-reduct algorithms. International Journal on Data Mining and Intelligent Information Technology Applications, 3(2): 1–9.
[5] Hameed, E.M., Hussein, I.S., Altameemi, H.G., Kadhim, Q.K. (2022). Liver disease detection and prediction using SVM techniques. In 2022 3rd Information Technology to Enhance E-Learning and Other Application (IT-ELA), pp. 61-66. https://doi.org/10.1109/IT-ELA57378.2022.10107961
[6] Wang, H., Liu, C., Zhao, Z., Zhang, C., Wang, X., Li, H., Wu, H.X., Liu, X.F., Li, C.X., Qi, L., Ma, W. (2021). Application of deep convolutional neural networks for discriminating benign, borderline, and malignant serous ovarian tumors from ultrasound images. Frontiers in Oncology, 11: 770683. https://doi.org/10.3389/fonc.2021.770683
[7] Zhu, L., He, Y., He, N., Xiao, L. (2021). Computed tomography image based on intelligent segmentation algorithm in the diagnosis of ovarian tumor. Scientific Programming, 2021: 7323654. https://doi.org/10.1155/2021/7323654
[8] Ahmed, S.T., Kadhem, S.M. (2022). Early Alzheimer's disease detection using different techniques based on microarray data: A review. International Journal of Online & Biomedical Engineering, 16(4).
[9] Ko, S.Y., Lee, J.H., Yoon, J.H., Na, H., Hong, E., Han, K., Jung, I., Kim, E.K., Moon, H.J., Park, V.Y., Lee, E., Kwak, J.Y. (2019). Deep convolutional neural network for the diagnosis of thyroid nodules on ultrasound. Head & Neck, 41(4): 885-891. https://doi.org/10.1002/hed.25415
[10] Kadhim, Q. K., Altameemi, A. and Jasim, S. (2023). Artificial intelligence techniques for colon cancer detection: A review. Journal of Yarmouk, 21(2): 11-18. https://www.iasj.net/iasj/article/289579.
[11] Jang, J., Wang, C., Zhang, X., Choi, H.J., Pan, X., Lin, B., Yu, Y.D., Whittle, C., Ryan, M., Chen, Y., Lee, K. (2021). A deep learning-based segmentation pipeline for profiling cellular morphodynamics using multiple types of live cell microscopy. Cell Reports Methods, 1(7): 100105. https://doi.org/10.1016/j.crmeth.2021.100105
[12] Khadhim, B.J., Kadhim, Q.K., Shams, W.K., Ahmed, S.T., Wahab Alsiadi, W.A. (2023). Diagnose COVID-19 by using hybrid CNN-RNN for chest X-ray. Indonesian Journal of Electrical Engineering and Computer Science, 29(2): 852-860. https://doi.org/10.11591/ijeecs.v29.i2.pp852-860
[13] Zhao, Q., Lyu, S., Bai, W., Cai, L., Liu, B., Wu, M., Sang, X., Yang, M., Chen, L. (2022). A multi-modality ovarian tumor ultrasound image dataset for unsupervised cross-domain semantic segmentation. arXiv preprint arXiv:2207.06799. https://arxiv.org/abs/2207.06799
[14] Schwartz, D., Sawyer, T.W., Thurston, N., Barton, J., Ditzler, G. (2022). Ovarian cancer detection using optical coherence tomography and convolutional neural networks. Neural Computing and Applications, 34(11): 8977-8987. https://doi.org/10.1007/s00521-022-06920-3
[15] Micci, F., Haugom, L., Ahlquist, T., Abeler, V.M., Trope, C.G., Lothe, R.A., Heim, S. (2010). Tumor spreading to the contralateral ovary in bilateral ovarian carcinoma is a late event in clonal evolution. Journal of Oncology, 2010: 646340. https://doi.org/10.1155/2010/646340
[16] Nagarajan, P.H., Tajunisha, N. (2021). Automatic classification of ovarian cancer types from CT images using deep semi-supervised generative learning and convolutional neural network. Revue d'Intelligence Artificielle, 35(4): 273–280. https://doi.org/10.18280/ria.350401
[17] Zheng, Y., Wang, F., Zhang, W., Li, Y., Yang, B., Yang, X., Dong, T. (2022). Preoperative CT-based deep learning model for predicting overall survival in patients with high-grade serous ovarian cancer. Frontiers in Oncology, 12: 986089. https://doi.org/10.3389/fonc.2022.986089
[18] Kadhim, Q.K. (2017). Classification of human skin diseases using data mining. International Journal of Advanced Engineering Research and Science, 4(1): 237008. https://doi.org/10.22161/ijaers.4.1.25
[19] Maria, H.H., Jossy, A.M., Malarvizhi, S. (2022). A Machine Learning approach for classification of ovarian tumours. In Journal of Physics: Conference Series, 2335(1): 012018. https://doi.org/10.1088/1742-6596/2335/1/012018
[20] ArathiBoyanapalli, M. (2020). A study of preprocessing techniques and features for ovarian cancer using ultrasound images. European Journal of Molecular & Clinical Medicine, 7(10): 293-303.
[21] Kasture, K.R., Choudhari, D., Matte, P.N. (2022). Prediction and classification of ovarian cancer using enhanced deep convolutional neural network. International Journal of Engineering Trends and Technology, 70(3): 310–318. https://doi.org/10.14445/22315381/IJETT-V70I3P235
[22] Dhahi, S.H., Dhahi, E.H., Khadhim, B.J., Ahmed, S.T. (2023). Using support vector machine regression to reduce cloud security risks in developing countries. Indonesian Journal of Electrical Engineering and Computer Science, 30(2): 1-8. http://doi.org/10.11591/ijeecs.v30.i2.pp1159-1166
[23] Kasture, K.R. (2021). A new deep learning method for automatic ovarian cancer prediction & subtype classification. Turkish Journal of Computer and Mathematics Education (TURCOMAT), 12(12): 1233-1242.
[24] C, Sindhuja, K.S. (2020) Ovary tumor prediction using R–CNN. International Journal of Advanced Research in Engineering and Technology, 11(10): 1670-1679. https://paper.researchbib.com/view/paper/273029.
[25] Yaar, A., Asif, A., Raza, S.E.A., Rajpoot, N., Minhas, F. (2020). Cross-domain knowledge transfer for prediction of chemosensitivity in ovarian cancer patients. In Proceedings of the IEEE/CVF Conference on Computer Vision and Pattern Recognition Workshops, pp. 928-929. https://doi.org/10.1109/CVPRW50498.2020.00472
[26] Mohammed, H.A., Nazeeh, I., Alisawi, W.C., Kadhim, Q.K., Ahmed, S.T. (2023). Anomaly detection in human disease: A hybrid approach using GWO-SVM for gene selection. Revue d'Intelligence Artificielle, 37(4): 913-919. https://doi.org/10.18280/ria.370411
[27] Ahmed, S.T., Kadhim, Q.K., Mahdi, H.S., Abd Almahdy, W.S. (2021). Applying the MCMSI for online educational systems using the two-factor authentication. International Journal of Interactive Mobile Technologies, 15(13): 162-171. https://doi.org/10.3991/ijim.v15i13.23227