Dilli Babu Mani*![]() | Sambath Munusamy
| Sambath Munusamy![]()
© 2023 IIETA. This article is published by IIETA and is licensed under the CC BY 4.0 license (http://creativecommons.org/licenses/by/4.0/).
OPEN ACCESS
Cardiovascular diseases remain the leading cause of mortality on a global scale. Currently, healthcare organizations are shifting their operational strategies to enhance efficiency and reduce costs. For this transition, the integration of analytics into IT strategy is imperative. Data lakes, which aggregate data from multiple sources and employ analytical models, provide an innovative approach to information management, reporting, and predictive analytics. These models enable the production of advanced analytical insights, the implementation of evidence-based care plans, and the improvement of patient engagement outcomes, thus setting the stage for IoT-based prognostic systems aimed at reducing mortality rates. The present research proposes a comprehensive data analysis for the prognosis of coronary heart disease, a task that poses considerable challenges due to the volume of data across various disciplines and the complexity involved in analyzing, extracting, managing, and configuring data with massive data technologies and tools. To tackle this challenge, a multi-level fuzzy rule generation is suggested for identifying the features used in heart disease prediction. These features are then trained using an optimized recurrent neural network. The features are classified into labeled classes based on the risk assessment of a medical professional, enabling the prediction of the class based on risk. Early diagnosis and treatment are thus facilitated. When benchmarked against traditional systems, the proposed approach demonstrates superior performance, validating its potential for efficient heart disease prediction.
data analysis, healthcare, fuzzy rule, diagnosis, neural network
Globally, cardiovascular illnesses are the leading cause of death. The healthcare sector is undergoing innovation shift as healthcare organizations adjust their plans of action to boost operational efficiencies and cut costs. Analytics must play a key role in IT strategy in order to accommodate this transition. In order to produce advanced analytic insights, implement evidence-based care plans, and enhance patient engagement results, a data lake pools data from many sources and uses analytical models to offer a novel approach to information management, reporting, and predictive analytics. The ability to predict your health is crucial in today's world. Big data analysis is crucial for forecasting future a person's state and exceptional health outcomes. The main cause of death in the world is heart disease. The forecasting study is still being researched utilizing machine learning methods that produce the greatest outcomes. Health prognosis is now crucial in today's world. Big data analysis is crucial for predicting people's future status and excellent health outcomes.
The leading cause of death worldwide is cardiovascular disease. The forecasting study is still being researched utilizing machine learning methods that produce the greatest outcomes. We therefore predict that heart disease will aid in decision-making, whether there are different diseases available for those activities or to learn more. According to the World Health Organization, the main reason it happened is that heart disease is one of the diseases of its preference. A massive data method is used to determine heart disease. The probabilistic categorization based on neural networks and the independence between functions are provided as assumptions. A good method for big data analysis is naive Bayes, especially for large datasets. When using feature-based deep neural classification to predict cardiac disease, computational intelligence is crucial. The relationships between patient traits and various diseases deemed to be features can be identified using the concepts employed in computer-based intelligence. Many researchers today have used feature selection methods to predict heart disease in their work. Variable selection or attribute selection are other names for facility selection. The choice of facilities changes as dimensions are reduced. Subgroup selection focuses on the selection of facilities to decrease the number of incorrect characteristics, whereas dimension reduction reduces the attribute set by generating new attributes from the particular attribute set. The healthcare sector generates enormous amounts of data. Innovative analytic models are being developed by the healthcare sector to detect high risk patients, implement evidence-based medication, and decrease infections and adverse events.
By proactively classifying community members who are at risk, finding treatment gaps, and enhancing patient involvement, healthcare organizations will be required by new pay-for-performance models to enhance quality and cut costs. To create treatment regimens that risk-stratify patients, lessen the need for emergency care, and avoid hospital readmissions, new techniques are required. For accurate diagnosis and better results, real-time analytics are required. Additionally, analytics can give insight into how to improve staffing schedules, manage IT resources more effectively, and spot trends in services that can be leveraged in marketing. The volume of data that could be available for study makes managing the flow of data effectively a difficulty. A solution must quickly deliver the outcomes of data analysis to several devices. A data lake provides a technological framework that gathers data created across the health system, as well as data supplied from external sources and services. To better manage risks and provide accessible, higher-quality healthcare, the data lake can provide actionable insights about an organization's performance metrics and the effects of patient care activities. By layering a data lake with information-rich data sources, analytical tools, and data science best practices, an enterprise hybrid cloud framework enables service providers to link and correlate data in entirely new ways. With the use of a data lake, healthcare organizations can combine old systems and data with information from fresh sources, such as cloud services, social media, or outside sources like payers.
Healthcare providers can employ data lakes to execute data analytics across many systems that are running databases, data warehouses, and structured or unstructured data sets without affecting regular business operations or data access. Finally, when they make the switch to value-based care, healthcare providers can use the data lake to accelerate their analytics time-to-value. Going forward, a crucial differentiation for providers in a cutthroat market will be the utilization of advanced analytics for next-generation care delivery. Providers may offer better patient outcomes, encounter fewer complications, make fewer unnecessary trips to the emergency room, and improve population wellness all while paying less thanks to data science based on predictive analytics.
At current time, heart disease ranks as the leading cause of death worldwide. The World Health Organization (WHO) predicts that during the years to come, heart disease will continue to be the leading cause of death. Additionally, it has long been linked to a heavy societal impact. Therefore, a high demand is preferred to significantly enhance cardiovascular health [1]. Utilizing online medical services is possible with the most recent advancements in demographic and perceptive technologies [2]. Demographic instruments are producing a lot of statistical information in the medical profession, and the use of cloud computing is currently utilised to handle a lot of data [3]. Tools for population-based healthcare, like the cloud, are being created to track significant diseases and to track them so that consumers of online medical services can receive better care [4]. In this research, a successful model was created combining medical sensors and the UCI repository database to foretell the prevalence of heart disease in the community. To appropriately extract information collected by intermediate sensor systems [5] and preserve information on servers in the cloud in real-time Bayesian sensor networks (BSN), the demographic framework was built. On the basis of such audit data, attempts are made to identify false data to forecast the incidence of heart disease [6]. To accomplish rigorous monitoring for disease diagnosis, we will discuss certain in-depth learning methods as well as a number of machine learning algorithms in the current research. EHR data retrieval is made simpler, yet the data quality is still very high. The issue whether or not EHR data are necessarily incorrect and improper for accurate accuracy thus emerges [7, 8].
The outcome of an EHR-based risk framework is also approached by machine learning studies when a single group is determined by means of metadata that involves an EHR input converter, which is further hampered by the absence of relevant informational abilities [9]. Therefore, it is anticipated that improved modelling methodologies, sophisticated machine learning techniques, and increased data resources would enhance the effectiveness of current forecasting algorithms. Health research downplays the significance of multiple data processing techniques [10] despite being warned that these developments will outline their benefits and drawbacks [11] and reiterating the difficulties and problems with health record processing technique [12, 13]. Long-standing research interests include the forecasting of cardiovascular risk using medical information [14, 15]. The prediction's accuracy is still sufficient despite extensive attempts. The inherent data level that hinders the effectiveness of machine learning, statistical, and other methods [16, 17], as well as conventional techniques, and causes feature analysis problems to provide inaccurate predictions [18, 19], is questioned by this lack of data. In the study [20, 21], the author described a medical data classification method that calculates the impact measure on several levels to determine the target class. The approach is built on various attributes and repeated influence measures. The categorization of heart disease utilizing ANN and feature selection is presented in this study [22]. A patient's requirement for a doctor is decreased by minimising the number of features and diagnostic tests [23]. The outcomes of this database analysis on heart disease indicate that accuracy is superior to traditional categorization methods. The outcomes also demonstrate how quick and precise this technology works.
This study's suggested methodology integrates installation with an opensource UCI database. Once the database has been verified, the following phases involve data processing, including preprocessing, data cleaning, data transfer, data optimization, binning, and selecting attributes. The primary technology selection for features would be utilized once all these techniques have been applied to the downloaded database. Information using a medical database is acquired through an open-source database known as the UCI repository in order to perform data analysis. The group cardiac dataset is displayed in Table 1. Figure 1 depicts the overall workflow of the proposed system.
Features includes a feature for predicting cardiac disease. In addition to dimension reduction, the classification learning model aims to accomplish the following three objectives: (A) Recognize that it is advantageous to highlight the database's strongest points. We shall evaluate the (ii) feature selection and technology performance over time. (b) Determine the optimal performance and educate yourself on the categorization model. The dynamic packet size ranges from 64 KB to 1 MB. The set of sensors that will remain active for the entire period and the paths that are open across the sensors are both determined at the moment by the topological restrictions. Now that the routes have been determined, the LSM's value has been calculated. In accordance with the calculated LSM value, a single route with the highest LSM is used for data transmission in order to select the appropriate source of the IoT medium. The collected data from IoT device sensors is transported during the Neighboring Route Discovery step to transmit through the WSN network medium. It records information about the subsequent topology as well as information about the sensors in the first shared network. The boot data includes details on the preceding duty cycle's sensor number, its status, and the number of transactions by cycle time. The network's sensors are inundated with this information. The sensor now determines the duty cycle time, the rotation site, and the amount of time it should spend working on its detection if it has data to send. The set of sensors that will remain active for the cycle and the paths that are open around the sensors are both determined at the moment by the topological restrictions. Now that the routes have been determined, the LSM's value has been calculated. In accordance with the calculated LSM value, a single route with the highest LSM is used for data transmission in order to select the appropriate source of the IoT medium.
Take into account the first packet P received from the shortest way; the list of routes can be classified as connective nodes based on their locations as follows.
$N_{\text {list }}=\sum S_{\text {id }}$, Loc,$T_{\text {nodes }}$, State $_{\text {current }} \in \operatorname{Payload}(P)$
The node list $\mathrm{N}_{\text {list }}$ contains $\mathrm{S}_{\mathrm{id}}$, the sensor id, Loc, its location, and $\mathrm{T}_{\text {nodes }}$, the numerous transmission nodes and $\mathrm{State}_{\text {current }}$, the current state.
The set of routes that are available in wakeup mode is initially determined using the information contained in of Nlist as follows:
$W_{\text {list }}=\int_{i=1}^{\text {size }\left(N_{\text {list }}\right)} \sum N_{\text {list }}(i) \cdot$ state $==$ Sleep
Pursuant to the prior state, the aforementioned equation determines the set of wakeup nodes during the current duty cycle. The sensor node is being taken into account for the current duty cycle if it is dozing off in the previous state. With the understanding that the IOT range follows the same sensor node throughout the transmission range, the potential paths from the set of wakeup nodes to a sink have been determined.
Neighbor $_{\text {list }}=\int_{i=1}^{\text {size }\left(N_{\text {list }}\right)} \sum W_{\text {list }_{(i)}} \cdot \operatorname{loc}\left\langle\right.$s.loc & s. $\left.T_{\text {range }}\right\rangle$
In the above equation '$\mathrm{s}$' is the sensor node, $\mathrm{T}_{\text {range }}$ is the transmission range. The route list derived from the transmission medium will identify the closest neighbour.
Route $_{\text {list }}=\int_{i=1}^{\left(\text {size }\left(N_{\text {list }}\right)\right)} \sum \operatorname{Routes}\left(N_{\text {list }_i}\right.$, Destination $) \in Network$
Scheduling is done using a set of routes that the source discovered.
The procedure will then calculate the LMS value for each route R in the Route List before choosing the route with the highest LMS. The chosen route is scheduled, and the remaining nodes are scheduled using the route list that is provided.
Figure 1. Overall workflow
Table 1. Cardiac dataset features
|
Age |
Sex |
Cp |
Trestbps |
Chol |
Fbs |
Testecg |
Halach |
Exang |
Oldpeak |
Slope |
Ca |
Thal |
Target |
|
63 |
1 |
3 |
145 |
233 |
1 |
0 |
150 |
0 |
2.3 |
0 |
0 |
1 |
1 |
|
37 |
1 |
2 |
130 |
250 |
0 |
1 |
187 |
0 |
3.5 |
0 |
0 |
2 |
1 |
|
41 |
0 |
1 |
130 |
204 |
0 |
0 |
172 |
0 |
0.8 |
2 |
0 |
2 |
1 |
|
56 |
1 |
1 |
120 |
236 |
0 |
1 |
178 |
0 |
0.8 |
2 |
0 |
2 |
1 |
|
57 |
0 |
0 |
120 |
354 |
0 |
1 |
163 |
1 |
0.6 |
2 |
2 |
2 |
1 |
3.1 Multi‑level fuzzy rule generation
In order to choose the outlying features, this phase takes into account the characteristics of multi-correlation similarity assessment. Rough set groups are created in order to classify the fuzzy rules. In order to verify that the condition belongs to the feature limits as well as well-defined selected features, the fuzzy membership creates the absolute mean rate between lower and upper bound limits. By selecting the maximum weights that are closest to each unique class, a decision tree traversal is created. The fuzzy rules determine the fuzzy inference system's rule base, which in turn determines the system's accuracy and quality. There are 17 rules in this system. We can forecast as an expert judgement using these 17 rules. The following are the guidelines: LDL is low density lipids, HDL is high density lipids, TG is triglycerides, SS is systolic, DS is diastolic and HD is heart disease, L is low, VL is very low, H is high, VH is very high and M is Medium.
If (LDL is VL) and (HDL is H) and (TG is L) and (SS is L) and (DS is L) then (HD is VL).
If (LDL is L) and (HDL is H) and (TG is L) and (SS is L) and (DS is L) then (HD is VL).
If (LDL is VH) and (HDL is H) and (TG is L) and (SS is L) and (DS is L) then (HD is H).
If (LDL is H) and (HDL is H) and (TG is L) and (SS is L) and (DS is L) then (HD is H).
If (LDL is VH) and (HDL is H) and (TG is L) and (SS is L) and (DS is L) then (HD is H).
If (LDL is VL) and (HDL is M) and (TG is L) and (SS is L) and (DS is L) then (HD is H).
If (LDL is VL) and (HDL is L) and (TG is L) and (SS is L) and (DS is L) then (HD is H).
If (LDL is VL) and (HDL is L) and (TG is H) and (SS is L) and (DS is L) then (HD is H).
If (LDL is VL) and (HDL is L) and (TG is VH) and (SS is L) and (DS is L) then (HD is VH).
If (LDL is VL) and (HDL is L) and (TG is VH) and (SS is M) and (DS is L) then HD is VH).
If (LDL is VL) and (HDL is L) and (TG is VH) and (SS is H) and (DS is L) then (HD is VH).
If (LDL is VL) and (HDL is L) and (TG is VH) and (SS is L) and (DS is L) then (HD is VH).
If (LDL is VL) and (HDL is L) and (TG is VH) and (SS is VH) and (DS is H) then (HD is VH).
If (LDL is VL) and (HDL is L) and (TG is VH) and (SS is H) and DS is VH) then (HD is VH).
If (LDL is L) and (HDL is H) and (TG is L) and (SS is VH) and (DS is L) then (HD is VL).
If LDL is VL) and (HDL is M) and (TG is L) and SS is L) and (DS is L) then (HD is VL).
If (LDL is VL) and (HDL is M) and (TG is L) and (SS is L) and (DS is L) then (HD is VL).
If the input value is high, the patient has a high risk of developing heart disease; if the input value is low, the patient has a low risk of developing heart disease; similarly, if the input value is normal, the result will also be normal or the likelihood of developing heart disease in the case of borderline high values. With the use of this, we can determine whether the patient is at risk for heart disease. Additionally, this is typically the most straightforward and effective method for identifying cardiac problems. The accuracy of this system's predictions is 90% higher than that of the expert's statistical analysis. By using this disease prediction, the doctor can advise patients on preventive actions to lower their risk of developing a heart condition or, in the case that they currently have one, to prevent further complications. Figure 2 displays the surface viewer for high density and low density lipids to heart disease.
Figure 2. Surface viewer for high density and low density lipids to heart disease
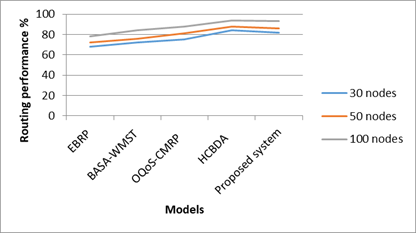
The proposed system is implemented using Python language. The simulator used is IoTIFY. THe number of features taken from the heart disease UCI dataset is 30. The number of sensors used is 100 and the number of IOT devices in the network is 30. The Table 2 gives the comparison between routing performance with varied number of nodes. Figure 3 depicts the routing performance of different models compared with proposed model. The proposed system gave better routing performance than the existing system.
Table 2. Routing performance
|
|
30 nodes |
50 nodes |
100 nodes |
|
EBRP |
68 |
72 |
78 |
|
BASA-WMST |
72 |
76 |
84 |
|
OQoS-CMRP |
75 |
81 |
88 |
|
HCBDA |
84 |
88 |
94 |
|
Proposed system |
82 |
86 |
93 |
Figure 3. Routing performance
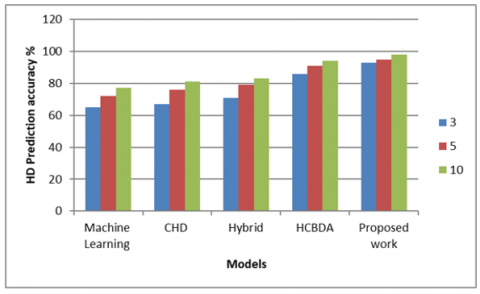
Table 3 gives the heart disease prediction accuracy with varied number of features selected from the UCI dataset. It can be inferred from Figure 4 that the heart disease prediction accuracy increases with the number of features selected from the dataset.
Table 3. Number of features and heart disease prediction
|
|
3 |
5 |
10 |
|
Machine Learning |
65 |
72 |
77 |
|
CHD |
67 |
76 |
81 |
|
Hybrid |
71 |
79 |
83 |
|
HCBDA |
86 |
91 |
94 |
|
Proposed work |
93 |
95 |
98 |
Figure 4. Heart disease prediction accuracy
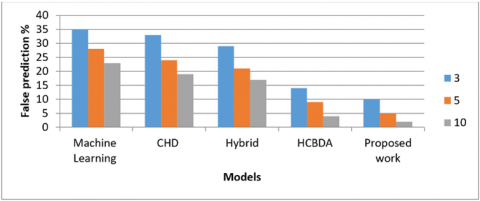
Table 4 shows the false prediction of heart disease against the number of features selected from the dataset. The proposed system gave a very less percentage of false heart disease prediction when compared with the existing systems. As the number of selected features from the dataset increased, the false prediction of heart diseases decreased. Figure 5 depicts the false prediction of heart diseases as compared with other models.
Table 4. Number of features and false prediction of heart disease
|
|
3 |
5 |
10 |
|
Machine Learning |
35 |
28 |
23 |
|
CHD |
33 |
24 |
19 |
|
Hybrid |
29 |
21 |
17 |
|
HCBDA |
14 |
9 |
4 |
|
Proposed work |
10 |
5 |
2 |
Figure 5. False prediction of heart disease
In this study, we have presented our Intelligent Model for reducing the dimensionality of data analysis and anticipating heart illness. By incorporating fuzzy rules to enhance the functionality of information observation from Internet of Things (IoT) devices, we have achieved effective cardiac disease prediction. Our model not only offers accurate predictions but also provides users with valuable insights into their likelihood of an early diagnosis.
The feature-based classification strategy implemented in our proposed algorithm demonstrated superior performance compared to alternative methods. This achievement showcases the effectiveness of our approach in handling complex datasets and identifying crucial patterns for accurate predictions.
Looking forward, there are several promising future directions for advancing this research. One key area of focus is the continuous refinement and augmentation of our model to incorporate additional relevant features and data sources. Embracing emerging technologies and integrating more IoT devices will enable us to enhance the precision of cardiac disease prediction further.
Moreover, we aim to collaborate with healthcare experts and practitioners to validate and fine-tune our model with real-world clinical data. This will provide valuable insights and ensure the practical applicability of our intelligent system in the medical domain.
Additionally, we recognize the significance of explainability and interpretability in predictive models, particularly in the healthcare domain. As such, future research will prioritize developing techniques to explain the decisions made by our model, thereby gaining users' trust and fostering wider adoption in clinical settings.
Furthermore, our research holds great potential for expansion into proactive healthcare interventions. By leveraging the early diagnosis predictions generated by our model, we can design personalized preventive strategies for individuals at higher risk of heart disease, potentially leading to reduced morbidity and mortality rates.
In conclusion, our Intelligent Model stands as a promising tool in cardiac disease prediction, with its feature-based classification strategy outperforming alternative methods. With continued research and collaboration with healthcare experts, we strive to further enhance its accuracy and applicability. By enabling early detection and proactive interventions, our model has the potential to significantly impact public health outcomes, contributing to the gradual decline in heart disease-related mortality rates.
[1] Ganesan, M., Sivakumar, N. (2019). IoT based heart disease prediction and diagnosis model for healthcare using machine learning models. In 2019 IEEE International Conference on System, Computation, Automation and Networking (ICSCAN), Pondicherry, India, pp. 1-5. https://doi.org/10.1109/ICSCAN.2019.8878850
[2] Khatal, S.S., Sharma, Y.K. (2020). Analyzing the role of heart disease prediction system using IoT and machine learning. International Journal of Advanced Science and Technology, 29(9s): 2340-2346.
[3] Fahad, A., Alshatri, N., Tari, Z., Alamri, A., Khalil, I., Zomaya, A.Y., Foufou, S., Bouras, A. (2014). A survey of clustering algorithms for big data: Taxonomy and empirical analysis. IEEE Transactions on Emerging Topics in Computing, 2(3): 267-279. https://doi.org/10.1109/TETC.2014.2330519
[4] Banu, N.S., Swamy, S. (2016). Prediction of heart disease at early stage using data mining and big data analytics: A survey. In 2016 International conference on electrical, electronics, communication, computer and optimization techniques (ICEECCOT), Mysuru, India, pp. 256-261. https://doi.org/10.1109/ICEECCOT.2016.7955226
[5] Chen, M., Hao, Y., Hwang, K., Wang, L., Wang, L. (2017). Disease prediction by machine learning over big data from healthcare communities. IEEE Access, 5: 8869-8879. https://doi.org/10.1109/ACCESS.2017.2694446
[6] Archenaa, J., Anita, E.M. (2017). Health recommender system using big data analytics. Journal of Management Science and Business Intelligence, 2(2): 17-23. https://doi.org/10.5281/zenodo.835606
[7] Sheeran, M., Steele, R. (2017). A framework for big data technology in health and healthcare. In 2017 IEEE 8th Annual Ubiquitous Computing, Electronics and Mobile Communication Conference (UEMCON), New York, NY, USA, pp. 401-407. https://doi.org/10.1109/UEMCON.2017.8249095
[8] McPadden, J., Durant, T.J., Bunch, D.R., Coppi, A., Price, N., Rodgerson, K., Torre Jr, C., Byron, W., Hsiao, A.L., Krumholz, H.M., Schulz, W.L. (2019). Health care and precision medicine research: Analysis of a scalable data science platform. Journal of Medical Internet Research, 21(4): e13043.
[9] Lo’ai, A.T., Mehmood, R., Benkhlifa, E., Song, H. (2016). Mobile cloud computing model and big data analysis for healthcare applications. IEEE Access, 4: 6171-6180. https://doi.org/10.1109/ACCESS.2016.2613278
[10] Ismail, A., Shehab, A., El-Henawy, I.M. (2019). Healthcare analysis in smart big data analytics: Reviews, challenges and recommendations. In: Hassanien, A., Elhoseny, M., Ahmed, S., Singh, A. (eds) Security in Smart Cities: Models, Applications, and Challenges. Lecture Notes in Intelligent Transportation and Infrastructure. Springer, Cham. https://doi.org/10.1007/978-3-030-01560-2_2
[11] Pan, Y., Fu, M., Cheng, B., Tao, X., Guo, J. (2020). Enhanced deep learning assisted convolutional neural network for heart disease prediction on the internet of medical things platform. IEEE Access, 8: 189503-189512. https://doi.org/10.1109/ACCESS.2020.3026214
[12] Geetha, G., Safa, M., Fancy, C., Saranya, D. (2018). A hybrid approach using collaborative filtering and content based filtering for recommender system. Journal of Physics: Conference Series, 1000: 012101. https://doi.org/10.1088/1742-6596/1000/1/012101
[13] Geetha, G., Safa, M., Saranya, G., Subburaj, R. (2017). An effective practices, strategies and technologies in the service industry to increase customer loyalty using map indicator. In 2017 International Conference on IoT and Application (ICIOT), Nagapattinam, India, pp. 1-6. https://doi.org/10.1109/ICIOTA.2017.8073607
[14] Geetha, G., Safa, M., Fancy, C., Chittal, K. (2017). 3D face recognition using Hadoop. In 2017 International Conference on Energy, Communication, Data Analytics and Soft Computing (ICECDS), Chennai, India, pp. 1882-1885. https://doi.org/10.1109/ICECDS.2017.8389776
[15] Safa, M., Pandian, A. (2021). A review on big IoT data analytics for improving QoS-based performance in system: Design, opportunities, and challenges. In: Hemanth, D., Vadivu, G., Sangeetha, M., Balas, V. (eds) Artificial Intelligence Techniques for Advanced Computing Applications. Lecture Notes in Networks and Systems, vol 130. Springer, Singapore. https://doi.org/10.1007/978-981-15-5329-5_40
[16] Anandan, M., Manikandan, M., Karthick, T. (2020). Advanced indoor and outdoor navigation system for blind people using raspberry-pi. Journal of Internet Technology, 21(1): 183-195.
[17] Meenakshi, K., Maragatham, G. (2019). A review on security attacks and protective strategies of machine learning. Lecture Notes on Data Engineering and Communications Technologies, 35: 1076-1087. https://link.springer.com/chapter/10.1007/978-3-030-32150-5_109.
[18] Karthick, T., Amith Sai, A.V., Kavitha, P., Jothicharan, J., Kirthiga Devi, T. (2020). Emotion detection and therapy system using chatbot. International Journal of Advanced Trends in Computer Science and Engineering, 9(4): 5973-5978.
[19] Meenakshi, K., Sunder, R., Kumar, A., Sharma, N. (2017). An intelligent smart tutor system based on emotion analysis and recommendation engine. In 2017 International Conference on IoT and Application (ICIOT), Nagapattinam, India, pp. 1-4. https://doi.org/10.1109/ICIOTA.2017.8073608
[20] Ananthajothi, K., Subramaniam, M. (2019). Multi level incremental influence measure based classification of medical data for improved classification. Cluster Computing, 22: 15073-15080. https://doi.org/10.1007/s10586-018-2498-z
[21] Ananthajothi, K., Subramaniam, M. (2019). Efficient classification of medical data and disease prediction using multi attribute disease probability measure. Applied Mathematics & Information Sciences, 13(5): 783-789. http://dx.doi.org/10.18576/amis/130511
[22] Prasad, S.T., Sangavi, S., Deepa, A., Sairabanu, F., Ragasudha, R. (2017). Diabetic data analysis in big data with predictive method. In 2017 international conference on algorithms, methodology, models and applications in emerging technologies (ICAMMAET), Chennai, India, pp. 1-4. https://doi.org/10.1109/ICAMMAET.2017.8186738
[23] Bashir, S., Khan, Z.S., Khan, F.H., Anjum, A., Bashir, K. (2019). Improving heart disease prediction using feature selection approaches. In 2019 16th International Bhurban Conference on Applied Sciences and Technology (IBCAST), Islamabad, Pakistan, pp. 619-623. https://doi.org/10.1109/IBCAST.2019.8667106