Suhair Hussein Talib*![]() | Osama Qasim Jumah Al-Thahab
| Osama Qasim Jumah Al-Thahab![]()
© 2023 IIETA. This article is published by IIETA and is licensed under the CC BY 4.0 license (http://creativecommons.org/licenses/by/4.0/).
OPEN ACCESS
Diabetic retinopathy causes blindness in diabetics. Early identification and frequent screening of diabetic retinopathy can slow disease progression and visual loss. Retinal lesions result from diabetic retinopathy. Dark and brilliant retinal lesions predominate. Color, shape, and size distinguish lesions. Exudates are bright, while microaneurysms (MAs) and hemorrhages (HEMs) are dark. This study presents a retinal lesion screening method for diabetic retinopathy. The data is saturated at low and high intensities; picture intensity values are adjusted to enhance contrast. This study presents a unique rhombus multilevel retinal image segmentation method. In the proposed study, preprocessing, segmentation algorithms, morphological operation,median filter and gradient are all designed as parts of an effective automated system. With 40 photos, the recommended method produced accuracy and specificity of 99.9% and 99.5%, respectively.
diabetic retinopathy, rhombus segmentation, median filter, microaneurysms, hemorrhages, exudates
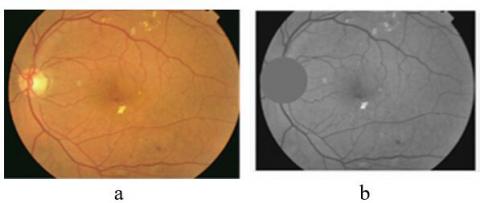
According to the International Diabetes Federation, 463 million people between the ages of 20 and 79 are diabetic [1]. The retinal fundus is examined to determine diabetic retinopathy (DR). DR grading schemes include the Early Treatment Diabetic Retinopathy Study (ETDRS). Diabetic retinopathy (DR) causes retinal abnormalities. Diabetes-related DR damages the eyes. A retinal blood vessel injury causes it. It is a major factor in blindness in 20- to 60-year-olds. Hemorrhages and microaneurysms are the initial signs of DR. [2]. The microaneurysms cause retinal blood vessels to get blocked and suffer damage. These microaneurysms might rupture and cause bleeding [3]. Microaneurysms and hemorrhages, which are prevalent in the later phases, are the predominant signs of DR in its early stages. Figure 1 (a) depicts an eye that is healthy, while Figure 1 (b) depicts a retinal image with lesions; by detecting DR early on, vision loss can be avoided. By analyzing the fundus picture, DR may be screened for and detected [3, 4].
Figure 1. A normal retinal picture and one with lesions
Devices that are also accessible for use in health care and are often utilized are employed in hospitals to monitor patient physiological data, drug administration records, and patients and physicians [5].
The segmentation process divides a picture into homogenous, connected regions. There are several methods for solving the segmentation problem, just as there are numerous ways to interpret a picture.One of the most important uses of picture segmentation in the field of image processing and computer vision is in the field of medicine and intelligent transportation. For academics to validate their methods, several benchmark datasets have been made available [6].
Additionally, typical image analysis techniques are employed to identify lesions and fundus characteristics, color grading, vascular segmentation, microaneurysm and hemorrhage identification, optic disk and macular localization, and the detection of hard exudates are only a few examples. [7]. There are several ways to identify HEs; one of them, with a SE of 92.8%, involves morphological reconstruction approaches. An alternative approach focuses on categorizing segmented regions as exudate or non-exudate patches, and it employs techniques like neural networks to get the best classification results. Naive Bayes and support vector machine classifiers were used in another method for feature selection and exudate categorization. Another method separated exudates from backgrounds by thresholding photos using a mixture model-based method. These methods have the disadvantage of occasionally missing weak exudates [8].
The goal of this study was to develop an automated algorithm for detecting hard exudates on retinal fundus images.
So that, computerized algorithms are enhanced for use in medical screening systems for detecting retinal lesions and rating risk in order to make appropriate treatment decisions for the patient. It will help physicians discover retinal ulcers earlier, where ophthalmologists spend a lot of time dealing with manual diagnosis and analysis. As a result, MLRS assists doctors in early detection and helps the patient avoid complete blindness.
For this project, Frangi filter-based filters are used for the first time [8]. After initial preprocessing, proposed filters were applied to each smaller subimage created from the input image's green channel. Features from the filter response were used to train a support vector machine classifier to identify lesions in a test image, the suggested technique attained areas under the ROC curve of 0.97 and 0.87 for microaneurysms and hemorrhages, respectively, for identifying red lesions. while Kharazmi et al. [9] provides a special method for identifying and dividing cutaneous veins in dermoscopy images. Clustering is done using k-means, the segmentation sensitivity and specificity are 90% and 86%, respectively. In addition, Sambaturu et al. [10], Exudates and hemorrhages are key features of the lesions that define diabetic retinopathy. to automatically identify the exudates and hemorrhages in a fundus picture using a region-based CNN technique. Zhou et al. [11], the automatic detection of exudates called superpixel multi-feature classification. A complete image is first divided up into a number of superpixels that are being considered as contenders. Then, 20 features in total, including 19 multi-channel intensity features and a brand-new contextual feature, are suggested for describing each applicant. To separate the genuine exudates from the fake candidates, a supervised multi-variable classification technique is also presented. Last but not least, a unique optic disc detection technique is created to boost classification accuracy even more. Guo et al. [12] This work introduces the Phansalkar binarization approach to deal with the issue of incorrect segmentation in blasted rock photos brought on by adhesion, stacking, and softening edges. Based on the solidity of the contours of the rock blocks, they created an adaptive watershed segmentation algorithm for photos of blasted rock, the segmentation result's area cumulative distribution curve is substantially consistent with the manual segmentation, and the segmentation accuracy was greater than 95.65% for both limestone and granite rock blocks. In this study [13], when applied directly to raw data pictures, it fixed the issue of the watershed algorithm's unfavorable over segmentation results. The final edge detection result reveals one closed boundary for each genuine location in the image, and the edge maps we obtained likewise show no broken lines across the whole image. while Guo et al. [14], It is proposed a top-k loss that accounts for both class- and loss-unbalance scenarios by putting greater attention on the hard-to-classify pixels. The area under the SE-PPV curve (AUC) increases by 10.6% when using the bin loss, a rapid form of the top-k loss, to increase a system's effectiveness. A critical stage in the automated diagnosis of eye disorders is fundus image segmentation (FIS). It is essential for the segmentation of minuscule arteries and lesions. This results in the introduction of a high-resolution hierarchical network (HHNet) that can simultaneously learn and store spatial information and semantically rich high-resolution representations [15]. Additionally, Wang et al. [16] suggest a method for atrial segmenting cardiac MRI pictures over the UU-NET network. First, utilizing residual theory, U-shaped upper and lower sampling modules are built, serving as the model's encoders and decoders. The model's capacity for information transmission is increased by connecting the modules to provide various pathways from input to output [17]. Deep convolutional neural networks (DCNN) and multi-feature joint representation have been shown to be a unique way to identify hard exudates (HE). They outline an enhanced mathematical morphological technique that precisely partitions HE candidates initially. Then, using ridge regression-based feature fusion, each candidate is defined by utilizing combined features based on deep features, including HCFs. A DCNN, a gray-level co-occurrence matrix (GLCM), a gray-level size zone matrix, geometric features, multi-space-based intensity features, and a DCNN are all used in this technique (GLSZM). To find the genuine HEs among the candidates, a random forest is used as the last step The DSC in the verification set is 96.7%, while the DSC in the online set is 96.7%, which is about 1% higher than the deconvolution neural network model. In the study [18], This work introduces SS- MAF, a novel hard exudates segmentation approach with an additional super-resolution job that adds useful detailed characteristics for micro lesion and boundary detection. On the E- Ophtha dataset, the technique achieves 3% greater dice and recall than state-of-the-art algorithms.
In this study, a brand-new method for rhombus segmentation is put forth. This technique is utilized for segmenting and dividing the picture into smaller images, and it allows for further rhombus segmentation. In order to prevent gab, additional levels were employed for segmentation in order to identify (HE), making this a new technique, as seen in the below Figure 2a. A rhombus (plural rhombi or rhombuses) is a quadrilateral in plane geometry where each of its four sides is the same length. Although the former name is occasionally used, particularly to designate a rhombus with a 60° angle (which some writers refer to as a "calisson" after the French sweet; see Polyiamond), and the latter term is occasionally used explicitly, the rhombus is usually referred to as a "diamond." Every single rhombus is a unique example of a parallelogram and a kite, and it is straightforward (it does not self-intersect). A right-angled rhombus is a square. the rhombus's sides having their diagonals each falling on an axis. A rhombus is a quadrilateral that is an equilateral parallelogram and has all of its opposing pairs of sides parallel. A rhombus's polygonal diagonals are parallel to one another, as shown in Eq. (1).
$p^2+q^2=4 a^2$ (1)
The opening angle and the diagonals are connected by Eq. (2).
$\begin{aligned} & p=2 a \cos \theta \\ & q=2 a \sin \theta\end{aligned}$ (2)
The rhombic lattice, often known as lattice, is one of the five 2D lattice forms. The 2D plane can be tiled by identical rhombuses in three distinct ways, including the rhombille tiling for the 60° rhombus. The bipyramid and the bicone as a surface of revolution are three-dimensional analogs of rhombuses. The left rhombus resembles a "pushed-over square" and has the orientation that we often use for a parallelogram. In order to imitate the diamond in a deck of cards, the rightmost rhombus has been turned. It is usually useful to think of this as the normal form of a rhombus, according to Figure 2b [19].
When MRLS is applied to a normal retinal image, it turns dark, but in an aberrant situation, just the lesion appears, as seen in result section.
Figure 2. (a) A partition image to rhombus, (b) Shape of a Rhombus
Morphological operations are very helpful in image processing, especially after segmentation. They can be used to choose picture parts that are important for describing area shapes, like the boundary, skeleton, and convex hull. Morphological techniques including filtering, thinning, filling, pruning, and others are used for both pre-processing and post-processing [20]. In image-processing applications, erosion and dilation are widely used in various combinations. Dilation and erosion work together to create openings and closures. The first phase usually involves breaking up narrow isthmuses and eliminating small protrusions from the picture to flatten its shape. Typically, closing causes long, thin gulfs and narrow fractures to fuse, small holes to be removed, and contour gaps to be filled in Eqs. (3) and (4), which express, respectively, the morphological opening and closing [21].
$A \cdot B=(A \ominus B) \oplus B$ (3)
$A \cdot B=(A \oplus B) \ominus B$ (4)
4.1 Image gradient
Edge detection uses the Sobel operator, a discrete differential operator that approximates the gradient of the image luminance function. A picture gradient, which is formed from the original image by typically convolving it with a filter like the Sobel filter, may be used here to extract information from photos. The outcome of the image following the gradient operation is depicted in Figure 3. Each pixel in the gradient image records the direction and change in intensity of the same spot in the original image. Image gradients in the x and y directions are calculated to provide the complete range of directions, similar to Eq. (5) [22].
$
\begin{aligned}
& \mathbf{G}_x=\left[\begin{array}{ccc}
-\mathbf{1} & \mathbf{0} & \mathbf{1} \\
-2 & \mathbf{0} & \mathbf{2} \\
-\mathbf{1} & \mathbf{0} & \mathbf{1}
\end{array}\right] \quad \mathbf{G}_y=\left[\begin{array}{rrr}
\mathbf{1} & \mathbf{2} & \mathbf{1} \\
\mathbf{0} & \mathbf{0} & \mathbf{0} \\
-\mathbf{1} & -2 & -\mathbf{1}
\end{array}\right] (5)\\
& \quad\quad\quad\text {Horizontal } \quad\quad\quad\quad\quad\quad\,\,\,\,\,\,\,\,\text {Vertical }
\end{aligned}$
The main gradient equation can be shown in Eq. (7), where $\boldsymbol{G}_{\boldsymbol{x}}$ and $\boldsymbol{G}_{\boldsymbol{y}}$ are images that resemble the original image in the x and y directions, respectively.
The gradient is calculated using discrete differencing, which involves applying a differencing block on the image to make an approximation to continuous gradient at each point. Gradient operators locate the edges of sites where rapid changes occurred. The two components of edge detection are direction and magnitude, which might be horizontal or vertical and provide the same result but in opposite directions. A horizontal orientation is used here since it may yield better results.
Figure 3. a: Input image b: Output of which Sobel filter
A nonlinear smoothing technique called median filtering replaces each pixel’s gray value with the point’s specified neighborhood, the average gray value across all pixels in the window. To order the pixels in the template, a sliding template with a certain structure is used. The median filtering method seeks to produce a data series that increases monotonically (or with decreasing structure). It is frequently employed because it may almost completely eliminate interference or noise with little effect on the original image. The neighborhood’s median value is used to replace the digital picture’s or sequence’s noisy value (mask). The noisy value is replaced with the group’s median value after the mask’s pixels are sorted by how dark they are. The typical filtering outcome is,
$g(x, y)$ = med {$f$($x-I, y-j$), I, j $\in W$} (6)
where, $f(x, y)$, $g(x, y)$ are the source picture and the output image, respectively; W is the two-dimensional mask; its size is $n \times n$ (where n is often odd), for example, $3 \times 3,5 \times 5$ and so on; it may also have a variety of shapes, including linear, square, circular, cross, and so on [23].
In this work, the median filter has a significant benefit over linear filters in that it may eliminate the effect of extremely large magnitudes of input noise when it tested with algorithm. (In contrast, linear filters are susceptible to this form of noise; that is, even a small fraction of aberrant noise values can substantially damage output). dimensional mask; its size $5 \times 5$, and disk shape it used.
When using this technique with many filters, it was discovered that the average filter produced more persuasive and clear results than the other filters.
The production of lesions in the retina is one of the key indications of DR that can be avoided with early screening. Some existing works for detecting HE (s) are described below. A unique method for automatically detecting DR from digital fundus images is proposed. Digital images are quite useful in identifying retinal lesions. Figure 4 displays the block diagram for the new automated system that has been proposed. The program uses retinal image exudates to suggest the planned RMS (Rhomus Multi Segmentation) with Median Filter and to predict the outcomes where HE (s) is discovered.
Lesions Exudates, as well as soft exudates, are among the most prevalent signs of DR in its early stages and are mostly to blame for vision loss in non-proliferative DR. Blood leaks cause exudates, which are distinguished by bright patches with distinct borders. Automatic identification of exudates is a challenging topic due to the frequent occurrence of uneven illumination and weak contrast in retinal fundus pictures. Given these difficult conditions, a four-step automated exudate detection strategy based on a novel RS segmentation algorithm is suggested.
Figure 4. Block diagram for the suggested technique notice bright
All of the photographs utilized in this work must have had a single lighting source since some images appeared darker and others lighter. Some areas of the image needed to be brighter than others in order to improve contrast, so they were multiplied by a specified ratio. It is crucial to minimize the brilliant optic disk's impact prior to exudate identification processes since it might resemble HE and be mistakenly found as an exudate. The center and radius of the optical disk have been established using the approach suggested by Sinthanayothin et al. [24]. To eradicate or remove OD, there are numerous things to do. In this study, a 9-radius octagon structuring element is used for morphological closure, which is followed by a nonlinear spatial filtering method based on nonlinear operations involving nearby pixels.
$V=\frac{1}{N-1} \sum_{i-1}^N\left|A_i-\mu\right|^2$ (7)
Figure 5. The preprocessing includes (a) CLAHE of the picture, (b) Morphological Closing, (c) Colfil, (e) Canny edge, (f) Mask for OD, and (g) Apply mask on retinal image
6.1 Rhombus Multilevel Segmentation (RMLS)
Similar to the majority of medical pictures, retinal images are too complicated to be separated using a single threshold. In the first scheme, the picture is split into rhombus-shaped areas; this initial level of segmentation covers most region images with the exception of HEs, which have high pixels’ values. The picture is then subjected to the second, third, fourth, and fifth levels of rhombus segmentation. The novel rhombus algorithm is formed by matrix ,this rhombus has diagonal (p) and Center (C), from these component can determined pixels inside rhombus for example, image subdivide to matrixes’dimation =15, then begin Summation pixels inside rhombus as rows after rows begging by center as shown in Figure 6 and Eq. (8).
$\sum_{i=D_n}^w \sum_{j=D_n}^L G$ (8)
where, $D_n=\operatorname{round}\left(\frac{D}{2}\right)$ is the new dimension, (w, L) is the width and length of $x x$ (image), $G$ for D=3 can be depicted as Eq. (9).
$\begin{aligned} G=x x(i-1, j) & +\operatorname{sum}(x x(i,(j-1): j+1))+x x(i+1, j)\end{aligned}$ (9)
Figure 6. (a) Yellow color D=3 and green color is D=15 (b) Sum pixels inside rhombus D=3
And so on for D = 3, 9, 11, and 15, which represent the multilevel Rhombus Segmentation algorithm.
Also, the thresholds change with each segmentation level. If the total of the pixels is less than the threshold, the rhombus is assigned a value of zero. If it is more than, the value of the pixels stays the same; otherwise, they become 0 and the color is black. In "10", this is evident. Every level of segmentation has a distinct length (L), while the second, third, fourth, and fifth levels have decreasing lengths as follows: L 1>L 2>L 3>L 4>L 5, as seen in Figure 7.
$f= \begin{cases}G>T h & \quad G \\ G<T h & \quad 0\end{cases}$ (10)
Figure 7. Multilevel rhombus segmentation
Figure 8. MLRS levels (a) Original image, (b, c) Green channel (d) First (e) Second (f) Third (g) Four and (h) Five level
Since hemorrhages and HES have similar shapes, the rhombus segmentation was chosen.This algorithm is known as MRLS because it uses three levels of segmentation and has the significant advantage of automatically removing gaps between the Rhombus. The five levels of the Rhomus Multilevel Algorithm are depicted in Figure 8 shows the outcomes for retinal images.
The gradient picture output was then subjected to a morphological opening operator with a disk-shaped structuring element and a fixed radius of 1 pixel, followed by a median filter to remove noise from the image. The segmentation's findings are shown in Figure 9, which depicts the impact of the median filter.
Figure 9. Final results (a) Gradient (b) Opening (c) Median filter
Various datasets provide images that used to train then test the new proposed auto detection method of HE. mages for retina from DIARETDB0 dataset. The field of view of capturing these images is 40 with a resolution of 1500×1152 pixels are used so that 110 of them include lesions of various kinds [25]. Another batch of 89 photos, this time from the DIARETDB1 dataset [26], is used for training and testing. Of these, 84 have several DR signals, while the remaining 5 have a single normal signal. With a resolution of 1500×1152 pixels, the field of vision for taking these pictures is 50° degrees. MESSIDOR dataset is another type of pathological retinal images database that used here in this thesis. The Mines Paris Tech Center of Mathematical Morphology kindly provides these images with their HE segmentation ground truth. The field of view of capturing these images is 50° with a resolution of 640×480 pixels [27].
"The DIARETDB1 and MESSIDOR datasets were used because they contain high-quality retinal images with pixel-level ground truth annotations for lesion segmentation, enabling quantitative evaluation of detection accuracy."
We have tested and validated our method using both normal and aberrant retinal pictures in experiments. 40 images were utilized as follows, taken from various databases:
They captured 10 photos of hard exudates using a 50-degree field of view, the result of proposed can be seen in Figure 10.
Figure 10. Left image results (a) RGB image (b) Green image with eliminate OD (c)-(g) First, second, third, four and five segmentation (h) Median filter
40 photos from various databases, a comparison with clinician-labeled images was made to assess the performance of the suggested technique. By contrasting the findings with data that a clinician manually labeled, the performance of the suggested strategy was quantitatively evaluated. In the evaluation, true positive (TP), false positive (FP), false negative (FN), and true negative (TN) pixels are taken into account. The following performance measures are produced for each individual image using these quantities:
Specificity $=\frac{T N_S}{T N_S+F P_S}$ (11)
Accuracy $=\frac{T P_S+T N_S}{T P_S+F P_S+T N_S+F N_S}$ (12)
When the MLRS is modified, results like Spe. and Acc. are obtained. The method proposed here indicates an amelioration in the accuracy measures and specificity with high performance method as seen in Figure 11. After a doctor's results were compared to those of the suggested approach, the latter was found to be able to handle different image quality variations well. Figure 12 shows different examples of the proposed method for HE detection using the MLRS technique, indicating the input image, the results of the proposed method, and the ground truth of the corresponding image. The ground truth is presented here for visual comparison and evaluation of the proposed method.
Figure 11. Performance measures for left and right images
Figure 12. A visual comparison between (a) Fundus images, (b) The MLRS approach that corresponds to them, and (c) The ground truth results that a clinician created using hand-labeled photographs
Limitations observed in this work firstly, When the optic disc is oriented to the right, the brightness contrast of the image differs from that of the left. Because this issue influences the wound detection procedure, you must optimize the right image differently than the left optimization method before beginning the detection process. Secondly, it needs to eliminate blood vessels before being detected.
Lesion detection is proposed as a straightforward yet efficient integrated strategy that combines several pre-processing methods with MLRS and median filter, followed by post-processing processes. When these methods are used sequentially and intelligently, they provide a very effective and quick method to identify various lesions regardless of their texture, shape, size, etc.
The suggested approach has produced great results, making MRS a superior system to most related work. Here, the MRS procedure, which shortens the processing time and expedites picture analysis, there is no need for blood vessel extraction and then elimination because the MRLS operation can do this task, which makes the time to get the result very small as compared to previous works. The algorithm was performed in MATLAB 2016. 99.9 percent specificity and 99.5 percent accuracy were achieved. These are more resistant to changes in image quality than the current techniques. Finally, the algorithm may be adaptable to more retinal imaging problems and is simple to expand and enhance for improved performance. It has been demonstrated that the algorithm detected abnormalities with higher accuracy and honesty. The strategies used in the suggested system could help to improve diagnostic accuracy while also reducing ophthalmologists' workload by reducing analysis time.
Suggestions for Works for the Future
I would like to thank prof. Dr. Osama Qasim supporting my work.
|
D |
dimension |
|
Dn |
new dimension |
|
G |
Sum of total pixrls |
|
TH |
threshold |
|
(x,y) |
source picture |
|
g(x,y) |
output image |
|
p |
Rhombus diagonal |
[1] Egunsola, O., Dowsett, L.E., Diaz, R., Brent, M.H., Rac, V., Clement, F.M. (2021). Diabetic retinopathy screening: A systematic review of qualitative literature. Canadian Journal of Diabetes, 45(8): 725-733. https://doi.org/10.1016/j.jcjd.2021.01.014
[2] Lakshminarayanan, V., Kheradfallah, H., Sarkar, A., Jothi Balaji, J. (2021). Automated detection and diagnosis of diabetic retinopathy: A comprehensive survey. Journal of Imaging, 7(9): 165. https://doi.org/10.3390/jimaging7090165
[3] Aleena, S.L., Prajith, C.A. (2020). Retinal lesions detection for screening of diabetic retinopathy. In 2020 11th International Conference on Computing, Communication and Networking Technologies (ICCCNT), Kharagpur, India, pp. 1-6. https://doi.org/10.1109/ICCCNT49239.2020.9225617
[4] Pociask, E., Malinowski, K.P., Ślęzak, M., Jaworek-Korjakowska, J., Wojakowski, W., Roleder, T. (2018). Fully automated lumen segmentation method for intracoronary optical coherence tomography. Journal of Healthcare Engineering, 2018: 1414076. https://doi.org/10.1155/2018/1414076
[5] Talib, S.H., Abdul-Rahaim, L.A., Alrubaie, A.J., Raseed, I.M. (2023). Design smart hospital system based on cloud computing. Indonesian Journal of Electrical Engineering and Computer Science, 29(2): 797-807. https://doi.org/10.11591/ijeecs.v29.i2.pp797-807
[6] Liu, X., Deng, Z., Yang, Y. (2019). Recent progress in semantic image segmentation. Artificial Intelligence Review, 52: 1089-1106. https://doi.org/10.1007/s10462-018-9641-3
[7] Alrubaie, H.A., Talib, S.H., Mohammed, J.H., Zabibah, R. (2022) Optical properties of ZnO nanorods and ZnO/CdZns thin films. Chalcogenide Letters, 19(7): 457-462. https://doi.org/10.15251/CL.2022.197.457
[8] Srivastava, R., Wong, D.W., Duan, L., Liu, J., Wong, T.Y. (2015). Red lesion detection in retinal fundus images using Frangi-based filters. In 2015 37th Annual International Conference of the IEEE Engineering in Medicine and Biology Society (EMBC), Milan, Italy, pp. 5663-5666. https://doi.org/10.1109/EMBC.2015.7319677
[9] Kharazmi, P., AlJasser, M.I., Lui, H., Wang, Z.J., Lee, T.K. (2016). Automated detection and segmentation of vascular structures of skin lesions seen in Dermoscopy, with an application to basal cell carcinoma classification. IEEE Journal of Biomedical and Health Informatics, 21(6): 1675-1684. https://doi.org/10.1109/JBHI.2016.2637342
[10] Sambaturu, B., Srinivasan, B., Prabhu, S.M., Rajamani, K.T., Palanisamy, T., Haritz, G., Singh, D. (2017). A novel deep learning based method for retinal lesion detection. In 2017 International Conference on Advances in Computing, Communications and Informatics (ICACCI), Udupi, India, pp. 33-37. https://doi.org/10.1109/ICACCI.2017.8125812
[11] Zhou, W., Wu, C., Yi, Y., Du, W. (2017). Automatic detection of exudates in digital color fundus images using superpixel multi-feature classification. IEEE Access, 5: 17077-17088. https://doi.org/10.1109/ACCESS.2017.2740239
[12] Guo, Q., Wang, Y., Yang, S., Xiang, Z. (2022). A method of blasted rock image segmentation based on improved watershed algorithm. Scientific Reports, 12(1): 7143. https://doi.org/10.1038/s41598-022-11351-0
[13] Salman, N. (2006). Image segmentation based on watershed and edge detection techniques. The International Arab Journal of Information Technology, 3(2): 104-110.
[14] Guo, S., Wang, K., Kang, H., Liu, T., Gao, Y., Li, T. (2020). Bin loss for hard exudates segmentation in fundus images. Neurocomputing, 392: 314-324. https://doi.org/10.1016/j.neucom.2018.10.103
[15] Guo, S. (2021). Fundus image segmentation via hierarchical feature learning. Computers in Biology and Medicine, 138: 104928. https://doi.org/10.1016/j.compbiomed.2021.104928
[16] Wang, H., Yuan, G., Zhao, X., Peng, L., Wang, Z., He, Y., Qu, C., Peng, Z. (2020). Hard exudate detection based on deep model learned information and multi-feature joint representation for diabetic retinopathy screening. Computer Methods and Programs in Biomedicine, 191: 105398. https://doi.org/10.1016/j.cmpb.2020.105398
[17] Wang, Y., Li, S.T., Huang, J., Lai, Q.Q., Guo, Y.F., Huang, Y.H., Li, Y.Z. (2022). Cardiac MRI segmentation of the atria based on UU-NET. Frontiers in Cardiovascular Medicine, 9: 1011916. https://doi.org/10.3389/fcvm.2022.1011916
[18] Zhang, J., Chen, X., Qiu, Z., Yang, M., Hu, Y., Liu, J. (2022). Hard exudate segmentation supplemented by super-resolution with Multi-scale Attention Fusion Module. In 2022 IEEE International Conference on Bioinformatics and Biomedicine (BIBM), Las Vegas, NV, USA, pp. 1375-1380. https://doi.org/10.1109/BIBM55620.2022.9995545
[19] Brown, P., Evans, M., Hunt, D., McIntosh, J., Pender, B., Ramagge, J. (2011). Rhombuses, kites and trapezia. The University of Melbourne on behalf of the International Centre of Excellence for Education in Mathematics (ICE EM). http://www.amsi.org.au/teacher_modules/pdfs/Rhombuses_Kites_and_Trapezia.pdf.
[20] Nagpal, D., Panda, S.N., Malarvel, M., Pattanaik, P.A., Khan, M.Z. (2022). A review of diabetic retinopathy: Datasets, approaches, evaluation metrics and future trends. Journal of King Saud University-Computer and Information Sciences, 34(9): 7138-7152. https://doi.org/10.1016/j.jksuci.2021.06.006
[21] Al-Thahab, O.Q.J., Talib, S.H., Jaafar, H.F. (2018). Automated detection of retinal hard exudates using triple circular segmentation. Journal of Engineering and Applied Sciences, 13(14): 11055-11063.
[22] Hafez, M., Azeem, S.A. (2002). Using adaptive edge technique for detecting microaneurysms in fluorescein angiograms of the ocular fundus. In 11th IEEE Mediterranean Electrotechnical Conference (IEEE Cat. No. 02CH37379), Cairo, Egypt, pp. 479-483. https://doi.org/10.1109/MELECON.2002.1014639
[23] Zhu, Y.L., Huang, C. (2012). An improved median filtering algorithm for image noise reduction. International Conference on Solid State Devices and Materials Science. https://doi.org/10.1016/J.PHPRO.2012.03.133
[24] Sinthanayothin, C., Boyce, J.F., Cook, H.L., Williamson, T.H. (1999). Automated localisation of the optic disc, fovea, and retinal blood vessels from digital colour fundus images. British Journal of Ophthalmology, 83(8): 902-910. http://dx.doi.org/10.1136/bjo.83.8.902
[25] Kauppi, T., Kalesnykiene, V., Kamarainen, J., Lensu, L., Sorri, I., Raninen, A., Voutilainen, R., Uusitalo, H., Kalviainen, H., Pietila, J. (2007). The diaretdb1 diabetic retinopathy database and evaluation protocol. Technical report, Lappeenranta University of Technology and University of Kuopio, Finland.
[26] Kauppi, T., Kalesnykiene, V., Kamarainen, J., Lensu, L., Sorri, I., Raninen, A., Voutilainen, R., Uusitalo, H., Kalviainen, H., Pietila, J. (2006). DIARETDB0: Evaluation database and morphology for diabetic retinopathy algorithm. Technical report, Lappeenranta University of Technology, Finland. https://www.siue.edu/~sumbaug/RetinalProjectPapers/Diabetic%20Retinopathy%20Image%20Database%20Information.pdf.
[27] Walter, T., Klein, J.C., Massin, P., Erginay, A. (2002). A contribution of image processing to the diagnosis of diabetic retinopathy-detection of exudates in color fundus images of the human retina. IEEE Transactions on Medical Imaging, 21(10): 1236-1243. https://doi.org/10.1109/TMI.2002.806290