Lazhar Khriji
© 2022 IIETA. This article is published by IIETA and is licensed under the CC BY 4.0 license (http://creativecommons.org/licenses/by/4.0/).
OPEN ACCESS
Atrial Fibrillation (AF) is the most common pathologic of sinus tachycardia, which is the result of an increased rate of depolarization in the sinoatrial node (the sinoatrial node discharges electrical impulses at a higher frequency than normal). In this light, its detection at an early stage is essential for treatments prescription. In this context, we propose an artificial neural network (ANN) architecture using ECG patterns to perform the AF detection. ECG signals are classified into three classes (Normal Sinus Rhythm, abnormal signal with AF, and noisy ECG signals). The proposed technique has been implemented on two types of databases (MIT-BIH database and processed MIT-BIH) using two different experiments. Data segments of 10 seconds length have been used. The achieved experimental results proved that the proposed ANN technique has excellent accuracy results without the need for feature extraction to reduce information parameters. Our work has surpassed the state of the art in terms of specificity, precision, and accuracy. Therefore, we enable clinicians to detect automatically the patients with AF disease.
atrial fibrillation, ANN, ECG-classification
Nowadays, AF is the major concern with irregular heart rhythms, especially for the aggravating trend of the aging population. The number of AF patients keeps increasing every year and is estimated to affect more than 4% of the population over the age of 60, causing a dramatic increase in the AF-related cost [1, 2]. The heart is a regulated pump for efficient body operations. The sinoatrial node discharges electrical impulses that start from the sinoatrial node [3] and move from atria to ventricles, which can cause regular rhythmic contractions of the chambers. AF is triggered when the discharged electrical impulses are higher than the normal frequency. Furthermore, AF can be divided into paroxysmal AF, persistent AF, Long-standing persistent AF, and permanent AF. The degree of severity ranges from tremors, tachycardia, fatigue, weakness until stroke and heart failure. The records of Electrocardiogram (ECG) signals during the arrhythmia represent the fundamental tool for AF analysis. As we entered the digital age, powerful processors keep improving continuously, which allow the real time implementation of complex algorithms such as neural networks and Deep Learning (DL). This latter modernized the medical field as it presented state-of-the-art results in different fields such as medical imaging, robotics, computer vision, etc. [4-7]. In view of that, ECG abnormality detection and classification, like many other applications, has dramatically improved performance. In this context, we present a new contribution in this paper characterized by the design and experimental validation of a new ANN algorithm to detect automatically AF from the ECG signals. It shows to be fast thanks to the implemented huge architecture of the hidden layers, where we choose a suitable number of hidden layers (HL) for our dataset to have the best accuracy. Accordingly, each HL decides the more significant information from the inputs crossing it. In fact, the network becomes faster in classifying the MIT dataset signal into normal and AF ECG signals.
This paper is structured, as follows: Section 2 summarizes the state of the art. Section 3 presents the proposed model architecture and experiments. Section 4 provides a thorough discussion of the experimental results and metrics. Lastly, a conclusion is drawn out in Section 5.
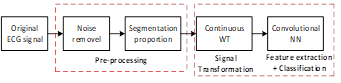
Arrhythmia detection system is one of the most common medical applications that are based on the use of ECG. Kiranyaz et al. [8] suggested an ECG beat classification system. It is based on 1D-CNN for real-time patient-specific ECG classification. As CNNs are designed for extracting features from low to high level patterns, this model involves a feature extraction block followed by a classification block. These blocks are fused into a single learning block targeting the speed-up of the classification. ECG analysis represents a fundamental task in clinical ECG workflow [9]. Numerous deep learning techniques have been developed for ECG classification but for different goals [10-14]. For this latter, automated AF detection has a large percentage of concerns from the research community [10, 15-20]. New methods are presented in Refs. [21-23], which present new DL approaches used to detect AF in real time. For example, Andersen et al. [21] used an end-to-end NN cleverly combining CNN with RNN (i.e. Recurrent Neural Network) aiming to collect from input signals their characteristics high level. Eighty-five classes, taken from three different datasets, were used to test this hybrid structure. A particular performance of high processing speed has been demonstrated. Its robustness was tested on the three datasets and reached 98.96% and 86.4% specificity and sensitivity, respectively. Many researchers using different approaches and scenarios have tackled the task of arrhythmia classification based on ECG signals. Rajpurkar et al. [24] have used a DNN algorithm for ECG classification using a raw data of 30 seconds of length. They could classify 14 different classes including AF. AF presents very complex input data for the NN. DNN have shown an excellent performance in learning non-linear input data. As DNN is able to learn complex patterns presenting AF in ECG data, it can widely help scientists on finding the significant parts of ECG data to focus on them during the training phase. Actually, using a CNN, the accuracy reaches 95% [21]. This technique has shown its ability to detect AF in a shorter processing time compared to state-of-the-art techniques. He et al. [17] have proposed an improved architecture. In fact, machine-learning techniques have been used for automatic AF detection. An essential step when starting any classification system is the pre-processing step. It includes in cascade a wavelet transform (WT) and segmentation algorithm, as shown in Figure 1. A stationary WT was introduced to increase the robustness of the analysis by limiting repeatability issues. Finally, a feature extraction step must be performed with the determination of the peak-to-average power ratio and the log-energy entropy. In addition, these parameters were used by SVM to detect the AF. They achieved a 99.5% of ROC and 97.0% and 97.1% for sensitivity and specificity, respectively. In Ref. [16], the use of CNN comes after a pre-processing flow in which signals were filtered by Haar wavelet then segmented into segments of 30 seconds long. In the second stage, the CNN is applied with 11150 parameters passing through its three building blocks: convolution, pooling, and fully connected layers. They used 200 epochs in the training process, and they obtained a prediction accuracy of 98.7%. In the study [17], after segmenting the MIT-BIH dataset, they applied WT to represent the ECG dataset in time and frequency domains. Next, they proposed a CNN, which includes nine layers to perform feature extraction (four convolutional, three dropout and two max-pooling layers), two fully-connected layers to map the extracted features to the final output, and one flattened layer. Finally, the CNN parameters were adaptively optimized using the Gradient Descent (GD) algorithm. In this way, the results of AF detection (in terms of accuracy) have been improved. Two NN architectures have been used such as RNN and CNN in which the area under the receiver operating characteristic curves of the 2 DL classifiers was 0.998% [10]. Ma et al. [20] proposed an improved NN-encoder technique for AF detection. It plays a remarkable role in learning the high level of ECG features. Thanks to the Stack Sparse automatic encoder, they could achieve 98.3% accuracy. Chetan et al. [25] have suggested a low computational cost application to detect AF episodes in ECG signals using Artificial NN (ANN) in a robust way. The model was trained and tested using the MIT-BIH arrhythmia dataset [26]. The system achieved a detection accuracy coming up to 98.3%. It is known that early detection of AF diseases is very helpful for patients to avoid the chances of heart stroke. In this context, Ghosh et al. [27] proposed a novel method for AF pathology detection using the multi-rate cosine filter bank and DL, known as the Hierarchical Extreme Learning Machine (H-ELM). Even though the system achieved a very high detection rate, its use in the real-time application remains in question. Hsieh et al. [28] recommended an AF detection method based on an end-to-end 1D- CNN in order to obtain higher detection accuracy as well as minimize the network complexity. This method achieved an average F1 score of 78.2%. Warrick et al. introduced a new approach, based on a combination of a CNN and long short-term memory (LSTM) unit for ECG recordings classification [29]. They obtained an encouraging F-measure result of 0.83. Kumar et al. [11] have employed a generalized signal pre-processing technique using a multi-layer perceptron network (MLP). The average accuracy of 98.72% has been achieved on the MIT database. Results show that both the combined VMDE and VMSE features, and the radial basis function kernel-based multi-class SVM classifier are suitable to detect Arrhythmia ECG signals with an average accuracy value of 95.60% [30]. In the research [12], the coupling between the collected characteristics and the DBN classifier was able to achieve an AF classification rate of 98.27%, 97.77% and 98.67%, for accuracy, sensitivity and specificity, respectively. The system has shown its readiness for Class AF detection from huge ECG databases, such as major hospitals.
Figure 1. Synoptic flow of the proposed method for AF detection (WT: Wavelet Transform, NN: Neural Networks)
3.1 Dataset
It is available free from PhysioNet [26]. Two types of datasets are used in this work; the first presents a matrix of the MIT-BIH dataset with 202 records, each record consists of 3600 samples, presenting each input 1D signal sized of [3600*1]. However, the second dataset shows pre-processed MIT-BIH using segments of 10s for each record, and then an FFT is implemented having 404 spectrums. From each spectrum, we extract 14 parameters to build a 2D array of size [14x404], which represents the reduced information of the processed MIT-BIH Dataset.
Table 1. MIT-BIH and processed MIT-BIH dataset
|
|
Records |
Samples |
Matrix-Size |
Annotations |
|
Experiment 1 |
100,101,105,109,112,113,114,115,116,117 |
100 |
3600*1 |
NSR |
|
201,202,202,210,219 |
42 |
3600*1 |
AFIB |
|
|
205,223,207 |
60 |
3600*1 |
Noisy-ECG |
|
|
Experiment 2 |
100,101,105,109,112,113,114,115,116,117 |
132 |
404*1 |
AFIB |
|
201,202,202,210,219 |
138 |
404*1 |
NSR |
|
|
205,223,207 |
134 |
404*1 |
Noisy-ECG |
3.1.1 Experiment 1
The first experiment is to train an MIT-BIH dataset without neither feature extraction nor pre-processing stage (Figure 2). The ANN algorithm has the ability to extract all the available weights from trained ECG signals and save them for the prediction process. Each record is consisted of 3600 samples, with a sampling frequency of 1/360s.
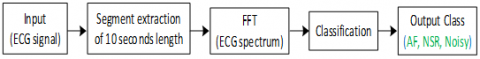
Figure 2. Synoptic flow of the proposed ANN approach for AF detection (experiment 1)
3.1.2 Experiment 2
Compared to experiment 1, experiment 2 uses the double number of samples (Figure 3) where we have used segments of 10 seconds of length. The constructed 2D data array is [14x404] in size, where 404 and 14 are the number of samples and the extracted parameters, respectively.
Figure 3. Synoptic flow of the proposed ANN approach for AF detection (experiment 2)
3.2 Pre-processing step
The pre-processing step is necessary for feature extraction of noise-free ECG signals. Then a segmentation step is performed on ECG signals of 10s segment's length with sampling period Ts = 360 samples/s. Fast Fourier Transform is applied next to extract the magnitude spectrum of each type of ECG signal. As for feature extraction, we used to extract 14 parameters such as the min, max, mean, standard deviation, median, mode, and range values for the sample's coordinates (Xp, Yp) of each segment of length 10s. Examples of extracted parameters are shown in Table 2.
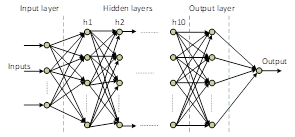
3.3 Proposed ANN architecture for both MIT-BIH and processed MIT-BIH dataset
ANN is a data processing model that is inspired by the brain. Its design is based on the application through a learning process. The Learning includes adjustments to the synaptic links that exist between the neurons. The model is specified by the interconnections, the activation functions and the learning rules. As for our proposed ANN model (see Figure 4), the input layer contains 23 records of ECG signals; each record consists of 3600 samples. The input dataset is 23 samples of vectors, constituting a matrix [3600 x 23] of ECG data. Next, we apply an activation function of sigmoidal form. A number of parameters representing the ECG feature map are created. They move through 10 hidden layers of 10 neurons each (100 parameters to set). The activation function is sigmoid as in (1). Then a Soft-max, as in (2), is applied to classify the signals into two classes, the first presents an AF signal (i.e. ECG signals with atrial fibrillation) but the second presents the signal SNR (i.e. ECG signals with normal sinus rhythm).
$y=\frac{1}{1+e^{-x}}$ (1)
$\operatorname{Soft} \max \left(x_{i}\right)=\frac{e^{x_{i}}}{\sum_{j} e^{x_{j}}}$ (2)
Table 2. Sub-example of extracted parameters from processed AF and NSR-MIT-BIH signals
|
|
Extracted parameters from processed AF MIT-BIH signals |
Extracted parameters from processed NSR-MIT-BIH signals |
||
|
Training Parameters |
Xp |
Yp |
Xp |
Yp |
|
min |
-180 |
0.0002909 |
-180 |
0.0001485 |
|
max |
179.9 |
990.5 |
179.9 |
980.1 |
|
mean |
-0.05 |
0.6145 |
-0.05 |
0.5538 |
|
median |
-0.05 |
0.02877 |
-0.05 |
0.02687 |
|
mode |
-180 |
0.0002909 |
-180 |
0.0001485 |
|
Standard deviation |
103.9 |
16.53 |
103.9 |
16.36 |
|
Range |
359.9 |
990.5 |
359.9 |
980.1 |
3.4 Training data parameters
Figure 4. Synoptic flow of the proposed ANN architecture
Table 3. Training data parameters
|
Training Parameters |
Iterations |
Activation function |
Classifier function |
Hidden Layers |
Training samples |
Validation samples |
Test images |
Batch |
|
Experiment 1 |
1000 |
Sigmoid |
Soft max function |
2 HL, 10 HL and 20 HL |
142 |
30 |
30 |
3600 |
|
Experiment 2 |
1000 |
Sigmoid |
Soft max function |
2, 10 and 20 HL |
282 |
61 |
61 |
404 |
Training parameters are the key players to obtain classifications of high accuracy values. For this purpose, as the number of parameters is higher as the accuracy, the sensitivity and the specificity results are going to yield the best values. In fact, in our experimental setup, we used 10 hidden layers with 10 neurons for each layer. We obtain 100 parameters to build our feature map extracted from the ECG signal under consideration. Then, as the number of iterations increases as the classification's result is tuned better to the higher side. Table 3 shows the used parameters for the ECG classification process including the number of iterations, which is set at 1000, to get the best accuracy. The more the dataset is trained (n times) the more results are enhanced. The selected number of HL started with 2 layers (low) then increased to 10 (medium) and finally to 20 layers (relatively large). By reducing the number of HL we reduce the number of parameters, and therefore we speed up the detection process. Indeed, the hidden layers filter some important patterns from inputs, carrying them to the next layer, making the network faster. For the used ECG dataset (see Table 1), we used 70% for training, 15% for validation, and 15% for testing. To avoid the network overfitting effect on the training data, the training was stopped when the error in the validation data reached its lowest value, or the training reached the maximum epoch, whichever comes first. This technique is known by the early stopping method.
To investigate the effectiveness of the proposed ANN in classifying patient ECG data, we used standard methods such as confusion matrix, histogram error, ROC curve and cross-entropy.
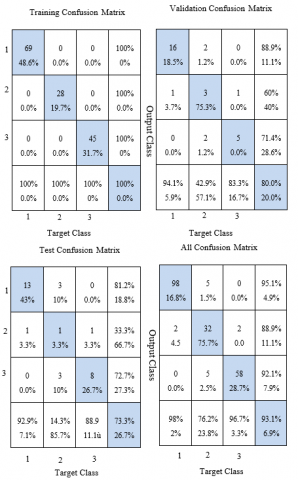
4.1 Confusion matrix (CM)
It is used to measure the performance of classification algorithms by assessing their accuracy for training, validation, and test datasets. The target class represents the desired output. It is an NxN matrix (N represents the number of different classes). It is connected with a classifier indicating the expected and actual classification. Using the CM, the results are divided into four classes; (i) TP (true positive), (ii) TN (true negative), (iii) FP (false positive), and (iv) FN (false negative). Consequently, the last row and the last column of the CM show the FP and the FN results, respectively. It shows a prediction result summary of a classification problem. It responds to the problem of determining the class of each signal. The confusion matrix provides a clear picture on the classifier errors and their types. Classification accuracy alone can lead to confusion when the number of observations in each class is insufficient or the number of classes in the dataset is greater than 2. The results of the CM give a better indication of what a classification model becomes correct and what kind of errors it produces. Additionally, three standard statistical measures were used to quantitatively assess classifier performance: Sensitivity (Se, the total number of model positive hits), Specificity (Sp, the number of negative hits the model returned), the accuracy (ACC, the number of correct predictions made by the model for all types of predictions), which are given by (3) - (5), respectively.
$S e=\frac{T P}{T P+F N}$ (3)
$S p=\frac{T N}{T N+F p}$ (4)
$A c c=\frac{T N+T P}{T N+T P+F N+F P}$ (5)
Figure 5(a) shows the prediction results of experiment 1 with 100%, 80%, and 73.3% accuracy for training, validation, and testing, respectively. The classification accuracy results are acceptable. They partly prove the robustness of the proposed ANN architecture. In the learning phase, the signals are correctly classified with 0% classification error. In the validation phase, the blue background cells in the CM represent the true positive classified ECG signals, however, the white background cells represent the misclassified signals. The first class presents SNR ECG signals, the second class presents AF classified ECG signals and the third class represents noisy signals. We used 142 recordings in the training process, where 69 recordings are classified as SNR signals, 28 recordings are classified as AF signals, and 45 recordings are classified as noisy ECG signals. In experiment 1, 30 records were used for validation, of which 24 records are well classified, reaching an accuracy value of 80%. As a result, the test phase also reached a value of 73.3% where 22 records are indeed assigned to the correct class and 8 records are misclassified (3 records for the first class, 2 records for the second class and 3 records for the third class). Similarly, Figure 5(b) shows the obtained results, which are representative of the precision obtained from the classification of the ECG signal into the three classes. The approach proposed in this experiment is to use an identical number of samples in the 3 classes, aiming to achieve better efficiency and greater accuracy. As shown in the CM, the blue cells represent the true classified signals. The accuracy score obtained for the training, validation, and testing process is 92.6%, 88.5%, and 92.1%, respectively. These results exhibit high agreement, explained by the way the dataset is distributed into three classes, where each class contains all the difficult tasks. Additionally, the CM in experiment 2 shows some misclassified signals, where only 32 ECG recordings are misclassified divided into 18 AF signals and 14 SNR signals. However, for noisy signals, they are all classified the same as the ground truth would be. These results are achieved by our proposed architecture of the following specifications: (i) 10 hidden layers, (ii) 10 neurons for each layer with a sigmoid activation function, (iii) and finally Softmax classifier for system output. However, using few hidden layers (two), the classification accuracy is 82.6% while it reaches 87% using a larger number of layers (about twenty). Therefore, choosing a precise number of hidden layers to obtain a precise number of parameters shows its interest in the ECG classification process.
(a)
(b)
Figure 5. Confusion matrix results, (a) for experiment 1, and (b) for experiment 2
4.2 Best receiver operating curve in test-process (ROC)
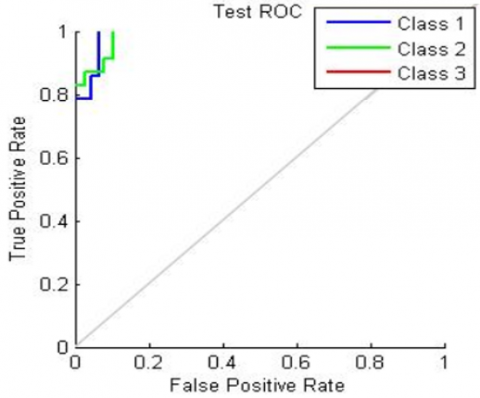
ROC is often used as a graphical tool to measure how well a model fits. In our case, it demonstrates the ability of a test to discriminate between classes. In other words, the closer the curve is to the ideal value of the upper left corner, the better the fit of the model. Figure 6 represents the best ROC in the test process of experiment 2. The blue color represents the first class (AF), the green color represents the second class (NSR signals), and the red color represents the third class (signals noisy). ROC plays an important role in representing TP versus FP rates in the medical field, especially for classification purposes. In fact, in our proposed ANN architecture, we achieved an excellent classification rate reported by the sketches in Figure 6. The AF class (in blue) reaches a true positive (classified AF signals) with a value of 0.81. Regarding the second class, the true positive NSR signals reached a value of 0.95 while the noisy signals reached a ROC value of 1. To conclude, all the ROCs obtained in the test process are close to 1, which proves the agreement of the real classified signals against ground truth.
Figure 6. Best ROC in testing phase: Experiment 2
4.3 Cross entropy results
Table 4 shows the cross-entropy and resulting errors throughout the process of training, validation, and testing the neural network. Certainly, it is essential to have low cross-entropy values to obtain decent results classification. As presented in Table 4, the cross-entropy value is low and approximately, close to zero, which proves the efficiency of our proposed ANN technique. Therefore, the error (in %) indicates the percentage of misclassified data. Values of 0 and 100 indicate no classification error and maximum classification error, respectively.
Table 4. Cross-entropy results
|
|
Experiment 1 |
Experiment 2 |
||||
|
Training |
Validation |
Test |
Training |
Validation |
Test |
|
|
Number of Samples |
142 |
30 |
30 |
282 |
61 |
61 |
|
Cross Entropy |
5.91e-1 |
1.94e0 |
1.95e0 |
1.12 e-0 |
2.93 e-0 |
2.87 e-0 |
|
Error |
0% |
20% |
26.7% |
7.44% |
11.47% |
6.55% |
4.4 Kappa-index and balanced accuracy results
The Kappa index is defined as the proportional reduction of the error obtained by a classification compared to the error obtained by a completely random classification. It indicates the percentage of true classes classified as non-hazardous.
$Kappa Coefficient=\frac{\left.(T S * T C S)-\sum(\text { Column Total } * \text { Row Total })\right)}{T S^{n}-\sum(\text { Column Total } * \text { Row Total })} * 100$ (6)
The kappa coefficient results obtained with 77.4% for experiment 1 and 88.11% for experiment 2 (see Table 5) demonstrate perfect agreement. Experiment 2 shows a value greater than 80%, which presents a perfect agreement between the real classified samples and the ground truth. This phenomenon of agreement is explained by the fact of the balanced accuracy. It is a metric that one can use to assess the quality of a binary classifier. It is useful, in particular; when the classes are unbalanced, i.e. one of the two classes appears much more often than the other. This usually occurs in many contexts such as the detection of abnormalities and the presence of disease,
$Balanced Accuracy =\frac{\text { Sensitivity }+\text { Specificty }}{2}$ (7)
Table 5. Accuracy assignment results (experiments 1 and 2)
|
|
|
AFIB |
NSR |
Noisy |
Total |
Sensitivity |
|
Experiment 1 |
AFIB |
32 |
5 |
5 |
42 |
76% |
|
NSR |
2 |
98 |
0 |
100 |
98% |
|
|
Noisy |
2 |
0 |
58 |
60 |
96% |
|
|
Total |
36 |
103 |
63 |
202 |
….. |
|
|
Specificity in % |
88.80 |
95.14 |
92.06 |
…….. |
…….. |
|
|
Experiment 2 |
AFIB |
114 |
14 |
4 |
132 |
86.60% |
|
NSR |
10 |
124 |
4 |
138 |
89.85% |
|
|
Noisy |
0 |
0 |
134 |
134 |
100% |
|
|
Total |
124 |
138 |
142 |
404 |
… |
|
|
Specificity in % |
91 |
89.85 |
94.36 |
…… |
…… |
The Kappa coefficient and the balanced accuracy are respectively 77.4% and 91% for experiment 1, and 88.11% and 91.9% for experiment 2.
4.5 Discussion
The state of having 100% accuracy (i.e. 0% error) is hard to reach. Regardless of this problem, ANN algorithm succeeds to outperform the related techniques in terms of accuracy. This is because the deeper you go into the layers, the more accurate results you get. We obtained the best accuracy for the classification of MIT-BIH ECG signals using the ANN model with an accuracy value of 93.1%, where CNN comes third with 92.7%. In fact, we exceeded the results of the study [31], where an echo-state NN has been proposed, with an accuracy of 92.7%. Moreover, we outperform the state-of-the-art in Ref. [32] with more than 3% accuracy, and we have near-zero error in histogram error detection with a small cross-entropy, which evidences the robustness of our classifier model. Our results outperform most state-of-the-art results [31, 33] in terms of sensitivity and specificity. However, they are close to the results reported in Refs. [34, 35] with less complexity. Indeed, the results reported by Ghosh et al. [27] surpass our work. This is explained by the remarkable role played in the pre-processing stage, where the analysis of the ECG signal is carried out with a large number of coefficients extracted from the input ECG signal. The associated algorithm is very complex and time-consuming, making it inefficient for real-time healthcare systems. A multi-rate cosine filter bank architecture is adopted for the evaluation of the ECG signal coefficients. Thus, the more thorough the pre-processing, the greater the accuracy, sensitivity, and specificity of the DNN. Moreover, in Ref. [36], the achieved result is 99% better than our work of 9% using CNN with the cost of processing time. This is explained by the deep feature extraction performed by the CNN convolutional layers and the key role of the Adadelta network optimizer. However, the disadvantage of these methods which require manual feature selection and prior domain information in addition to high computational complexity. Therefore, their use in a real-time application is not straightforward. Nevertheless, our proposed ANN is characterized by low architecture complexity and low execution time, which make it suitable for real-time applications such as embedded healthcare systems. The obtained results described in Table 6 are more or less similar to the state of the art in a fully automatic ECG classifier. Moreover, they clearly outperform complex feature selection approaches based on ECG classifiers. Table 6 also shows an achieved result of 93%, within the same quantitative range of the discussed techniques, but with much less computational effort. Therefore, we can say that our suggested ANN architecture managed to show a better balance between classification accuracy and network parameter complexity. On one hand, this is very important in real life where most systems are modeled as complex systems, especially for the elderly, where health care is a primary problem to be solved. On the other hand, our proposed ANN model can be generalized to predict with high accuracy on unseen datasets. Moreover, the proposed ANN model speeds up the classification of ECG signals given its architecture where the hidden layers identify the most significant information from the input layer and transmit it to the next layer, living the redundant information. However, there is no particular rule for determining the optimum ANN structure, and the suitable one is obtained by trial and error method [37]. It should be mentioned that the implementation, of different algorithms, was on GPU. It consists of hundreds of ALUS, many control units, many cache memories and DRAM memory [38]. Thus, the algorithm takes less time to train and run compared to the CPU implementation.
Table 6. Comparative study with the state-of-the-art
|
|
# |
Sensitivity |
Specificity |
Accuracy |
Complexity |
|
DenseNet |
[32] |
81% |
86% |
89.50% |
Low |
|
Echo State Networks |
[31] |
74.70% |
91.80% |
90.10% |
Low |
|
PSO+SVM |
[33] |
87.30% |
…… |
92.40% |
Low |
|
DNN |
[34] |
88.80% |
96.32% |
91.00% |
Moderate |
|
Feature selection + SVM |
[35] |
93.81% |
…….. |
86.66% |
high |
|
CNN+Adadelta |
[36] |
99.30% |
87.30% |
98.20% |
high |
|
DNN(H-ELM)+FN |
[27] |
99.40% |
98.77% |
100% |
high |
|
Experiment 1 |
our work |
90.06% |
91.95% |
93.10% |
Low |
|
Experiment 2 |
our work |
92.07% |
91.73% |
92.10% |
Low |
In this article, we studied the use of artificial neural network architectures for the automatic detection of AF for physician assistance. The analysis confirmed the robustness of our proposed architectures for the processed MIT-BIH and MIT-BIH datasets. This article further showed that the obtained results are promising in the field of automatic healthcare diagnostics. Additionally, the performance and scalability of the proposed ANN architecture in experiment 2 shows good accuracy of 93.3% as well as sensitivity and accuracy. As a result, the ROC presents an excellent curve of the rate classification results. Thus, the histogram has an error of 0.07%, which exceeds the state of the art with a relatively low number of extracted features. Our proposed technique is encouraging. It has a high degree of fidelity to diagnose the patient's ECG signal and determine its class effectively. The GPU implementation confirms the relatively low computational complexity of the system and it can help clinicians achieve zero classification error in a shorter time.
The author would like to thank Sultan Qaboos University for the financial support, grant number “IG/ENG/ECED/21/02”. Special thanks go to the student Marwa Fradi who worked as a research assistant on the project.
[1] Colilla, S., Crow, A., Petkun, W., Singer, D.E., Simon, T., Liu, X. (2013). Estimates of current and future incidence and prevalence of atrial fibrillation in the US adult population. The American Journal of Cardiology, 112(8): 1142-1147. https://doi.org/10.1016/j.amjcard.2013.05.063
[2] Kim, M.H., Johnston, S.S., Chu, B.C., Dalal, M.R., Schulman, K.L. (2011). Estimation of total incremental health care costs in patients with atrial fibrillation in the United States. Circulation: Cardiovascular Quality and Outcomes, 4(3): 313-320. https://doi.org/10.1161/CIRCOUTCOMES.110.958165
[3] https://www.hopkinsmedicine.org/health/conditions-and-diseases/anatomy-and-function-of-the-hearts-electrical-system, assessed on Jan. 10, 2022.
[4] Berkaya, S.K., Uysal, A.K., Gunal, E.S., Ergin, S., Gunal, S., Gulmezoglu, M.B. (2018). A survey on ECG analysis. Biomedical Signal Processing and Control, 43: 216-235. https://doi.org/10.1016/j.bspc.2018.03.003
[5] Celin, S., Vasanth, K. (2018). ECG signal classification using various machine learning techniques. Journal of Medical Systems, 42(12): 241. https://doi.org/10.1007/s10916-018-1083-6
[6] Lyon, A., Mincholé, A., Martínez, J.P., Laguna, P., Rodriguez, B. (2018). Computational techniques for ECG analysis and interpretation in light of their contribution to medical advances. Journal of the Royal Society Interface, 15(138): 20170821. https://doi.org/10.1098/rsif.2017.0821
[7] Xie, L., Li, Z., Zhou, Y., He, Y., Zhu, J. (2020). Computational diagnostic techniques for electrocardiogram signal analysis. Sensors, 20(21): 6318. https://doi.org/10.3390/s20216318
[8] Kiranyaz, S., Ince, T., Gabbouj, M. (2016). Real-time patient-specific ECG classification by 1-D convolutional neural networks. IEEE Transactions on Biomedical Engineering, 63(3): 664-675. https://doi.org/10.1109/TBME.2015.2468589
[9] Rafie, N., Kashou, A.H., Noseworthy, P.A. (2021). ECG interpretation: Clinical relevance, challenges, and advances. Hearts, pp. 2505-2513. https://doi.org/10.3390/hearts2040039
[10] Kwon, S., Hong, J., Choi, E.K., Lee, E., Hostallero, D.E., Kang, W.J., Yi, Y. (2019). Deep learning approaches to detect atrial fibrillation using photoplethysmographic signals: Algorithms development study. JMIR mHealth and uHealth, 7(6): e12770. https://doi.org/10.2196/12770
[11] Kumar, G., Pawar, U., Oreilly, R. (2019). Arrhythmia detection in ECG signals using a multilayer perceptron network. In: AICS, 353-364.
[12] Tripathy, R.K., Paternina, M.R.A., Arrieta, J.G., Pattanaik, P. (2017). Automated detection of atrial fibrillation ECG signals using two stage VMD and atrial fibrillation diagnosis index. Journal of Mechanics in Medicine and Biology, 17(7): 1740044. https://doi.org/10.1142/S0219519417400449
[13] Śmigiel, S., Pałczyński, K., Ledziński, D. (2021). Deep learning techniques in the classification of ECG signals using R-peak detection based on the PTB-XL dataset. Sensors, 21(24): 8174. https://doi.org/10.3390/s21248174
[14] Deevi, S.A., Kaniraja, C.P., Mani, V.D., Mishra, D., Ummar, S., Satheesh, C. (2021). HeartNetEC: A deep representation learning approach for ECG beat classification. Biomedical Engineering Letters, 11(1): 69-84. https://doi.org/10.1007/s13534-021-00184-x
[15] Shadnaz, A., Alireza, M., Maryam, M. (2015). Automatic detection of atrial fibrillation using stationary wavelet transform and support vector machine. Computers in Biology and Medicine, 60: 132-142. https://doi.org/10.1016/j.compbiomed.2015.03.005
[16] Erdenebayar, U., Kim, H., Park, J.U., Kang, D., Lee, K.J. (2019). Automatic prediction of atrial fibrillation based on convolutional neural network using a short-term normal electrocardiogram signal. Journal of Korean Medical Science, 34(7). https://doi.org/10.3346/jkms.2019.34.e64
[17] He, R., Wang, K., Zhao, N., Liu, Y., Yuan, Y., Li, Q., Zhang, H. (2018). Automatic detection of atrial fibrillation based on continuous wavelet transform and 2D convolutional neural networks. Frontiers in Physiology, 9: 1206. https://doi.org/10.3389/fphys.2018.01206
[18] Yuan, C., Yan, Y., Zhou, L., Bai, J., Wang, L. (2016). Automated atrial fibrillation detection based on deep learning network. International Conference on Information and Automation (ICIA), pp. 1159-1164.
[19] Faust, O., Shenfield, A., Kareem, M., San, T.R., Fujita, H., Acharya, U.R. (2018). Automated detection of atrial fibrillation using long short-term memory network with RR interval signals. Computers in Biology and Medicine, 102: 327-335. https://doi.org/10.1016/j.compbiomed.2018.07.001
[20] Ma, F., Zhang, J., Liang, W., Xue, J. (2020). Automated classification of atrial fibrillation using artificial neural network for wearable devices. Mathematical Problems in Engineering, 2020: 9159158. https://doi.org/10.1155/2020/9159158
[21] Andersen, R.S., Peimankar, A., Puthusserypady, S. (2019). A deep learning approach for real-time detection of atrial fibrillation. Expert Systems with Applications, 115: 465-473. https://doi.org/10.1016/j.eswa.2018.08.011
[22] Rezayi, S., Mohammadzadeh, N., Bouraghi, H., Saeedi, S., Mohammadpour, A. (2021). Timely diagnosis of acute Lymphoblastic Leukemia using artificial intelligence-oriented deep learning methods. Computational Intelligence and Neuroscience, 2021: 5478157. https://doi.org/10.1155/2021/5478157
[23] Al Rahhal, M.M., Bazi, Y., AlHichri, H., Alajlan, N., Melgani, F., Yager, R.R. (2016). Deep learning approach for active classification of electrocardiogram signals. Information Sciences, 345: 340-354. https://doi.org/10.1016/j.ins.2016.01.082
[24] Rajpurkar, P., Hannun, A.Y., Haghpanahi, M., Bourn, C., Ng, A.Y. (2017). Cardiologist-level arrhythmia detection with convolutional neural networks. ArXiv e-prints. arXiv: 1707.01836.
[25] Chetan, A., Tripathy, R.K., Dandapat, S. (2018). A diagnostic system for detection of atrial and ventricular arrhythmia episodes from electrocardiogram. Journal of Medical and Biological Engineering, 38(2): 304-315. https://doi.org/10.1007/s40846-017-0294-5
[26] Moody, G.B., Mark, R.G. (2001). The impact of the MIT-BIH arrhythmia database. IEEE Engineering in Medicine and Biology Magazine, 20(3): 45-50. https://doi.org/10.1109/51.932724
[27] Ghosh, S.K., Tripathy, R.K., Paternina, M.R., Arrieta, J.J., Zamora-Mendez, A., Naik, G.R. (2020). Detection of atrial fibrillation from single lead ECG signal using multirate cosine filter bank and deep neural network. Journal of Medical Systems, 44(6): 1-15. https://doi.org/10.1007/s10916-020-01565-y
[28] Hsieh, C.H., Li, Y.S., Hwang, B.J., Hsiao, C.H. (2020). Detection of atrial fibrillation using 1D convolutional neural network. Sensors, 20(7): 2136. https://doi.org/10.3390/s20072136
[29] Warrik, P., Homsi, M.N. (2017). Cardiac arrhythmia detection from ECG combining convolutional and long short-term memory networks. Computing in Cardiology (CinC), pp. 1-4. https://doi.org/10.22489/CinC.2017.161-460
[30] Attia, Z.I., Noseworthy, P.A., Lopez-Jimenez, F., Asirvatham, S.J., Deshmukh, A.J., Gersh, B.J., Friedman, P.A. (2019). An artificial intelligence-enabled ECG algorithm for the identification of patients with atrial fibrillation during sinus rhythm: A retrospective analysis of outcome prediction. The Lancet, 394(10201): 861-867. https://doi.org/10.1016/S0140-6736(19)31721-0
[31] Alfaras, M., Soriano, M.C., Ortín, S. (2019). A fast machine learning model for ECG-based heartbeat classification and arrhythmia detection. Frontiers in Physics, 7: 103. https://doi.org/10.3389/fphy.2019.00103
[32] Guo, L., Sim, G., Matuszewski, B. (2019). Inter-patient ECG classification with convolutional and recurrent neural networks. Biocybernetics and Biomedical Engineering, 39(3): 868-879. https://doi.org/10.1016/j.bbe.2019.06.001
[33] Garcia, G., Moreira, G., Menotti, D., Luz, E. (2017). Inter-patient ECG heartbeat classification with temporal VCG optimized by PSO. Scientific Reports, 7(1): 1-11. https://doi.org/10.1038/s41598-017-09837-3
[34] Ye, C., Kumar, B.V., Coimbra, M.T. (2015). An automatic subject-adaptable heartbeat classifier based on multiview learning. IEEE Journal of Biomedical and Health Informatics, 20(6): 1485-1492. https://doi.org/10.1109/JBHI.2015.2468224
[35] Zhang, Z., Dong, J., Luo, X., Choi, K.S., Wu, X. (2014). Heartbeat classification using disease-specific feature selection. Computers in Biology and Medicine, 46: 79-89. https://doi.org/10.1016/j.compbiomed.2013.11.019
[36] Li, J., Si, Y., Xu, T., Jiang, S. (2018). Deep convolutional neural network based ECG classification system using information fusion and one-hot encoding techniques. Mathematical Problems in Engineering, 2018: 7354081. https://doi.org/10.1155/2018/7354081
[37] Abiodun, O.I., Jantan, A., Omolara, A.E., Dada, K.V., Umar, A.M., Linus, O.U., Kiru, M.U. (2019). Comprehensive review of artificial neural network applications to pattern recognition. IEEE Access, 7: 158820-158846. https://doi.org/10.1109/ACCESS.2019.2945545
[38] Afif, M., Said, Y., Atri, M. (2020). Computer vision algorithms acceleration using graphic processors NVIDIA CUDA. Cluster Computing, 23(4): 3335-3347. https://doi.org/10.1007/s10586-020-03090-6