Lilik Sumaryanti*![]() | Nurcholis
| Nurcholis![]() | Dirwan Muchlis
| Dirwan Muchlis![]()
© 2024 The authors. This article is published by IIETA and is licensed under the CC BY 4.0 license (http://creativecommons.org/licenses/by/4.0/).
OPEN ACCESS
Merauke Regency is the largest area in Papua Province and includes potential in the livestock sector. Regional potential analysis based on leading livestock population aims to provide regional information based on livestock sector potential, which can be used as information in policy making in government programs. A hybrid algorithm combining LQ and complete linkage can map potential livestock areas based on leading populations. The results of the LQ analysis show that there are six leading types of livestock: cows, buffaloes, horses, kampong chickens, laying chickens, and ducks. The leading livestock types can be used as a source of information regarding regional potential in the livestock business and classified into four clusters. The clustering of regional potential using a complete linkage hierarchical algorithm with a livestock population dataset by conducting four trials and yielding information that Semangga and Tanah Miring sub-districts have potential in the livestock sector. The proposed method used a hybrid approach to analyze the potential of livestock areas in Merauke and determine the leading types of livestock in the area to classify areas in each cluster and map the potential of livestock areas using GIS techniques.
clustering, livestock population, Location Quotient (LQ), complete linkage, hierarchical algorithm
Merauke is the district with the largest area in Papua Province, with an area of 312,816.35 km2, with the potential for the livestock sector [1]. The central government appointed Merauke as one of the People’s Livestock Center Program areas because it has potential and advantages in the livestock sub-sector, especially cattle [2]. The land is still large and has a variety of forage sources, which is an advantage for Merauke in developing beef cattle. Based on livestock population data for 2022 [3], the large livestock population reaches 76,165 heads, which is dominated by 57% beef cattle, and the total livestock population for poultry types is 2,893,560 heads. Sources of information obtained related to areas or areas that have potential in the livestock sector through survey reports from the Central Bureau of Statistics and the Food Crops Service. Regional classification based on leading livestock population aims to present information on regional cluster based on the potential district of the livestock sector in Merauke Regenc, which can be used as information in making policies on government programs to increase business potential and livestock populations and support the sustainability of the economic livelihoods of people who depend on the livestock sector.
Mapping the potential areas of the livestock sector uses a combination of two methods—the Location Quotient to determine the leading livestock species-based population. In contrast, the hierarchical clustering method with complete linkage aims to classify and group areas in Merauke Regency based on the results of LQ analysis, using populations of leading livestock species to provide information to find locations with potential for the livestock sector. As potential investors who wish to build a strategic livestock business, use reports of the region’s potential superior livestock as source information. The object is classified to find groups from a set of points, patterns, or entities, to get more in-depth information about the data, to look for similarities, and to map objects to certain groups [4]. Clustering is a process to obtain results from partitions in a data set [5], which are mapped into a group based on their level of similarity [6]. Hierarchical grouping uses a hierarchical (level) arrangement model in the data set based on the characteristics of the data [7], which are then grouped into a cluster [8]. The hierarchical method groups the training data into a cluster tree structure called a dendrogram [9]. The combination of the desertification mapping model and hierarchical analysis shows that different work units with the same level of desertification severity require other management decisions [10]. The application of the clustering method processes the data set to be partitioned appropriately into a cluster [11], the implementation of the clustering technique on food classification with the same or nearly the same speed classified into one set, the determination of cluster members is based on the minimum distance between the object and the center of the cluster [12].
Regional potential clustering in the livestock sector combines the Location Quotient (LQ) and hierarchical methods. The LQ method is a technique for analyzing the performance of a leading base sector [13] by measuring relative concentration [14] based on a comparative approach to the potential of an area [15]. Identifying leading sectors using LQ is the first step to determining policy-making in developing economic sectors [16]. The Location Quotient method finds three significant industries in Qinghai: agriculture, forestry, animal husbandry, and fisheries. By comparing the distribution of primary industry value locations in Qinghai Province from 2015 to 2019, the analysis results can conclude that the agricultural sector’s LQ value is <1. It did not have a comparative advantage [17]. Location Quotient (LQ) analysis in basic sector identification research uses GRDP to indicate regional growth [18]. Complete linkage is a hierarchical clustering technique called the farthest neighbor approach. This method uses the farthest distance between two different groups [19]. Every object in the same cluster is relatively homogeneous [20] compared to things in other sets [21]. Determining the membership of a regional group with potential in the livestock sector based on the leading livestock population uses the hierarchical clustering method, which is the final step in analyzing livestock potential in Merauke. Determination of the membership using the Euclidean distance for each cluster by calculating the distance between objects [22, 23]. This research aims to propose a hybrid method that combines LQ and hierarchical clustering methods to analyze regional potential in the Merauke regency, which is carried out by determining leading livestock as a source of information for regional clustering using GIS techniques.
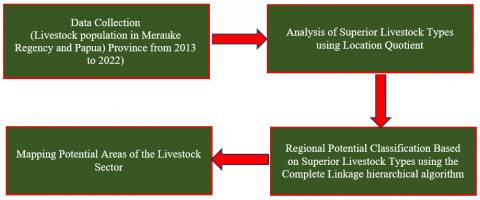
Analysis of the potential of the livestock area by clustering process in the livestock sector begins with collecting livestock population data based on the type of livestock in Merauke Regency and Papua Province. The total livestock population was analyzed using the LQ method to determine the types of livestock that are the basis/prominent in Merauke. The results of the LQ analysis can be identified as the basis of the kind of livestock and then used as a dataset for the clustering stage using the complete linkage hierarchical algorithm. The research method consists of several steps of activity shown in Figure 1.
Figure 1. Regional potential analysis stage
(1). Data collection is a process of collecting information related to the population of livestock categorized by type. The livestock population data used are in Merauke Regency and Papua Province from 2013 to 2022, obtained from a survey by the Central Statistics Agency.
(2). LQ analysis to find out the leading types of livestock in Merauke Regency is carried out by comparing livestock populations at the Papua Province level.
(3). Classification of livestock potential areas based on the leading livestock population using Complete linkage is essential for grouping areas to obtain clusters based on livestock potential.
(4). Mapping potential sub-districts in the livestock sector based on clustering results is carried out as the final stage by mapping the area by coloring the area map according to the clustering results in point 3.
2.1 Location Quotient for analysis of leading livestock types
Location Quotient Analysis (LQ) is obtained by comparing the role of the sector/industry in a district/city to the part of the sector/industry in the province [24, 25] or showing the results for the location of a factor in an area different from the high level of the whole region [26]. Determination of the type of livestock that is the basis/prominent based on livestock population by comparing livestock populations in Merauke Regency and Papua province [27], using the following equation [28]:
$L Q_i=\frac{v_i / \sum_i^n v_i}{V_i / \sum_i^n V_i} $ (1)
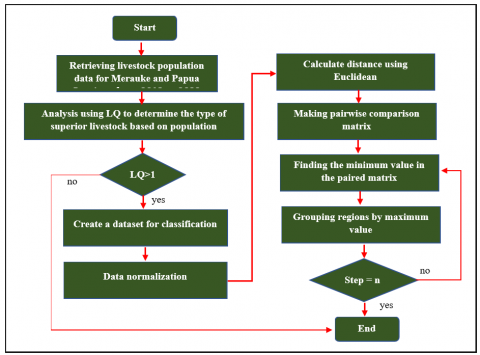
Vi is the livestock population at the provincial level, and vi is the livestock district level. Determine the type of livestock that has the potential to stand out in the Merauke Regency, selecting the types of leading livestock if it has an LQ value of > 1 by applying Eq. (1) [29]. In several cases, LQ analysis shows whether the sector that is the basis/main can be self-sufficient or an exporter or whether the sector imports from other regions [30]. Figure 2 shows a flowchart for analyzing potential livestock areas based on the leading species. The complete linkage clustering process until the specified number of clusters is defined.
Figure 2. Flowchart for analysis of potential areas using a hybrid algorithm
2.2 Hierarchical clustering using complete linkage
The hierarchical method in cluster analysis forms certain levels [31], such as in a tree structure, because the clustering process is carried out in stages and stages [32]. The results of the hierarchical method can be presented in the form of a dendrogram [33]. The dendrogram is a visual representation of the steps in the cluster analysis, showing how clusters are formed and the value of the distance coefficient at each stage. The complete-linkage method is also known as the farthest neighbor method, and cluster similarity is based on the maximum distance between observations in each cluster [34]. This method is based on the maximum distance, where the distance between one set and another is measured based on the object with the farthest distance. The reasons for choosing the hierarchical clustering method are [35]: (a). Flexibility: Hierarchical clustering allows you to select the number of clusters you want to form, making it more flexible than other clustering methods [36]; (b). Interpretability: The output of hierarchical clustering can be represented as a dendrogram, a tree-like diagram showing the relationships between clusters. So it makes interpreting and understanding the results easier; (c). Robustness: Hierarchical clustering is robust to noise and outliers in the data, meaning that it can still identify meaningful clusters even if some data points are not well-behaved. The steps of the complete linkage method are as follows [37]:
$d_{x, y}=\sqrt{\sum_{i=1}^n\left(x_i-y_i\right)^2}$ (2)
The distance matrix uses the same calculation, and the distance matrices are cluster 1 and cluster 3, cluster 1 and cluster 4, and so on.
$d(x y) z=\max \{d x z, d y z\}$ (3)
Create the latest distance matrix based on previous calculations.
The proposed hybrid method provides information on analyzing potential livestock areas based on the classification of leading livestock populations using dendrograms and regional mapping of each cluster using the GIS method, which is explained in the results and discussion.
Classification of areas that have the potential for the livestock sector in Merauke Regency, based on data on the number of livestock populations from 2013 to 2022, which was sourced from the results of a survey by the Merauke Center for Statistics. The population based on the type of livestock is categorized into three categories: ruminants, monogastric, and poultry. Ruminant livestock are ruminants, herbivorous animals with a two-step digestive system, with the main characteristic of ruminants being that they have two chewing phases before their food can be digested in the stomach [40], which include this animal category, namely cows, buffalo, goat. Monogastric are animals with a single and straightforward stomach [41]. The digestive system consists of the mouth, oesophagus, stomach, small intestine, large intestine, and rectum. The digestive system is called the simple monogastric system, which includes animals in this category, namely horses and pigs. While the poultry category is an animal that can be taken as a result in the form of eggs and meat, which are a source of animal protein [42], the types of livestock include native chickens, laying hens, broilers, and ducks.
Population data based on the type of livestock in Merauke Regency in Table 1 shows that, on average, there is an increase in the livestock population each year. The largest population for the ruminant category is dominated by cattle, with the highest population reaching 43220 heads; for the monogastric variety, pigs have the largest population, 15835 heads, and the most common type of poultry is Kampong chicken.
Table 1. Population data by type of livestock in Merauke District
|
No. |
Year |
Livestock Population (Head) |
||||||||
|
Cow |
Buffalo |
Horse |
Goat |
Pig |
Kampong Chicken |
Laying Chicken |
Broiler |
Duck |
||
|
1 |
2013 |
31799 |
1238 |
1613 |
6518 |
5273 |
935975 |
105590 |
301700 |
29044 |
|
2 |
2014 |
33516 |
544 |
1564 |
6738 |
6397 |
986123 |
186219 |
325048 |
29238 |
|
3 |
2015 |
34521 |
555 |
1736 |
7353 |
7165 |
1084735 |
263582 |
364054 |
31115 |
|
4 |
2016 |
35844 |
551 |
1928 |
8023 |
8024 |
1138972 |
289940 |
407740 |
31019 |
|
5 |
2017 |
36923 |
573 |
1986 |
8755 |
8987 |
1252869 |
318934 |
477022 |
33010 |
|
6 |
2018 |
38400 |
608 |
2158 |
9553 |
10064 |
1287019 |
247858 |
511619 |
34000 |
|
7 |
2019 |
39552 |
620 |
2622 |
19106 |
11272 |
1515971 |
272644 |
573013 |
35020 |
|
8 |
2020 |
40739 |
632 |
2674 |
11375 |
12596 |
1682728 |
299907 |
641775 |
36071 |
|
9 |
2021 |
41967 |
648 |
2845 |
12415 |
14138 |
1886926 |
135065 |
442701 |
37121 |
|
10 |
2022 |
43220 |
661 |
2902 |
13547 |
15835 |
2075619 |
197825 |
580193 |
38235 |
|
Total |
376481 |
6630 |
22028 |
103383 |
99751 |
13846937 |
2317564 |
4624865 |
333873 |
|
Table 2. Livestock population data in Papua Province from 2013 to 2022
|
No. |
Year |
Livestock Population (Head) |
||||||||
|
Cow |
Buffalo |
Horse |
Goat |
Pig |
Kampong Chicken |
Laying Chicken |
Broiler |
Duck |
||
|
1 |
2013 |
79574 |
549 |
1559 |
35251 |
579024 |
1942197 |
123690 |
2518146 |
56893 |
|
2 |
2014 |
94865 |
751 |
1611 |
49247 |
680099 |
1752471 |
279398 |
2429707 |
58674 |
|
3 |
2015 |
100311 |
752 |
1772 |
49615 |
706108 |
1859083 |
460179 |
3979864 |
71801 |
|
4 |
2016 |
111273 |
768 |
1975 |
54060 |
760472 |
2017749 |
560464 |
6456766 |
68725 |
|
5 |
2017 |
117602 |
765 |
2035 |
57955 |
805450 |
2110827 |
637707 |
6902531 |
79468 |
|
6 |
2018 |
82309 |
725 |
2222 |
56239 |
685475 |
2142662 |
739192 |
6624212 |
77498 |
|
7 |
2019 |
112803 |
731 |
2658 |
67156 |
728212 |
2305122 |
838984 |
6572313 |
91221 |
|
8 |
2020 |
111604 |
780 |
2717 |
70832 |
994827 |
2569101 |
721233 |
6431156 |
90766 |
|
9 |
2021 |
121678 |
808 |
2772 |
73948 |
1022717 |
2771834 |
687888 |
5532409 |
94120 |
|
10 |
2022 |
125101 |
838 |
2955 |
92878 |
76390 |
3005771 |
1077558 |
3282917 |
192743 |
|
Total |
1057120 |
7467 |
22276 |
607181 |
7038774 |
22476817 |
6126293 |
50730021 |
881909 |
|
Determining the leading types of livestock in Merauke Regency using the LQ method is done by comparing livestock population data in Tables 1 and 2, which are calculated based on Equation 1. If the results of the calculation of the LQ value of livestock species are> 1, it can be concluded that these types of livestock stand out and become the basis, and vice versa [25]. The analysis of the LQ method in Table 3 shows six leading livestock types: cows, buffaloes, horses, native chickens, laying hens, and ducks. The application of the LQ method for the area classification stage is to reduce irrelevant features in the determination of clusters so that the classification results of potential livestock areas can be more accurate based on the number of prominent livestock populations.
Table 3. Analysis of livestock population using Location Quotient in Merauke regency
|
No. |
Livestock Type |
Livestock Population in Merauke Regency |
Livestock Population in Papua Province |
$\frac{v_i}{\sum_i^n v_i}$ |
$\frac{\boldsymbol{V}_i}{\sum_i^n V_i}$ |
LQ Value |
Result |
|
1 |
Cow |
376481 |
1057120 |
0,0173242 |
0,0118847 |
1,46 |
Basis |
|
2 |
Buffalo |
6630 |
7467 |
0,0003051 |
0,0000839 |
3,63 |
Basis |
|
3 |
Horse |
22028 |
22276 |
0,0010136 |
0,0002504 |
4,05 |
Basis |
|
4 |
Goat |
103383 |
607181 |
0,0047573 |
0,0068263 |
0,70 |
Non-basis |
|
5 |
Pig |
99751 |
7038774 |
0,0045902 |
0,0791337 |
0,06 |
Non-basis |
|
6 |
Kampong chicken |
13846937 |
22476817 |
0,6371824 |
0,2526966 |
2,52 |
Basis |
|
7 |
Laying chicken |
2317564 |
6126293 |
0,1066453 |
0,0688751 |
1,55 |
Basis |
|
8 |
Broiler |
4624865 |
50730021 |
0,2128184 |
0,5703344 |
0,37 |
Non-basis |
|
9 |
Duck |
333873 |
881909 |
0,0153635 |
0,0099149 |
1,55 |
Basis |
3.2 Hierarchical algorithm application for classification of livestock area potential
Implementation of the potential area classification of the livestock sector in Merauke Regency uses the features of the leading livestock species population using a complete linkage hierarchical algorithm. Clustering areas based on districts use livestock population data for 2022, and the number of clusters used is 4. The clustering process for potential livestock areas is explained as follows:
$D_{\text {norm }}=\frac{D_i-D_{\min }}{D_{\text {max }}-D_{\text {min }}}$ (4)
The results of data normalization using the min-max method are shown in Table 4. The normalization results show that all data are on a 0 and 1 values scale.
Next, a search for the maximum distance d(DT2, DT4) with other objects is carried out using Eq. (3) to determine the new distance from the clusters that have been formed, for example, as follows:
d(DT2 DT4)DT1=max{DT2 DT1,DT4 DT1} =max{0.054, 0.053} = 0.054
Table 4. Dataset normalization results using the min-max method
|
No. |
District Code |
District Name |
Livestock Type |
|||||
|
Cow |
Bufallo |
Horse |
Kampong Chicken |
Laying Chicken |
Duck |
|||
|
1 |
DT1 |
Kimaam |
0,01387 |
0,00000 |
0,05216 |
0,00018 |
0,00000 |
0,00000 |
|
2 |
DT2 |
Tabonji |
0,00000 |
0,00000 |
0,00000 |
0,00015 |
0,00000 |
0,00000 |
|
3 |
DT3 |
Waan |
0,00426 |
0,02488 |
0,00000 |
0,00000 |
0,00000 |
0,00000 |
|
4 |
DT4 |
Ilwayab |
0,00599 |
0,00000 |
0,00000 |
0,00038 |
0,00000 |
0,00000 |
|
5 |
DT5 |
Okaba |
0,26541 |
0,00000 |
0,47122 |
0,00445 |
0,00000 |
0,77363 |
|
6 |
DT6 |
Tubang |
0,02947 |
0,00000 |
0,03237 |
0,00147 |
0,00000 |
0,00000 |
|
7 |
DT7 |
Ngguti |
0,01387 |
0,00000 |
0,00000 |
0,00017 |
0,00000 |
0,00000 |
|
8 |
DT8 |
Kaptel |
0,02175 |
0,00000 |
0,00000 |
0,00023 |
0,00000 |
0,00000 |
|
9 |
DT9 |
Kurik |
0,96643 |
0,79602 |
0,61511 |
1,00000 |
0,13315 |
0,58311 |
|
10 |
DT10 |
Animha |
0,20362 |
0,12438 |
0,05576 |
0,00239 |
0,00000 |
0,02590 |
|
11 |
DT11 |
Malind |
0,60284 |
1,00000 |
0,41007 |
0,64758 |
0,12597 |
0,43445 |
|
12 |
DT12 |
Merauke |
0,48101 |
0,12438 |
0,99460 |
0,26569 |
1,00000 |
0,39435 |
|
13 |
DT13 |
Naukenjerai |
0,30418 |
0,02985 |
0,16187 |
0,00215 |
0,00000 |
0,11853 |
|
14 |
DT14 |
Semangga |
0,99921 |
0,25871 |
0,69424 |
0,56661 |
0,65193 |
0,89801 |
|
15 |
DT15 |
Tanah Miring |
1,00000 |
0,37313 |
0,25000 |
0,62888 |
0,42239 |
1,00000 |
|
16 |
DT16 |
Jagebob |
0,70875 |
0,25871 |
0,26619 |
0,02892 |
0,06955 |
0,20339 |
|
17 |
DT17 |
Sota |
0,18471 |
0,01990 |
0,10971 |
0,00324 |
0,03281 |
0,07507 |
|
18 |
DT18 |
Muting |
0,24649 |
0,11940 |
1,00000 |
0,02409 |
0,00000 |
0,33597 |
|
19 |
DT19 |
Elikobel |
0,23972 |
0,00000 |
0,04496 |
0,03485 |
0,02231 |
0,45010 |
|
20 |
DT20 |
Ulilin |
0,52009 |
0,15920 |
0,06115 |
0,01904 |
0,13778 |
0,30231 |
Table 5. Paired matrices using the Euclidean distance calculation
|
DT1 |
DT2 |
DT3 |
DT4 |
DT5 |
DT6 |
DT7 |
DT8 |
DT9 |
DT10 |
DT11 |
DT12 |
DT13 |
DT14 |
DT15 |
DT16 |
DT17 |
DT18 |
DT19 |
DT20 |
|
|
DT1 |
0 |
0,054 |
0,059 |
0,053 |
0,915 |
0,025 |
0,052 |
0,053 |
1,793 |
0,228 |
1,449 |
1,532 |
0,334 |
1,733 |
1,651 |
0,802 |
0,199 |
1,039 |
0,505 |
0,626 |
|
DT2 |
0,054 |
0 |
0,0252 |
0,006 |
0,944 |
0,044 |
0,014 |
0,022 |
1,818 |
0,246 |
1,468 |
1,569 |
0,366 |
1,761 |
1,666 |
0,829 |
0,231 |
1,090 |
0,514 |
0,641 |
|
DT3 |
0,059 |
0,025 |
0 |
0,025 |
0,943 |
0,048 |
0,027 |
0,030 |
1,805 |
0,231 |
1,450 |
1,566 |
0,361 |
1,755 |
1,658 |
0,818 |
0,227 |
1,087 |
0,512 |
0,631 |
|
DT4 |
0,053 |
0,006 |
0,025 |
0 |
0,942 |
0,040 |
0,008 |
0,016 |
1,814 |
0,241 |
1,466 |
1,567 |
0,361 |
1,757 |
1,662 |
0,824 |
0,226 |
1,089 |
0,511 |
0,636 |
|
DT5 |
0,915 |
0,944 |
0,943 |
0,942 |
0 |
0,920 |
0,940 |
0,938 |
1,480 |
0,867 |
1,289 |
1,244 |
0,726 |
1,188 |
1,161 |
0,798 |
0,792 |
0,697 |
0,537 |
0,707 |
|
DT6 |
0,025 |
0,044 |
0,048 |
0,040 |
0,920 |
0 |
0,036 |
0,033 |
1,791 |
0,217 |
1,447 |
1,540 |
0,327 |
1,731 |
1,643 |
0,794 |
0,193 |
1,054 |
0,499 |
0,614 |
|
DT7 |
0,052 |
0,014 |
0,027 |
0,008 |
0,940 |
0,036 |
0 |
0,008 |
1,810 |
0,235 |
1,462 |
1,565 |
0,354 |
1,753 |
1,658 |
0,817 |
0,220 |
1,087 |
0,507 |
0,629 |
|
DT8 |
0,053 |
0,022 |
0,030 |
0,016 |
0,938 |
0,033 |
0,008 |
0 |
1,806 |
0,229 |
1,459 |
1,563 |
0,348 |
1,748 |
1,653 |
0,810 |
0,214 |
1,085 |
0,504 |
0,623 |
|
DT9 |
1,793 |
1,818 |
1,805 |
1,814 |
1,480 |
1,791 |
1,810 |
1,806 |
0 |
1,634 |
0,602 |
1,469 |
1,569 |
0,923 |
0,842 |
1,252 |
1,652 |
1,468 |
1,565 |
1,397 |
|
DT10 |
0,228 |
0,246 |
0,231 |
0,241 |
0,867 |
0,217 |
0,235 |
0,229 |
1,634 |
0 |
1,285 |
1,471 |
0,197 |
1,601 |
1,501 |
0,595 |
0,133 |
0,995 |
0,445 |
0,444 |
|
DT11 |
1,449 |
1,468 |
1,450 |
1,466 |
1,289 |
1,447 |
1,462 |
1,459 |
0,602 |
1,285 |
0 |
1,426 |
1,274 |
1,134 |
0,992 |
1,010 |
1,334 |
1,290 |
1,285 |
1,117 |
|
DT12 |
1,532 |
1,569 |
1,566 |
1,567 |
1,244 |
1,540 |
1,565 |
1,563 |
1,469 |
1,471 |
1,426 |
0 |
1,371 |
0,918 |
1,311 |
1,249 |
1,410 |
1,057 |
1,410 |
1,299 |
|
DT13 |
0,334 |
0,366 |
0,361 |
0,361 |
0,726 |
0,327 |
0,354 |
0,348 |
1,569 |
0,197 |
1,274 |
1,371 |
0 |
1,473 |
1,399 |
0,490 |
0,142 |
0,873 |
0,361 |
0,356 |
|
DT14 |
1,733 |
1,761 |
1,755 |
1,757 |
1,188 |
1,731 |
1,753 |
1,748 |
0,923 |
1,601 |
1,134 |
0,918 |
1,473 |
0 |
0,527 |
1,174 |
1,562 |
1,309 |
1,395 |
1,249 |
|
DT15 |
1,651 |
1,666 |
1,658 |
1,662 |
1,161 |
1,643 |
1,658 |
1,653 |
0,842 |
1,501 |
0,992 |
1,311 |
1,399 |
0,527 |
0 |
1,103 |
1,486 |
1,476 |
1,255 |
1,119 |
|
DT16 |
0,802 |
0,829 |
0,818 |
0,824 |
0,798 |
0,794 |
0,817 |
0,810 |
1,252 |
0,595 |
1,010 |
1,249 |
0,490 |
1,174 |
1,103 |
0 |
0,612 |
0,891 |
0,632 |
0,319 |
|
DT17 |
0,199 |
0,231 |
0,227 |
0,226 |
0,792 |
0,193 |
0,220 |
0,214 |
1,652 |
0,133 |
1,334 |
1,410 |
0,142 |
1,562 |
1,486 |
0,612 |
0 |
0,936 |
0,386 |
0,444 |
|
DT18 |
1,039 |
1,090 |
1,087 |
1,089 |
0,697 |
1,054 |
1,087 |
1,085 |
1,468 |
0,995 |
1,290 |
1,057 |
0,873 |
1,309 |
1,476 |
0,891 |
0,936 |
0 |
0,970 |
0,989 |
|
DT19 |
0,505 |
0,514 |
0,512 |
0,511 |
0,537 |
0,499 |
0,507 |
0,504 |
1,565 |
0,445 |
1,285 |
1,410 |
0,361 |
1,395 |
1,255 |
0,632 |
0,386 |
0,970 |
0 |
0,374 |
|
DT20 |
0,626 |
0,641 |
0,631 |
0,636 |
0,707 |
0,614 |
0,629 |
0,623 |
1,397 |
0,444 |
1,117 |
1,299 |
0,356 |
1,249 |
1,119 |
0,319 |
0,444 |
0,989 |
0,374 |
0 |
3.2.1 Analysis of the potential of the livestock areas based on leading livestock population mixed
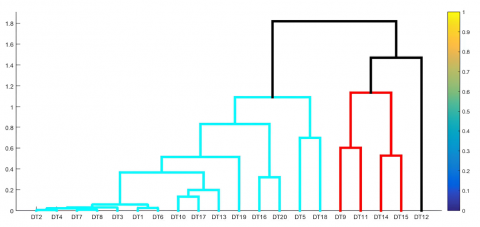
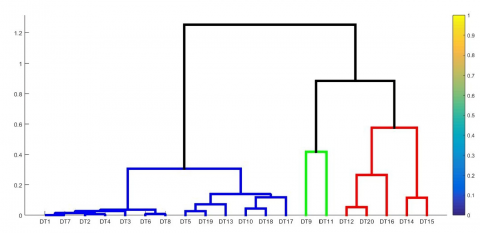
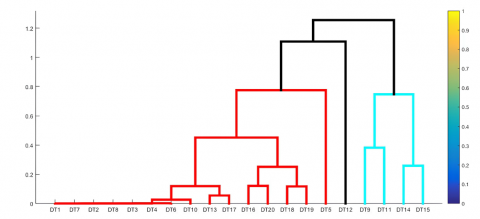
The results of the classification of potential livestock areas using a hierarchical algorithm are represented in the form of a dendrogram, which graphically shows the occurrence of multilevel merging between objects/regions so that they are formed like a tree diagram, which consists of branches representing the number of clusters that meet together. Regional classification is based on the combined population of superior livestock composed of six types: cows, buffalo, horses, free-range chickens, laying hens, and ducks. The results of determining the members of each cluster are explained as follows:
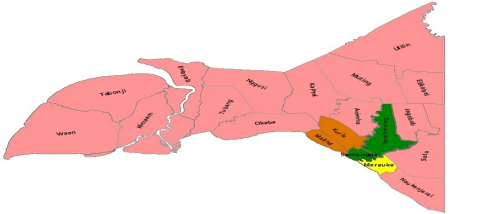
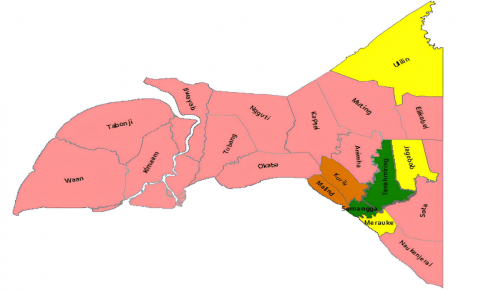
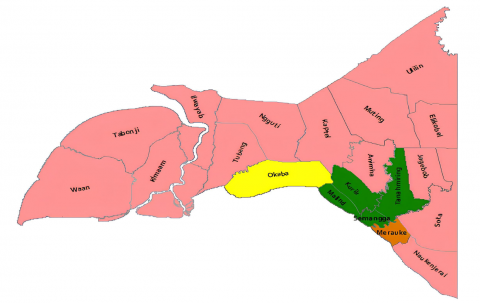
Figure 3 is a dendrogram showing the results of the classification process graphically by merging objects in stages, which shows that the first objects are merged into one cluster, namely DT2, and DT4, then (DT2; DT4) are combined into one cluster with DT17, and so on. until the number of clusters is equal to 4. The results of regional mapping apply GIS techniques that classify potential areas with four colors.
(a) Dendrogram using a mixture of leading livestock species
(b) Mapping results of potential livestock areas based on mixed features
Figure 3. The results of the analysis of potential livestock areas based on varied features using a hybrid algorithm
3.2.2 Classification of livestock potential areas based on livestock categories
Analyze livestock potential areas Using a dataset with various livestock category features, ruminants, monogastric, and poultry. The results of the classification by category are explained as follows.
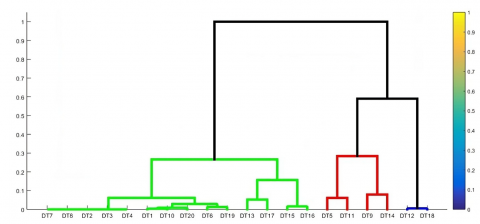
(a) Dendrogram of region clustering results based on ruminant livestock population
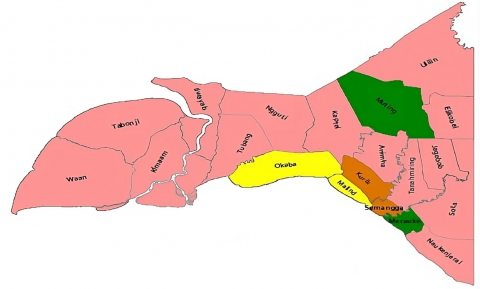
(b) Mapping potential areas of ruminant livestock
Figure 4. The results of the analysis of the potential of the livestock area based on the ruminant livestock population
(a) Dendrogram of region clustering results based on monogastric livestock population
(b) Mapping potential areas of monogastric livestock
Figure 5. The results of the analysis of the potential of the livestock area based on the monogastric livestock population
(a) Dendrogram of region clustering results based on poultry livestock population
(b) Mapping potential areas of poultry livestock
Figure 6. The results of the analysis of the potential of the livestock area based on the poultry livestock population
Data grouping uses Hierarchical Clustering by creating a hierarchical chart (dendrogram) to show similarities between data. Every similar data will have a close hierarchical relationship and form a data cluster. The hierarchy chart will continue to form until all data is connected [35]. The hierarchical clustering method aims to create clusters with members that have the same characteristics in one cluster and different characteristics between clusters. This concept requires the cluster creation process to consider the distance between objects [44]. The formation of multilevel clusters helps present information on the potential of livestock areas in a tiered manner, starting from the cluster with the lowest livestock population to the cluster consisting of areas with the highest livestock population.
Silhouette index testing for each clustering result in each method will be used to find out which cluster is the best to use. The silhouette index is one way that can be used to determine the strength of a cluster and see its quality. A good silhouette index value is close to 1 [45]. Research related to the comparison of clustering using the hierarchical algorithm Single Linkage, Complete Linkage, and Average Linkage Methods on Community Welfare shows that the best results for the silhouette index test use the average linkage method with 3 clusters with a value of 0.6054 compared to other methods [46].
Future research could explore the average linkage clustering and non-hierarchical methods, such as K-Means, to assign data points to clusters based on the shortest distance to the centroid or cluster center. The main goal of this algorithm is to minimize the total distance between data points and their respective clusters so that it is free to initialize without parameter selection and can find the optimal number of clusters [47].
Analysis of the potential of livestock areas using a hybrid algorithm that combines the LQ method and complete linkage to determine the leading livestock species. The results of the analysis show that there are six leading livestock species. The leading population of livestock species is used as a dataset at the regional clustering stage using a complete linkage hierarchy algorithm; the results of the analysis using a variety of datasets, based on four trials, produce four clusters, namely clusters with high potential, clusters with potential, clusters with enough potential and groups with less potential. The clustering results provide information that the districts that are members of the set have great potential in the livestock sector based on livestock population, namely Semangga and Tanah Miring Districts. The presentation of information on the potential of livestock areas analyzed using the proposed hybrid algorithm can be used as a source of information for local governments and entrepreneurs to develop livestock businesses in the future.
The paper was funded by Directorate General of Research and Technology Higher Education, Cq Directorate of Research, Technology and Community Service (Grant No.: 032/E5/PG.02.00.PL/2023), and derivative (Grant No.: 091/UN52.8/LT/2023), from the Institute for Research and Community Service (LPPM) Musamus University.
[1] Peternakan, D.J. (2012). Kesehatan Hewan Kementrian Pertanian 2012. Stataistik Peternakan 2012. Jakarta.
[2] Tiro, B.M., Palobo, F., Beding, P.A., Thamrin, M. (2020). Kajian dinamika bobot badan sapi potong dan potensi pakan di kabupaten merauke, papua. Jurnal Pertanian Agros, 22(2): 113-127. http://doi.org/10.37159/jpa.v22i2.1120
[3] BPS Kabupaten Merauke, Kabupaten Merauke Dalam Angka 2023. Merauke: BPS Kabupaten Merauke, 2023.
[4] Arianti, N. D., Muslih, M., Irawan, C., Saputra, E., Bulan, R. (2023). Classification of harvesting age of mango based on NIR spectra using machine learning algorithms. Mathematical Modelling of Engineering Problems, 10(1): 204-211. https://doi.org/10.18280/mmep.100123
[5] Ibrahim, I.K., Elmorsy, S.A., Kashef, N.M., Al-Borai, M.M.M. (2023). Securing e-governance services based on two level classification algorithms. Mathematical Modelling of Engineering Problems, 10(2): 442-450. https://doi.org/10.18280/mmep.100208
[6] Shlash, M.A., Obead, I.H. (2023). Supervised classification of groundwater potential mapping using integrated machine learning and GIS-based techniques. Mathematical Modelling of Engineering Problems, 10(3): 829-842. https://doi.org/10.18280/mmep.100313
[7] Nurseptiani, A., Satria, Y., Burhan, H. (2021). Application of agglomerative hierarchical clustering to optimize matching problems in ridesharing for maximize total distance savings. Journal of Physics: Conference Series, 1821(1): 012016. https://doi.org/10.1088/1742-6596/1821/1/012016
[8] Alamtaha, Z., Djakaria, I., Yahya, N.I., Matematika, J., Mipa, F. (2023). Implementasi algoritma hierarchical clustering dan non-hierarchical clustering untuk pengelompokkan pengguna media sosial. Estimasi: Jurnal Statistika dan Its Applications, 4(1): 2721-379. https://doi.org/10.20956/ejsa.vi.24830
[9] Sumaryanti, L., Widjastuti, R., Tempola, F., Ismanto, H. (2022). Classification of agriculture area based on superior commodities in geographic information system. International Journal of Advanced Computer Science and Applications, 13(10): 115-121. https://doi.org/10.14569/IJACSA.2022.0131015
[10] Xu, N., Finkelman, R.B., Dai, S., Xu, C., Peng, M. (2021). Average linkage hierarchical clustering algorithm for determining the relationships between elements in coal. ACS Omega, 6(9): 6206-6217. https://doi.org/10.1021/acsomega.0c05758
[11] Bandyopadhyay, S., Coyle, E.J. (2003). An energy efficient split-and-merge clustering algorithm for wireless sensor networks. IEEE INFOCOM, 4(19): 1117-1723. https://doi.org/10.1109/INFCOM.2003.1209194
[12] Farooqui, M., Rahman, A.-u., Alorefan, R., Alqusser, M., Alzaid, L., Alnajim, S., Althobaiti, A., Ahmed, M.S. (2023). Food Classification using deep learning: Presenting a new food segmentation dataset. Mathematical Modelling of Engineering Problems, 10(3): 1017-1024. https://doi.org/10.18280/mmep.100336
[13] Johari, M., Sukmana, A.H. (2021). Location Quotient analysis in identifying leading sector in east lombok regency 2015-2020. International Journal of Islamic and Social Sciences (ISOS), 1(3): 28-35.
[14] Humaidi, E., Kertayoga, I.P.A.W., Analianasari. (2021). Preparation of a map of leading food commodities in the Lampung province using the Location Quotient (LQ) method. IOP Conference Series: Earth and Environmental Science, 1012(1): 012009. https://doi.org/10.1088/1755-1315/1012/1/012009
[15] Sausan, A.M., Cahyani, A., Ashidieq, F.N., Risqa, M.A., Bahri, M.S.A., Wahyudi, R., Gitanto, V.R., Putri, R.F. (2022). Location Quotient Analysis of the Agricultural Sector in Yogyakarta, Indonesia. In 2nd International Conference on Smart and Innovative Agriculture (ICoSIA 2021), 5-9. https://doi.org/10.2991/absr.k.220305.002
[16] Harjanti, D.T., Apriliyana, M.I., Arini, A.C. (2021). Analysis of regional leading sector through Location Quotient approach, shift share analysis, and klassen typology (Case Study: Sanggau Regency, West Kalimantan Province). Jurnal Geografi Gea, 21(2): 147-158. https://doi.org/10.17509/gea.v21i2.38870
[17] Yu, W. (2020). Analysis of Location Quotient of major industries in Qinghai province. E3S Web of Conferences, 189: 1-5. https://doi.org/10.1051/e3sconf/202018901009
[18] Rahadiantino, L., Fathurrohman, J. (2021). Location Quotient analysis to facing competition in the pandemic era of COVID-19 (Case Study: East Java Province). Jurnal Sosial Humaniora, Special Edition Toward a Post-COVID, 19: 44-51. http://dx.doi.org/10.12962/j24433527.v0i0.8274
[19] Azzahrah, F., Annas, S., Rais, Z. (2022). Hybrid hierarchical clustering dalam pengelompokan daerah rawan bencana tanah longsor di sulawesi selatan. VARIANSI Journal of Statistics and Its Applications on Teaching and Research, 4(3): 153-161. https://doi.org/10.35580/variansiunm38
[20] Iqbal, M., Ryando, M.B. (2022). Clustering of prospective new students using agglomerative hierarchical clustering. International Proceeding Conference on Information Technology and Multimedia, Architecture, Design and E-business, 2: 183-192.
[21] Utari, D.T., Hanun, D.S. (2021). Hierarchical clustering approach for region analysis of contraceptive users. EKSAKTA Journal of Science Data Analysis, 2(2): 99-108. https://doi.org/10.20885/eksakta.vol2.iss2.art3
[22] Mongi, C.E., Langi, Y.A.R., Montolalu, C.E.J.C., Nainggolan, N. (2019). Comparison of hierarchical clustering methods (case study: Data on poverty influence in North Sulawesi). IOP Conference Series: Materials Science and Engineering, 567(1): 012048. https://doi.org/10.1088/1757-899X/567/1/012048
[23] Gao, S. (2022). The application of information classification in agricultural production based on internet of things and deep learning. IEEE Access, 10: 22622-22630. https://doi.org/10.1109/ACCESS.2022.3154607
[24] Maulana, Y.S., Munawar, A.H., Hadiani, D., Ratningsih, Wibisono, T. (2020). Location Quotient Analysis (LQ) in determining the excellent commodity. In Proceedings of the 1st International Conference on Science, Health, Economics, Education and Technology (ICoSHEET 2019), Location, Atlantis Press, pp. 65-68. https://doi.org/10.2991/ahsr.k.200723.015
[25] Panagiotopoulos, G., Kaliampakos, D. (2021). Location Quotient-based travel costs for determining accessibility changes. Journal of Transport Geography, 91: 102951. https://doi.org/10.1016/j.jtrangeo.2021.102951
[26] Xu, N., Cheng, Y., Xu, X. (2018). Using Location Quotients to determine public-natural space spatial patterns: A Zurich model. Sustainability, 10(10): 3462. https://doi.org/10.3390/su10103462
[27] Wahyuningsih, Y.E., Ansari, L.P., Yasrizal, Y., Sani, S.R., Zulham, T., Saputra, J. (2022). Analyzing the regional leading sectors with Location Quotient and its effect on economic growth in Aceh Jaya, Indonesia. Frontiers in Business and Economics, 1(1): 35-42. https://doi.org/10.56225/finbe.v1i1.83
[28] Iglesias, M. N. (2021). Measuring size distortions of Location Quotients. International Economics, 167: 189-205. https://doi.org/10.1016/j.inteco.2021.05.005
[29] Nie, T., Li, N., Yan, F. (2022). Distortion and improvement method of Location Quotient in water consumption evaluation. Mathematical Problems in Engineering. https://doi.org/10.1155/2022/9600265
[30] Pereira-López, X., Sánchez-Chóez, N.G., Fernández-Fernández, M. (2021). Performance of bidimensional Location Quotients for constructing input–output tables. Journal of Economic Structures, 10(1): 1-16. https://doi.org/10.1186/s40008-021-00237-5
[31] Gere, A. (2023). Recommendations for validating hierarchical clustering in consumer sensory projects. Current Research in Food Science, 6: 100522. https://doi.org/10.1016/j.crfs.2023.100522
[32] Ros, F., Guillaume, S. (2019). A hierarchical clustering algorithm and an improvement of the single linkage criterion to deal with noise. Expert Systems with Applications, 128: 96-108. https://doi.org/10.1016/j.eswa.2019.03.031
[33] Moseley, B., Wang, J.R. (2023). Approximation bounds for hierarchical clustering: Average linkage, bisecting K-means, and Local Search. Journal of Machine Learning Research, 24(1): 1-36.
[34] Ramos Emmendorfer, L., de Paula Canuto, A.M. (2021). A generalized average linkage criterion for Hierarchical Agglomerative Clustering. Applied Soft Computing, 100: 106990. https://doi.org/10.1016/j.asoc.2020.106990
[35] Shetty, P., Singh, S. (2021). Hierarchical clustering: A Survey. International Journal of Applied Research, 7(4): 178-181. https://doi.org/10.22271/allresearch.2021.v7.i4c.8484
[36] Sadeghi, B., Cheung, R.C.Y., Hanbury, M. (2021). Using hierarchical clustering analysis to evaluate COVID-19 pandemic preparedness and performance in 180 countries in 2020. BMJ Open, 11(11): e049844. https://doi.org/10.1136/bmjopen-2021-049844
[37] Baqir, A., ul Rehman, S., Malik, S., ul Mustafa, F., Ahmad, U. (2020). Evaluating the performance of hierarchical clustering algorithms to detect spatio-temporal crime hot-spots. In 2020 3rd International Conference on Computing, Mathematics and Engineering Technologies (iCoMET), Sukkur, Pakistan, pp. 1-5. https://doi.org/10.1109/iCoMET48670.2020.9074125
[38] Abe, R., Miyamoto, S., Endo, Y., Hamasuna, Y. (2017). Hierarchical clustering algorithms with automatic estimation of the number of clusters. In IFSA-SCIS 2017 - Joint 17th World Congress of International Fuzzy Systems Association and 9th International Conference on Soft Computing and Intelligent Systems, Otsu, Japan, pp. 1-5. https://doi.org/10.1109/IFSA-SCIS.2017.8023241
[39] Barmak, O., Manziuk, E., Krak, I. (2020). Classification based hierarchical clustering prediction variability in the ensembles of models using a statistical approach. In International Scientific and Technical Conference on Computer Science and Information Technology, Zbarazh, Ukraine, pp. 11-14. https://doi.org/10.1109/CSIT49958.2020.9322019
[40] Karlsson, J.O., Tidåker, P., Röös, E. (2022). Smaller farm size and ruminant animals are associated with increased supply of non-provisioning ecosystem services. Ambio, 51(9): 2025-2042. https://doi.org/10.1007/s13280-022-01726-y
[41] Lindberg, J.E. (2023). Nutrient and energy supply in monogastric food producing animals with reduced environmental and climatic footprint and improved gut health. International Journal of Animal Bioscience Review, 1-8. https://doi.org/10.1016/j.animal.2023.100832
[42] Wahyono, N.D., Utami, M.M.D. (2018). A review of the poultry meat production industry for food safety in indonesia. Journal of Physics Conference Series, 953(1): 4-8. https://doi.org/10.1088/1742-6596/953/1/012125
[43] Ambarwari, A., Jafar Adrian, Q., Herdiyeni, Y. (2020). Analysis of the effect of data scaling on the performance of the machine learning algorithm for plant identification. Jurnal RESTI (Rekayasa Sistem dan Teknologi Informasi), 4(1): 117-122. https://doi.org/10.29207/resti.v4i1.1517
[44] Zhang, C., Huang, W., Niu, T., Liu, Z., Li, G., Cao, D. (2023). Review of clustering technology and its application in coordinating vehicle subsystems. Automotive Innovation, 6(1): 89-115. https://doi.org/10.1007/s42154-022-00205-0
[45] Nahdliyah, M. A., Widiharih, T., Prahutama, A. (2019). K-medoids clustering method with silhouette index and c-index validation. Journal Gaussian, 8(2): 161-170. https://doi.org/10.14710/j.gauss.v8i2.26640
[46] Reinaldi, Y., Ulinnuha, N., Hafiyusholeh, M. (2021). Comparison of single linkage, complete linkage, and average linkage methods on community welfare analysis in cities and regencies in east Java. Jurnal Matematika, Statistika dan Komputasi, 18(1): 130-140. https://doi.org/10.20956/j.v18i1.14228
[47] Sinaga, K.P., Yang, M.S. (2020). Unsupervised K-means clustering algorithm. IEEE Access, 8: 80716-80727. https://doi.org/10.1109/ACCESS.2020.2988796