Wiwit Agus Triyanto*![]() | Kusworo Adi
| Kusworo Adi![]() | Jatmiko Endro Suseno
| Jatmiko Endro Suseno![]()
© 2024 The authors. This article is published by IIETA and is licensed under the CC BY 4.0 license (http://creativecommons.org/licenses/by/4.0/).
OPEN ACCESS
Lameness is one of the most serious diseases affecting chickens, which can also increase the risk of premature culling of chickens and cause huge economic losses. So far, the process of detecting chicken lameness and finding out its location is still carried out traditionally by farmers checking directly in the cage, but this can actually result in increased stress levels in the chickens. Computer vision-based approaches with deep learning have been widely used to help farm automation, but there are several things that need to be considered and are problems; these include light variables, occlusion. In this study, Faster Regions with Convolutional Neural Network (Faster R-CNN), Single Shot MultiBox Detector (SSD) and You Only Look Once (YOLO), which is a Convolutional Neural Network (CNN) network model was chosen to perform the detection, tracking, and mapping of chicken locations. YOLOv8 was combined Adam Optimizer to improve training performance. Based on the results, customized YOLOv8 has the best mAP, support, precision and F1-Score values compared to the others, with 0.922, 0.987, 0.990 and 0.988. The matrix of transformation and coordinate-to-meter conversion produces chicken locations that match real conditions, not just the position of pixel (x, y) coordinates. From the detection and tracking, the location of 1 sick (lameness) chicken and 7 healthy chickens were obtained. The results of this research can properly display the movement and position of chickens in the cage, so they can be used to monitor chicken welfare.
indoor location mapping, lameness chickens, multicamera, perspective transform, Faster Regions with Convolutional Neural Network, Single Shot MultiBox Detector, You Only Look Once, Adam optimizer
High levels of stress in chicken livestock can cause health and welfare problems for chickens such as injury or lameness, which is not in accordance with the Welfare Quality Assessment Protocol for Poultry [1]. Lameness is one of the most serious diseases affecting chickens, which can also increase the risk of premature culling of chickens and cause huge economic losses [2]. So far, the process of detecting chicken lameness and finding out its location is still carried out traditionally by farmers checking directly in the cage, but this can actually result in increased stress levels in the chickens [3]. Apart from that, this traditional method is greatly influenced by the health and mental condition of the breeder, so it takes a long time and allows errors in detection and lameness of the chicken's location. Automatic monitoring of livestock in cages offers the convenience of locating chickens [4]. The location chickens in the cage are an critical parameter that can be utilized as an sign of the welfare and health status of chickens which in the future can be used as material for the improvement and management of individuals and chicken herds.
Location-based services are currently developing very rapidly thanks to the development and application of technology based on user location information. However, reliable products for indoor locations were not found in previous studies [5]. So far, most locations use GPS, but this becomes a problem when indoors because the signal becomes weak, which makes the location less precise. As a result, indoor locations are still an important research subject to investigate. In general, indoor location mapping methods fall into two categories: fingerprint or RFID-based localization algorithms [6] and image library-based matching, which requires various image databases [7]. Although there is still a lot of research related to indoor location mapping using RFID or fingerprint-based technology, this method has several disadvantages [8] such as the cost of RFID which is not cheap, frequency signals that are easily disturbed, and loss of privacy when other people have access to the same reader. In its implementation, if the chicken tracking process is carried out en masse, it requires RFID to be installed on each chicken, while the number of chickens in the cage reaches thousands. This of course requires a lot of effort, a lot of time and of course a very large cost. However, computer vision technology can solve this problem because it only requires installing several cameras in the cage to track the chickens instead of setting up a number of RFIDs for each chicken.
Deep learning-based computer vision technology is currently developing rapidly. To solve problems in chicken coops, various deep learning-based approaches have been used. Some examples include the use of a Convolutional Neural Network (CNN) to estimate the number and density of chickens in a crowd [9], the use of a CNN with a ResNet architecture to detect unhealthy chickens [10], and the use of a CNN with an SSD architecture to identify the health status of chickens [11, 12]. Accuracy and efficiency, along with monitoring chicken behavior, are essential to determine the health and welfare of chickens [13-18]. CNN is an approach using deep learning methods specifically designed for object classification, so that it can be used for solving problems in the livestock sector [19]. The image-based localization method depends on the label tag assigned to the image, comparing the image with a database of tagged images to determine the closest and most similar match [20]. Pretrained Deep Convolutional Neural Networks can perform extraction of matching features, some researchers use SSDs to extract those matching features [21]. Conventional methods are used to detect objects, such as Viola-Jones Detector (VJ), Directional Gradient Histogram Detector (HOG), Deformable Part Based Model (DPM) [22-26]. Recent research utilizes deep convolution neural networks for faster and more accurate detection, such as the use of R-CNN, Faster R-CNN, and You Look Only Once (YOLOv1) [19, 27-29]. With a range of complex backgrounds, YOLOv8, a Deep Learning Convolutional Neural Network (CNN)-based method, can maximize item detection accuracy and speed in real time [30].
Several related studies have been carried out by researchers regarding the detection and tracking of chickens, such as detecting the location of chickens around the feed location using a tracking and detection algorithm called Faster R-CNN using a multi-angle view which in each additional frame will follow the movement of the camera. From 2000 the image data used achieved an accuracy of 89.6% when compared to human observations [31]. A study conducted an assessment of the distribution of 700 broiler chickens in cages. From the experimental results, the number of chickens that did not approach the feed area was calculated based on the number of chickens minus the total number of chickens that approached the feed area and it was found that 56% were not near the feeding route [32]. Research that detected the movement behavior of chickens around feed using the R-CNN and SVM algorithms obtained results of 92% [33]. Using real time computer vision technology to monitor the welfare of chickens in the cage using SISO modeling with root mean square results R2=0.60 [17].
Computer vision-based approaches with deep learning have been widely used to help livestock automation [34], but there are several things that need to be considered and are problems; these include light variables, occlusion, movement, and a number of other environmental factors that can influence the quality of the resulting system [35]. Apart from that, natural factors will cause actual data and experimental data to differ significantly when experimental results are applied to real-world natural settings. Several disciplines must be integrated to apply visual technologies in the field of livestock automation, and different anomalies will have a significant impact on real-world applications. It is difficult to guarantee accurate, reliable and real-time performance of related technologies [36]. Most previous studies discussing chickens have only found the location of chickens around certain feed or objects, so they could not show the location of chickens in the cage as a whole. This opens up opportunities to develop locations in poultry farms, especially chickens in cages. This research focuses on the use of convolutional neural networks (CNN) to map the location of lame chickens based on the process of tracking movements and identifying chickens in cages.
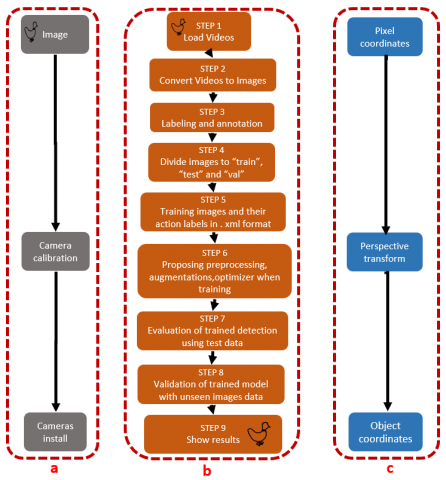
In this area, we attempt to depict the proposed strategy, the method of mapping the location of chickens in cages consists of three components, namely: preparation, detection and tracking of chickens, mapping the location of chickens. These workflow components can be described as follows:
(1) Preparatory components, used for shooting chickens by carrying out the calibration process and installation of several cameras with various positions and angles of the cage.
(2) Chicken detection and tracking components, which start from the stage of loading videos, converting video to images, labelling, divide images to training-testing-validation, proposing preprocessing, augmentations and optimizer, evaluation of trained YOLOv8, to the stage of displaying results.
(3) The component of mapping the location of chickens, estimating the position of chickens in the cage with pixel coordinate stages, perspective transform and finally displaying the coordinates of chicken objects.
The workflow of mapping the location of chickens in cages can be seen in Figure 1.
Figure 1. Overview of methods for mapping the location of chickens in cages
2.1 Dataset characteristic
The dataset was obtained from Indra Farm, which is a broiler chicken farm in Kudus City. The area of each chicken coop is 600m2 with partitions every 60m2. Sample data taken in an area of around 15m2 contained 8 chickens. The video was recorded using a Yi-Lite action Cam camera with a resolution of 1920×1080 pixels (frame width×height) and a frame rate of 29.75fps.
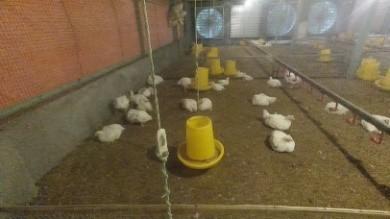
The chicken dataset was taken from video recordings of chicken activities in cages carried out with several cameras, lighting conditions, and camera angle positions were varied. The camera is installed for 24 hours to get optimal video of chicken movements, but for sample data it uses 18,000 frames. Examples of images from the video taken can be seen in Figure 2 and Figure 3.
Figure 2. Sample image from video with bright lighting
Figure 3. Example image from video with dark lighting
During the observation process, the specific behavior obtained was that healthy chickens were actively moving. Healthy chickens were busy pecking and excited when they saw the food they were given. Apart from that, healthy chickens communicate with each other, some chickens even make a lot of noise. Meanwhile, chickens that are sick or lameness show different behavior, such as losing their appetite, not even moving at all from a certain position and still appearing to be sleeping.
2.2 Multi camera
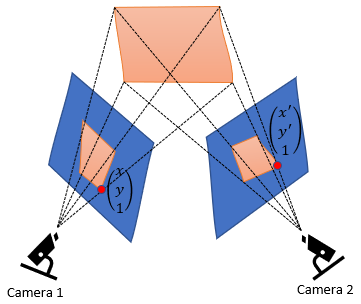
The problem of object tracking has become a popular area of research in recent times [37]. Normally, each chicken object is tracked consistently in a single video but the fact of occlusion makes this a challenge. Therefore, the proposed solution is to set up several cameras to ensure the movement of some of those objects [38].
In this research, the camera self-calibration method [39] was used. This calibration method can be performed independently of shooting the object. This method is very suitable for non-metric cameras because it can eliminate the impact of interior orientation instability of the photo. The camera's intrinsic and extrinsic parameters are required for calibration [40]. The extrinsic parameters of the camera are not related to the internal parameters, such as focal length, field of view, etc. Extrinsic parameters depend only on the location and orientation of the camera. On the other hand, the camera model's intrinsic matrix governs the images and parameters such as focal length, aperture, field of view, resolution, etc. based on the way the camera is captured. Intrinsic matrices convert points from a camera coordinate system to a pixel coordinate system, while extrinsic matrices convert points from a world coordinate system to a camera coordinate system.
Multi-camera scenarios are carried out in the cage, so occlusion can be minimized. The multi-camera calibration used indicates that there are several cameras which are then numbered 0, 1, 2. There are steps for the calibration process, namely: initialize parameters with two cameras that have a wide viewing angle selected with the first camera used for calibration and the second as a reference. Illustration of multiple cameras to take picture objects can be seen in Figure 4.
Figure 4. Multi camera
2.3 Perspective transform
Homography is the mapping between two planar surface images from different perspectives [41] or also referred to as a technique in image transformation to change one image plane of one camera into a different camera view by changing the position and rotation of each camera [42].
A simple example of homography is the use of a document scanner application, if it is noticed that the results produced by the application, no matter how the position of holding the phone, appear as if scanning documents directly from above (broad view), this is one technique on computer vision called homography (aka Perspective Transformation).
In a linear basis, an example of homography calculation with a matrix of 3×3 is as follows:
$H=\left[\begin{array}{lll}h_{00} & h_{01} & h_{02} \\ h_{10} & h_{11} & h_{12} \\ h_{20} & h_{21} & h_{22}\end{array}\right]$ (1)
If you look at the first set of corresponding points [x1, y1] and [x2, y2]. Thus, homography H maps it in the following way:
$\left[\begin{array}{c}x^1 \\ y^{\prime} \\ 1\end{array}\right]=H\left[\begin{array}{c}x 2 \\ y 2 \\ 1\end{array}\right]=\left[\begin{array}{lll}h_{00} & h_{01} & h_{02} \\ h_{10} & h_{11} & h_{12} \\ h_{20} & h_{21} & h_{22}\end{array}\right]\left[\begin{array}{c}x^2 \\ y^2 \\ 1\end{array}\right]$ (2)
There are 8 unknown parameters in projective transformation matrix and there is 1 unknown scaling coefficient w for each point. With 4 points, there are 8+4×1=12 unknowns. Each point provides 3 equations. Using 4 points, there are 12 equations for 12 unknowns.
$\left[\begin{array}{l}x^{\prime} \\ y^{\prime} \\ z^{\prime}\end{array}\right]=\left[\begin{array}{ccc}A_{00} & A_{01} & b_0 \\ A_{10} & A_{11} & b_1 \\ h_0 & h_1 & 1\end{array}\right]\left[\begin{array}{l}x \\ y \\ 1\end{array}\right]$ (3)
Or $w\left[\begin{array}{l}x^{\prime} \\ y^{\prime} \\ 1\end{array}\right]=\left[\begin{array}{ccc}A_{00} & A_{01} & b_0 \\ A_{10} & A_{11} & b_1 \\ h_0 & h_1 & 1\end{array}\right]\left[\begin{array}{l}x \\ y \\ 1\end{array}\right]$ (4)
Transformation equation for point $p_0=\left[\begin{array}{l}x_0 \\ y_0\end{array}\right]$ (5)
$w_0\left[\begin{array}{c}x_0^{\prime} \\ y_0^{\prime} \\ 1\end{array}\right]=\left[\begin{array}{ccc}A_{00} & A_{01} & b_0 \\ A_{10} & A_{11} & b_1 \\ h_0 & h_1 & 1\end{array}\right]\left[\begin{array}{c}x_0 \\ y_0 \\ 1\end{array}\right]$ (6)
Three equations for 1 point.
$w_0 x_{0^{\prime}}=A_{00} x_0+A_{01} y_0+b_0$ (7)
$w_0 y_{0^{\prime}}=A_{10} x_0+A_{11} y_0+b_1$ (8)
$w_0=h_0 x_0+h_1 y_0+1$ (9)
Grouping variables on one side.
$A_{0 Q} x_0+A_{01} y_0+b_0-w_0 x_{0^{\prime}}=0$ (10)
$A_{10} x_0+A_{11} y_0+b_1-w_0 y_{0^{\prime}}=0$ (11)
$h_0 x_0+h_1 y_0-w_0=1$ (12)
In matric-vector form,
$\left[\begin{array}{ccccccccc}x_0 & y_0 & 1 & 0 & 0 & 0 & 0 & 0 & -x_0{ }^{\prime} \\ 0 & 0 & 0 & x_0 & y_0 & 1 & 0 & 0 & -y_0 \\ 0 & 0 & 0 & 0 & 0 & 0 & x_0 & y_0 & -1\end{array}\right]=\left[\begin{array}{c}A_{00} \\ A_{01} \\ b_0 \\ A_{10} \\ A_{11} \\ b_1 \\ h_0 \\ h_1 \\ w_0\end{array}\right]\left[\begin{array}{c}0 \\ 0 \\ -1\end{array}\right]$ (13)
12 equations (4 points) in matrix-vector form.
$\left[\begin{array}{cccccccccccc}x_0 & y_0 & 1 & 0 & 0 & 0 & 0 & 0 & -x_0{ }^{\prime} & 0 & 0 & 0 \\ 0 & 0 & 0 & x_0 & y_0 & 1 & 0 & 0 & -y_0{ }^{\prime} & 0 & 0 & 0 \\ 0 & 0 & 0 & 0 & 0 & 0 & x_0 & y_0 & -1 & 0 & 0 & 0 \\ x_1 & y_1 & 1 & 0 & 0 & 0 & 0 & 0 & 0 & -x_1{ }^{\prime} & 0 & 0 \\ 0 & 0 & 0 & x_1 & y_1 & 1 & 0 & 0 & 0 & -y_1{ }^{\prime} & 0 & 0 \\ 0 & 0 & 0 & 0 & 0 & 0 & x_1 & y_1 & 0 & -1 & 0 & 0 \\ x_2 & y_2 & 1 & 0 & 0 & 0 & 0 & 0 & 0 & 0 & -x_2{ }^{\prime} & 0 \\ 0 & 0 & 0 & x_2 & y_2 & 1 & 0 & 0 & 0 & 0 & -y_2{ }^{\prime} & 0 \\ 0 & 0 & 0 & 0 & 0 & 0 & x_2 & y_2 & 0 & 0 & -1 & 0 \\ x_3 & y_3 & 1 & 0 & 0 & 0 & 0 & 0 & 0 & 0 & 0 & -x_3{ }^{\prime} \\ 0 & 0 & 0 & x_3 & y_3 & 1 & 0 & 0 & 0 & 0 & 0 & -y_3{ }^{\prime} \\ 0 & 0 & 0 & 0 & 0 & 0 & x_3 & y_3 & 0 & 0 & 0 & -1\end{array}\right]\left[\begin{array}{c}A_{00} \\ A_{01} \\ b_0 \\ A_{10} \\ A_{11} \\ b_1 \\ h_0 \\ h_1 \\ w_0 \\ w_1 \\ w_2 \\ w_2\end{array}\right]=\left[\begin{array}{c}0 \\ 0 \\ -1 \\ 0 \\ 0 \\ -1 \\ 0 \\ 0 \\ -1 \\ 0 \\ 0 \\ -1\end{array}\right]$ (14)
After computing solution, first 8 elements of the vector are kept. 4 elements last scaling coefficients are discarded and 1 is appended.
$\left[\begin{array}{c}A_{00} \\ A_{01} \\ b_0 \\ A_{10} \\ A_{11} \\ b_1 \\ h_0 \\ h_1 \\ w_0 \\ w_1 \\ w_2 \\ w_3\end{array}\right]$ 9 element vector is reshaped as $3 \times 3$ matrix $\left[\begin{array}{c}A_{00} \\ A_{01} \\ b_0 \\ A_{10} \\ A_{11} \\ b_1 \\ h_0 \\ h_1 \\ 1\end{array}\right]$ (15)
$\left[\begin{array}{ccc}A_{00} & A_{01} & b_0 \\ A_{10} & A_{11} & b_1 \\ h_0 & h_1 & 1\end{array}\right]$ (16)
$\left[\begin{array}{l}x^{\prime} \\ y^{\prime} \\ z^{\prime}\end{array}\right]=\left[\begin{array}{ccc}A_{00} & A_{01} & b_0 \\ A_{10} & A_{11} & b_1 \\ h_0 & h_1 & 1\end{array}\right]\left[\begin{array}{l}x \\ y \\ 1\end{array}\right]$ (17)
Remember when going back to cartesian coordinates x’ and y’ are divided by z’
$\frac{x^{\prime}}{z^{\prime}} \quad \frac{y^{\prime}}{z^{\prime}}$ (18)
2.4 Pre-processing and augmentations of chicken dataset
The chicken dataset automatically adjusts the image data's size, orientation, cropping, and noise reduction. The data preprocessing stage was carried out using the Python programming environment. The data was also contrast-corrected and transformed to grayscale. By doing this, the dataset is made better for analysis and a more effective model is produced.
The image is rotated, flipped, and its brightness is changed to finish the data augmentation stage after the prior data pretreatment step. Augmentation is used to increase the amount of data by making modifications to the existing chicken dataset. The purpose of this data augmentation is to add more data, which increases the final model's complexity and potential to increase accuracy.
2.5 Object detection algorithm
In the field of computer vision, object detection has developed rapidly [43]. One of the most challenging topics in the field of computer vision because it has to perform a combination of object classification and object localization. Simply put, the goal of this detection method is to find out where each object is located in an image, which is called object localization, and to put each object into a category called object classification. The three most well-known object detection algorithms are the faster R-CNN, YOLO and SSD.
A team of Microsoft researchers created the Faster R-CNN model. For object detection, Faster R-CNN is a deep convolutional network that presents to the user as a single, end-to-end, unified network. The network has the ability to swiftly and precisely anticipate the positions of various items. The networks that Faster R-CNN evolved from, R-CNN and Fast R-CNN, came first. An expansion of Fast R-CNN is called Faster R-CNN. Because of the region proposal network (RPN), quicker R-CNN performs quicker than Fast R-CNN, as its name implies [19].
Despite not having a delegated region proposal network, SSD (single shot detector) predicts boundary boxes and classes directly from feature maps in a single pass. SSD can be trained end-to-end for better accuracy. SSDs have better location coverage, scale, and aspect ratio. The model can run at real-time speed and still beat state-of-the-art Faster R-CNN accuracy by eliminating delegated region proposals and using lower resolution images [12].
YOLO is an algorithm that can detect objects in real-time by using neural network theory to learn patterns. In their famous research paper "You Only Look Once: Unified, Real-Time Object Detection", the authors frame the object detection problem as a regression detection problem (finding numerical values instead of categorical) rather than a classification task. By separating bounding boxes spatially and associating probabilities to each image detected using CoCo, the authors frame the YOLO algorithm which was first introduced in 2015. This algorithm is used to detect traffic signals, people, meters. parking, and animals because it is very accurate and fast [29].
Optimization algorithms play a key role in deep learning by facilitating neural networks' efficient learning and convergence to optimal solutions. The Adam optimizer is one of the most widely used optimization algorithms for deep neural network training, and both researchers and practitioners are still fascinated by the pursuit of optimal performance and training efficiency [44]. Adaptive moment estimation, or "Adam" optimizer, is a term for an iterative optimization process that reduces the loss function when neural networks are being trained [45].
To put it briefly, CNN has an object detection method that may be used to track and map an object's location. The three popular object identification algorithms are YOLO, SSD, and Faster R-CNN. Therefore, apart from studying the chicken dataset using the Faster R-CNN and SSD algorithms, the research also widens the reach of the Adam optimization technique which will be integrated with YOLO.
2.6 Implementation environment
In this section, deep learning analysis of tracking and mapping chicken locations with chicken data sets is implemented using a number of object detection algorithms, such as Faster R-CNN, SSD and YOLO. Using a Jupyter notebook and the sklearn packages, the Anaconda platform was utilized to program in Python [46]. Operating system: Windows 10 Pro from Microsoft CPU: 4×2.50GHz Intel(R) Core(TM) i5-7200U CPU; RAM: 12288 MB; SSD: 250 GB; GPU: 2 GB NVIDIA GeForce 940MX; These parameters were followed in the execution of every experiment.
In this study, SSD, Faster R-CNN, YOLOv8 and YOLOv8 with Adam optimizer was selected to perform detection and tracking. This stage makes the chicken object labeled into two, namely: healthy chickens and lame chickens. The learning rate for the optimizer is 0.001 with Batch size 16. The epoch was gradually added to find the best model training results, and in the 100th epoch the training results were obtained with the best accuracy value.
2.7 Evaluation method
The four metrics used by the object detection algorithm in CNN for analysis are mAP, Recall, Precision, and F1-Score. The analysis of the chicken dataset for tracking and mapping location lameness chicken in this chapter is based on experiments; four (4) advanced evaluation metrics have been selected to test the strengths and weaknesses of the CNN method technique. Mapping of the evaluation metrics is presented in this subsection.
$m A P @_\alpha=\frac{1}{n} \sum_{i=1}^n A P_i$ for $n$ classes (19)
$ precision =\frac{T P}{T P+F P}$ (20)
$recall =\frac{T P}{T P+F N}$ (21)
$F 1=2 * \frac{1}{\frac{1}{ precison }+\frac{1}{recall}}$ (22)
Using the chicken dataset, the CNN model for detection and tracking lameness chicken was effectively implemented following experimental testing. This section presents the findings and a discussion of the experimental analysis of the study's chicken dataset. The four standard metrics mAP, F1-score, precision, and recall that are used to assess the chicken dataset in this study are presented in detail in this section. SSD, YOLO, and Faster R-CNN are the deep learning-based detection techniques that are assessed and explored. Additionally, YOLO and the Adam optimizer method will be integrated.
3.1 Results
The evaluation outcomes are predicated on the most advanced performance metrics available for deep learning in general; these metrics include mAP, precision, F1 score, and recall [47]. For each of the four evaluation methods that were employed, all experimental parameters were left at their default settings. A suitable, pre-trained chicken dataset. A comparison of the outcomes of three distinct object detection methods using the chicken dataset is provided, as was previously covered in Section 2. All other performance measures have values between 0 and 1. The strategy is better as the metric value approaches 1. The performance analysis of the CNN approach for object detection on the chicken dataset in this work is presented in Table 1.
Table 1. Performance analysis of object detection algorithm on chicken dataset
|
Methods |
Faster R-CNN |
SSD |
YOLOv8 |
YOLOv8 Custom |
|
mAP |
0.897 |
0.845 |
0.914 |
0.922 |
|
Precision |
0.918 |
0.856 |
0.968 |
0.987 |
|
Recall |
0.892 |
0.827 |
0.953 |
0.990 |
|
F1-Score |
0.905 |
0.841 |
0.960 |
0.988 |
Figure 5. Perspective transform for indoor location mapping
Perspective transform is a very useful feature when synchronizing images. The perspective transform process begins with knowing the coordinates (x, y) of the pixel from the source, which will then be transformed according to the coordinates (x, y) of the destination pixel. Broadly speaking, the perspective transform process can be seen in Figure 5.
From the image example above, it is known that the coordinates (x, y) of the image source pixel are [[760, 434], [1200, 424], [380, 1064], [1900, 1064]], while for the coordinates (x, y) of the image destination pixel is [[0, 0], [1920, 0], [0, 1080], [1920, 1080]]. Based on the values of the source and destination coordinates, the resulting transformation matrix is as follows:
$\left[\begin{array}{ccc}-5.9203594805 & -3.5710104803 & 6049.2917536526 \\ -0.1753952653 & -7.7173916721 & 3482.6483873065 \\ -0.000162403 & -0.0050548736 & 1\end{array}\right]$ (23)
To calculate the coordinate location after perspective transform, the source pixel value is multiplied by the matrix transformation as follows: for example, the pixel coordinates of a sick chicken object are [836.742], then:
Step 1-The transformation matrix is multiplied by the value of the (x, y) coordinate pixels as follows:
$\begin{gathered}{\left[\begin{array}{ccc}-5.9203594805 & -3.5710104803 & 6049.2917536526 \\ -0.1753952653 & -7.7173916721 & 3482.6483873065 \\ -0.000162403 & -0.0050548736 & 1\end{array}\right] \times} {\left[\begin{array}{c}836 \\ 742 \\ 1\end{array}\right]=\left[\begin{array}{cc}-1549.818548 \\ -2390.286675 \\ -2.886485119\end{array}\right]}\end{gathered}$ (24)
Step 2-The value obtained from the first two rows is divided by the third row so that it is obtained (x, y) as given below:
$\begin{gathered}{[1549.818548 /-2.886485119,-2390.286675 /-2.886485119]} \\ =[536,922,828,096]\end{gathered}$ (25)
Step 3-Convert the value of the destination coordinate into real size / meter scale by doing a scale, the length of the X coordinate [0.1920] is equal to 3 meters, while the length of the Y coordinate [0.1080] is equal to 5 meters.
Table 2. Matrix transformation and conversion to meters
|
No. |
Label |
Source [x, y] |
Destination [x, y] |
Real [x, y] Meter |
|
1 |
Sick (lameness) chickens |
[836,742] |
[536.922, 828.096] |
[0.839, 3.834] |
|
2 |
Healthy Chickens |
[918,855] |
[702.625, 944.031] |
[1.098, 4.371] |
|
3 |
Healthy Chickens |
[1183,872] |
[1130.124, 959.566] |
[1.766, 4.442] |
|
4 |
Healthy Chickens |
[1054,894] |
[916.813, 975.973] |
[1.433, 4.518] |
|
5 |
Healthy Chickens |
[1098,993] |
[952.229, 1041.807] |
[1.488, 4.823] |
|
6 |
Healthy Chickens |
[925,1015] |
[712.841, 1054.153] |
[1.114, 4.880] |
|
7 |
Healthy Chickens |
[1368,1021] |
[1299.455, 1057.847] |
[2.030, 4.897] |
|
8 |
Healthy Chickens |
[1493,993] |
[1486.598, 1042.382] |
[2.323, 4.826] |
From the process of matrix transformation and conversion of coordinates into meters, resulting in the location of the position of the chicken in the cage as shown in Table 2.
3.2 Discussion
To make sure the developed model can investigate the issue of detecting, tracking, and mapping lameness in chickens, an evaluation matrix is required. Figure 6 illustrates this evaluation of the model using the F1-score, recall, maAP, and precision values.
Figure 6. Lameness chicken detection using a confusion matrix
Specific details:
TP: True Positive, meaning that the offense is both anticipated and actual.
FP: False Positive; a violation is anticipated but not actually occurred.
FN: False Negative; although the infraction is expected to exist, it does.
TN: True Negative; no infraction is demonstrated, as is anticipated.
The data set is separated into three sections: test sets for model evaluation, training and validation sets for model training. The test data set is constructed with items the model has never seen before, which serves as a measure of the model's generalization capabilities, even though several objects are used to create the training and validation data sets. In actual use, a single object can be used to train the model, which produces excellent occlusion resolution performance with that particular object but poor applicability to other objects. In this study, we used a restricted amount of photos (12,600 for training, 3,600 for validation, and 1,800 for testing) involving two types of objects, namely lame chickens and healthy chickens to get good performance.
This performance is deemed sufficient for resolving occlusion in tracking scenarios. Top performance can be obtained by retraining the model with a larger corpus of photos or optimizing specificity by training with a single object type, all made possible by a streamlined workflow. In order to improve the model's comprehension of perspective, it also entails adding a dataset with a varied background and changing the scale of the top or bottom object. Moreover, enhancing edges in images through sharpening has been successful in resolving occlusion issues.
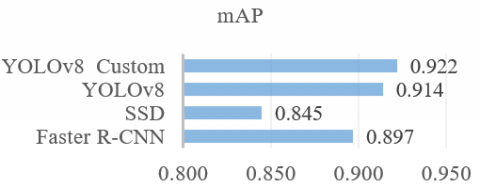
3.2.1 mAP
The mAP of the object identification algorithm utilizing the chicken dataset from this study is shown in Figure 7, with values of 0.897, 0.845, 0.914, and 0.922 for Faster R-CNN, SSD, YOLOv8, and YOLOv8 Custom, respectively. Since the optimal approach is the one with a rate that is closer to 1. For this reason, YOLOv8 Custom is superior to the others.
Figure 7. CNN model detection chicken dataset mAP
3.2.2 Precision
The precision of the object identification algorithm utilizing the chicken dataset from this study is shown in Figure 8, with values of 0.918, 0.856, 0.968 and 0.987 for Faster R-CNN, SSD, YOLOv8, and YOLOv8 Custom, respectively. Since the optimal approach is the one with a rate that is closer to 1. For this reason, YOLOv8 Custom is superior to the others.
Figure 8. CNN model detection chicken dataset precision
3.2.3 Recall
The recall of the object identification algorithm utilizing the chicken dataset from this study is shown in Figure 9, with values of 0.892, 0.827, 0.953 and 0.990 for Faster R-CNN, SSD, YOLOv8, and YOLOv8 Custom, respectively. Since the optimal approach is the one with a rate that is closer to 1. For this reason, YOLOv8 Custom is superior to the others.
Figure 9. CNN model detection chicken dataset recall
Figure 10. CNN model detection chicken dataset F1-Score
3.2.4 F1-Score
The F1-Score of the object identification algorithm utilizing the chicken dataset from this study is shown in Figure 10, with values of 0.905, 0.841, 0.960 and 0.988 for Faster R-CNN, SSD, YOLOv8, and YOLOv8 Custom, respectively. Since the optimal approach is the one with a rate that is closer to 1. For this reason, YOLOv8 Custom is superior to the others.
From the results of this research, it can be seen that the YOLOv8 method with a combination of Adam Optimizer is able to properly detect chicken objects in the cage, and track the chicken's movements, so that mapping of the chicken's location can be carried out. In precision farming, mapping the location of chickens that are healthy or not can help farmers identify unhealthy chickens quickly and easily compared to traditional monitoring. Detecting, tracking and mapping the location of chickens in the cage using computer vision-based technology can save costs and time for manual monitoring, and can reduce detection errors caused by human error. By knowing the unhealthy condition of chickens, you can avoid mass deaths of chickens in cages, which will have an impact on losses in the production process on chicken farms.
Faster R-CNN, SSD and YOLOv8 can be used to object detection of lameness chicken objects well, but from the various object detection algorithms, YOLOv8 with combinations of Adam optimizer algorithms as well as several preprocessing and augmentation configurations, as the best mAP, support, precision and F1-Score values compared to the others. The matrix of transformation and coordinate-to-meter conversion produces chicken locations that match real conditions, not just the position of pixel (x, y) coordinates. From the detection and tracking of 8 chickens in the cage divider, the location of 1 sick (lameness) chicken and 7 healthy chickens were obtained.
High evaluation results help farmers avoid errors and mistakes as well as delays in detecting chickens, such as during traditional monitoring, errors in the detection process result in chickens already dying which can have an impact on the welfare of other chickens, this can lead to the risk of mass chicken deaths in the cage. Computer vision technology, which does not directly observe and touch the chickens one by one, can speed up the detection process over a large area, thereby saving time and costs, this can of course increase the production of chicken farms. To improve the system's performance in dealing with occlusion and different lighting levels, in training, adding data sets with varying backgrounds and changing the scale of objects up or down, as well as increasing image edges through sharpening have succeeded in overcoming the occlusion problem. From this system, different chicken behavior can be detected well, both when the chicken is actively moving or staying in a place for a long time which can indicate that the chicken is unhealthy.
The results of this study can display the movement and position of the location of chickens in the cage, so that it can be used as a monitoring of chicken welfare. The automated detection, tracking and mapping process based on computer vision, in the future, can provide an alternative change in traditional monitoring of livestock activity. This is clearly because computer vision-based technology has advantages, including being faster, simpler to use, reducing detection errors, and of course save costs.
|
CNN |
convolutional neural networks |
|
HOG |
histogram of oriented gradients |
|
RFID |
radio frequency identification |
|
R-CNN |
regions with convolutional neural networks |
|
SSD |
single shot multibox detector |
|
SHOT |
stacked homography transformations |
|
SVM |
support vector machine |
|
VJ |
viola-jones detector |
|
YOLO |
you only look once |
|
Greek symbols |
|
|
Α, b |
parameter of projective transformation matrix |
|
H |
matrix homography |
|
h |
parameter of a matrix homography |
|
p |
point coordinates |
|
w |
scaling coefficient |
|
x |
horizontal axis |
|
y |
vertical axis |
|
z |
3D cartesian axis |
[1] De Jong, I.C., Hindle, V.A., Butterworth, A., Engel, B., Ferrari, P., Gunnink, H., Perez Moya, T., Tuyttens, F.A.M., Van Reenen, C G. (2016). Simplifying the Welfare Quality® assessment protocol for broiler chicken welfare. Animal, 10(1): 117-127. http://doi.org/10.1017/S1751731115001706
[2] Wu, D.H., Wu, Q., Yin, X.Q., Jiang, B., Wang, H., He, D.J., Song, H.B. (2020). Lameness detection of dairy cows based on the YOLOv3 deep learning algorithm and a relative step size characteristic vector. Biosystems Engineering, 189: 150-163. http://doi.org/10.1016/j.biosystemseng.2019.11.017
[3] Okinda, C., Nyalala, I., Korohou, T., Okinda, C., Wang, J.T., Achieng, T., Wamalwa, P., Mang, T., Shen, M.X. (2020). A review on computer vision systems in monitoring of poultry: A welfare perspective. Artificial Intelligence in Agriculture, 4: 184-208. http://doi.org/10.1016/j.aiia.2020.09.002
[4] Chapa, J.M., Lidauer, L., Steininger, A., Öhlschuster, M., Potrusil, T., Sigler, M., Auer, W., Azizzadeh, M., Drillich, M., Iwersen, M. (2021). Use of a real-time location system to detect cows in distinct functional areas within a barn. JDS Communication, 2(4): 217-222. http://doi.org/10.3168/jdsc.2020-0050
[5] Wu, D.W., Chen, R.Z., Yu, Y., Zheng, X.Y., Xu, Y., Liu, Z.Y. (2022). Indoor passive visual positioning by CNN-based pedestrian detection. Micromachines, 13(9): 1413. http://doi.org/10.3390/mi13091413
[6] Liu, J.B., Chen, R.Z., Pei, L., Guinness, R., Kuusniemi, H. (2012). A hybrid smartphone indoor positioning solution for mobile LBS. Sensors, 12(12): 17208-17233. http://doi.org/10.3390/s121217208
[7] Chen, Y.J., Chen, R.Z., Liu, M.Y., Xiao, A.R., Wu, D.W., Zhao, S.H. (2018). Indoor visual positioning aided by CNN-based image retrieval: TRAINING-free, 3D modeling-free. Sensors, 18(8): 2692. http://doi.org/10.3390/s18082692
[8] Stadig, L.M., Ampe, B., Rodenburg, T.B., Reubens, B., Maselyne, J., Zhuang, S., Criel, J., Tuyttens, F.A.M. (2018). An automated positioning system for monitoring chickens’ location: Accuracy and registration success in a free-range area. Applied Animal Behaviour Science, 201: 31-39. http://doi.org/10.1016/j.applanim.2017.12.010
[9] Fang, C., Huang, J.D., Cuan, K.X., Zhuang, X.L., Zhang, T.M. (2020). Comparative study on poultry target tracking algorithms based on a deep regression network. Biosystems Engineering, 190: 176-183. http://doi.org/10.1016/j.biosystemseng.2019.12.002
[10] Zhang, H.Y., Chen, C.X. (2020). Design of sick chicken automatic detection system based on improved residual network. In Proceedings of 2020 IEEE 4th Information Technology, Networking, Electronic and Automation Control Conference (ITNEC 2020), Chongqing, China, pp. 2480-2485. http://doi.org/10.1109/ITNEC48623.2020.9084666
[11] Zhuang, X.L., Zhang, T.M. (2019). Detection of sick broilers by digital image processing and deep learning. Biosystems Engineering, 179: 106-116. http://doi.org/10.1016/j.biosystemseng.2019.01.003
[12] Liu, W., Anguelov, D., Erhan, D., Szegedy, C., Reed, S., Fu, C.Y., Berg, A.C. (2016). SSD: Single shot multibox detector. In Computer Vision – ECCV 2016, Springer, Cham, pp. 21-37. http://doi.org/10.1007/978-3-319-46448-0_2
[13] Ammad-Uddin, M., Ayaz, M., Aggoune, E.H., Sajjad, M. (2014). Wireless sensor network: A complete solution for poultry farming. In Proceedings of the 2014 IEEE 2nd International Symposium on Telecommunication Technologies (ISTT), Langkawi, Malaysia, 2014, pp. 321-325. http://doi.org/10.1109/ISTT.2014.7238228
[14] Chao, K., Kim, M.S., Chan, D.E. (2014). Control interface and tracking control system for automated poultry inspection. Computer Standards & Interfaces, 36(2): 271-277. http://doi.org/10.1016/j.csi.2011.03.006
[15] Neves, D.P., Mehdizadeh, S.A., Santana, M.R., Amadori, M.S., Banhazi, T.M., Nääs, I. de A. (2019). Young broiler feeding kinematic analysis as a function of the feed type. Animals, 9(12): 1149. http://doi.org/10.3390/ani9121149
[16] Novas, R.V., Usberti, F.L. (2017). Live monitoring in poultry houses: A broiler detection approach. In Proceedings of the 2017 30th SIBGRAPI Conference on Graphics, Patterns and Images (SIBGRAPI), Niteroi, Brazil, 2017, pp. 216-222. http://doi.org/10.1109/SIBGRAPI.2017.35
[17] Peña Fernández, A., Norton, T., Tullo, E., van Hertem, T., Youssef, A., Exadaktylos, V., Vranken, E., Guarino, M., Berckmans, D. (2018). Real-time monitoring of broiler flock’s welfare status using camera-based technology. Biosystems Engineering, 173: 103-114. http://doi.org/10.1016/j.biosystemseng.2018.05.008
[18] Pereira, D.F., Miyamoto, B.C.B., Maia, G.D.N., Sales, G.T., Magalhães, M.M., Gates, R.S. (2013). Machine vision to identify broiler breeder behavior. Computers and Electronics in Agriculture, 99: 194-199. http://doi.org/10.1016/j.compag.2013.09.012
[19] Ren, S., He, K., Girshick, R., Sun, J. (2017). Faster R-CNN: Towards real-time object detection with region proposal networks. IEEE Transactions on Pattern Analysis and Machine Intelligence, 39(6): 1137-1149. http://doi.org/10.1109/TPAMI.2016.2577031
[20] Jung, T.W., Jeong, C.S., Kwon, S.C., Jung, K.D. (2021). Point-graph neural network based novel visual positioning system for indoor navigation. Applied Sciences, 11(19): 9187. http://doi.org/10.3390/app11199187Y
[21] Meng, Y., Lin, K.J., Tsai, B.L., Chuang, C.C., Cao, Y., Zhang, B. (2020). Visual-based localization using pictorial planar objects in indoor environment. Applied Sciences, 10(23): 8583. http://doi.org/10.3390/app10238583.
[22] Zou, Z.X., Chen, K.Y., Shi, Z.W., Guo, Y.H., Ye, J.P. (2023). Object detection in 20 years: A Survey. Proceedings of the IEEE, 111(3): 257-276. http://doi.org/10.1109/JPROC.2023.3238524
[23] Viola, P., Jones, M. (2001). Rapid object detection using a boosted cascade of simple features. In Proceedings of the 2001 IEEE Computer Society Conference on Computer Vision and Pattern Recognition. CVPR 2001, HI, USA, pp. 511-518. http://doi.org/10.1109/CVPR.2001.990517
[24] Dalal, N., Triggs, B. (2005). Histograms of oriented gradients for human detection. In 2005 IEEE Computer Society Conference on Computer Vision and Pattern Recognition (CVPR’05), San Diego, CA, USA, pp. 886-893. http://doi.org/10.1109/CVPR.2005.177
[25] Felzenszwalb, P., McAllester, D., Ramanan, D. (2008). A discriminatively trained, multiscale, deformable part model. In 2008 IEEE Conference on Computer Vision and Pattern Recognition, Anchorage, AK, USA, pp. 1-8. http://doi.org/10.1109/CVPR.2008.4587597.
[26] Forsyth, D. (2014). Object detection with discriminatively trained part-based models. Computer, 47(2): 6. http://doi.org/10.1109/MC.2014.42
[27] Girshick, R., Donahue, J., Darrell, T., Malik, J. (2014). Rich feature hierarchies for accurate object detection and semantic segmentation. In 2014 IEEE Conference on Computer Vision and Pattern Recognition, Columbus, OH, USA, pp. 580-587. http://doi.org/10.1109/CVPR.2014.81
[28] Girshick, R. (2015). Fast R-CNN. In 2015 IEEE International Conference on Computer Vision (ICCV), Santiago, Chile, pp. 1440-1448. http://doi.org/10.1109/ICCV.2015.169
[29] Redmon, J., Divvala, S., Girshick, R., Farhadi, A. (2016). You only look once: unified, real-time object detection. In 2016 IEEE Conference on Computer Vision and Pattern Recognition (CVPR), Vegas, NV, USA, pp. 779-788. http://doi.org/10.1109/CVPR.2016.91
[30] Neethirajan, S. (2022). ChickTrack – A quantitative tracking tool for measuring chicken activity. Measurement, 191: 110819. http://doi.org/10.1016/j.measurement.2022.110819
[31] Geffen, O., Yitzhaky, Y., Barchilon, N., Druyan, S., Halachmi, I. (2020). A machine vision system to detect and count laying hens in battery cages. Animal, 14(12), 2628-2634. http://doi.org/10.1017/S1751731120001676
[32] Aldridge, D.J., Kidd, M.T., Scanes, C.G. (2021). Eating, drinking and locations of broiler chickens reared under commercial conditions with supplementary feeder line lighting. Journal of Applied Poultry Research, 30(3): 100167. http://doi.org/10.1016/j.japr.2021.100167
[33] Li, G.M., Hui, X., Chen, Z.Q., Chesser, G.D., Zhao, Y. (2021). Development and evaluation of a method to detect broilers continuously walking around feeder as an indication of restricted feeding behaviors. Computers and Electronics in Agriculture, 181: 105982. http://doi.org/10.1016/j.compag.2020.105982
[34] Lamping, C., Kootstra, G., Derks, M. (2023). Uncertainty estimation for deep neural networks to improve the assessment of plumage conditions of chickens. Smart Agricultural Technology, 5: 100308. http://doi.org/10.1016/j.atech.2023.100308
[35] Gawlikowski, J., Njieutcheu Tassi, C.R., Ali, M., Lee, J., Humt, M., Feng, J., Kruspe, A., Triebel, R., Jung, P., Roscher, R., Shahzad, M., Yang, W., Bamler, R., Zhu, X.X. (2023). A survey of uncertainty in deep neural networks. Artificial Intelligence Review, 56(S1): 1513. http://doi.org/10.1007/s10462-023-10562-9
[36] Tian, H.K., Wang, T.H., Liu, Y.D., Qiao, X., Li, Y.Z. (2020). Computer vision technology in agricultural automation—A review. Information Processing in Agriculture, 7(1): 1-19. http://doi.org/10.1016/j.inpa.2019.09.006
[37] Stadler, D., Beyerer, J. (2021). Improving multiple pedestrian tracking by track management and occlusion handling. In IEEE/CVF Conference on Computer Vision and Pattern Recognition (CVPR), Nashville, TN, USA, pp. 10953-10962. http://doi.org/10.1109/CVPR46437.2021.01081
[38] Liu, J.L., Shi, X.B. (2021). Research on person reidentification method fusing direction information in multi-camera pedestrian tracking problem. Journal of Physics: Conference Series, 1871(1): 012068. http://doi.org/10.1088/1742-6596/1871/1/012068
[39] Xu, X.C., Liu, M.Y., Peng, S., Ma, Y.Q., Zhao, H.X., Xu, A.G. (2022). An in-orbit stereo navigation camera self-calibration method for planetary rovers with multiple constraints. Remote Sensing, 14(2): 402. http://doi.org/10.3390/rs14020402
[40] Guo, K., Ye, H., Gu, J.H., Chen, H.L. (2021). A novel method for intrinsic and extrinsic parameters estimation by solving perspective-three-point problem with known camera position. Applied Sciences, 11(13): 6014. http://doi.org/10.3390/app11136014
[41] Nguyen, T., Chen, S.W., Shivakumar, S.S., Taylor, C.J., Kumar, V. (2018). Unsupervised deep homography: A fast and robust homography estimation model. IEEE Robotics and Automation Letters, 3(3): 2346-2353. http://doi.org/10.1109/LRA.2018.2809549
[42] Williem, J.S., Wongso, R. (2021). Deep correlation based homography estimation for image stitching. In ICIC Express Letters, 15(9): 1007-1012. http://doi.org/10.24507/icicel.15.09.1007
[43] Boukabous M., Azizi, M. (2023). Image and video-based crime prediction using object detection and deep learning. Bulletin of Electrical Engineering and Informatics, 12(3): 1630-1638. http://doi.org/10.11591/eei.v12i3.5157
[44] Chowdhury, Y.S., Dasgupta, R., Nanda, S. (2021). Analysis of various optimizer on CNN model in the application of pneumonia detection. In 2021 3rd International Conference on Signal Processing and Communication, ICPSC 2021, Coimbatore, India, pp. 417-421. http://doi.org/10.1109/ICSPC51351.2021.9451768
[45] Yaqub, M., Feng, J., Zia, M.S., Arshid, K., Jia, K., Rehman, Z.U., Mehmood, A. (2020). State-of-the-art CNN optimizer for brain tumor segmentation in magnetic resonance images. Brain Sciences, 10(7): 427. http://doi.org/10.3390/brainsci10070427
[46] Ajagbe, S.A., Adegun, A.A., Olanrewaju, A.B., Oladosu, J.B., Adigun, M.O. (2023). Performance investigation of two-stage detection techniques using traffic light detection dataset. IAES International Journal of Artificial Intelligence, 12(4): 1909-1919. http://doi.org/10.11591/ijai.v12.i4.pp1909-1919
[47] Patel, S., Patel, A. (2018). Deep leaning architectures and its applications a survey. International Journal of Computer Sciences and Engineering, 6(6): 1177-1183. http://doi.org/10.26438/ijcse/v6i6.11771183