Husam Noman Mohammed Ali*![]() | Nahla Ali Tomah
| Nahla Ali Tomah![]() | Aghssan Mohammed Nwehil
| Aghssan Mohammed Nwehil![]()
© 2024 The authors. This article is published by IIETA and is licensed under the CC BY 4.0 license (http://creativecommons.org/licenses/by/4.0/).
OPEN ACCESS
Visible light communication (VLC) is one of the fastest wireless communication systems compatible with 5G and beyond. Therefore, it was necessary to employ rapid modulation systems compatible with intensity modulation / direct detection (IM / DD), such as Flip-FBMC modulation technology. The distribution of illumination units across the entirety of the room poses the greatest difficulty for the VLC distribution system. Previous models suffered from dark spots or blind spots in the center of the room, which is the user's mobility area, as well as high power consumption, which is one of the most influential factors influencing the system. This is the first instance in which the illumination units are distributed in new locations by five lights installed in the ceiling in order to eradicate dark spots by using a laser diode (LD) instead of an LED due to its high-intensity illumination. The optimal semi-angle and field of view were calculated to be 43o and 45o, respectively, in order to obtain the best results in terms of the received optical power and the preferred performance of the SNR distribution in comparison to the previous models, as well as to improve the power consumption of the illumination units. using the optimal values of the semi-angle at 43° and FOV at 45°, the current findings indicate that Model 3 also attained the highest optical power received and the best SNR distribution performance compared to the previous models. In this way, a complete illuminate distribution is obtained for the room.
visible light communication, laser diode, LED, illumination, optical power
Communication bottlenecks, especially in indoor environments, occur; approximately 70% of communications take place inside rooms and offices. Besides, the great development in portable devices increases the demand for data, and this puts narrow-spectrum RF communications in a challenging position. Also, this gave an incentive to find an alternative system for it in optical wireless communications (OWC) and the best alternative to it in visible light communications (VLC) because of its advantages [1, 2]. Such as having an unlicensed spectrum characterized by large bandwidth, high security, and harmlessness, besides the great development in lighting systems that used solid-state optical semiconductors, whether LED or laser diode (LD) [3, 4], due to its on-off frequency speed without being noticed by the eye.
In order to provide acceptable communication performance for the rapid growth in communication systems and applications, SNR and power must be improved, along with the transmission rate. Also, modulation systems in the VLC system must be characterized by speed and a large bandwidth. Therefore, the most efficient modulation techniques are used, such as OFDM modulation technology, which gives acceptable spectral efficiency. But this technique has disadvantages due to the presence of CP [5, 6], which reduces the bandwidth. Besides the large side lobes, which lead to leakage in spectral efficiency, FBMC modulation technology was used, which is characterized by large bandwidth and high spectral efficiency. In addition, Hermitian symmetry is not used to obtain a real signal [7]. FBMC modulation technology is the most efficient modulation technique in the VLC system [6-8].
The VLC system can be divided into three main parts, which are the optical transmitter, the transmitter channel, and the optical receiver [9]. The optical channel is very important to the performance of the VLC system, as the transmission channel is modeled so that the illumination distribution is uniform [10, 11]. The performance of the system is analyzed based on the received power and the SNR; however, the optimal positions for the lighting units were not given, as the relationship between the planning of the lighting units and the received power was studied. The illumination tool is utilized in an indoor environment to accommodate numerous users. Optical networks define this type of network [12, 13]. Furthermore, the dimensions of the illumination unit are made of LED chips with dimensions of 60×60, where the gap is a chip and the other is about 1 cm. Most conventional scenarios in a typical room measuring 5×5×3 m3 are carried out [1].
In most studies, typical room models are modeled using four lighting units centered at the corners [9], in addition to some studies using 16 square-shaped lighting units, while the last studies used five lighting units [14], and all previous studies aimed at optimal lighting distribution in the typical room and better performance. Previous research neglected an important point, that it was the center of the room, known as a cold spot, that is, relatively dark, and thus the distribution of internal lighting is not proportional to the room.
In the current study, a scenario involving five illumination units was modelled for the first-time using LD with novel positions to obtain an optimal level of illumination distribution by locating an optimal semi-angle and an optimal FOV to achieve the best optical power distribution in a typical room. According to the authors' knowledge, this is the first instance in which the illumination units are distributed in new locations by five lights installed in the ceiling in order to eradicate dark spots by using a laser diode (LD) instead of an LED.
The system modelling process can be explained in stages as follows:
2.1 Modelling of the room and LD placements
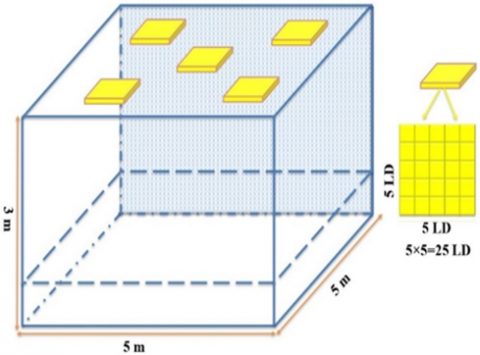
In this sub-section, the authors presented the proposed configuration of the illumination units applied in a typical room with dimensions of 5×5×3 m3 [15]. The proposed lighting units are also installed in the ceiling, as the dimensions of the LD unit are shown in Figure 1, while the indoor area space is divided into five networks to cover the indoor room. The previous configurations with four illumination units, it was noticed in this model that the distribution of lighting units on the corners of the room with equal dimensions and provides good lighting, but the middle of the room was vanished, which generated a small semi-dark lighting area called the cold zone [1-9], as well as 16 illumination units, are insufficient to provide large cellular coverage. The lighting units were distributed along the edges of the room without paying attention to the distribution of lighting in the middle of the room [14], as it is noticed that the power distribution drops in the center of the room, the receiver power is high, and the SNR is low. In addition, the proposed model consumes less power compared to previous studies. The height of the illumination units above the level of the optical receiving is 2.15m; in addition to that, each lighting unit contains 25 LD, where the transmitted power is 50 W, with a central lighting intensity of 162 cd.
Figure 1. Proposed illumination with LD distribution scenario at ceiling
2.2 Light propagation
The engineering model for the configuration of the proposed LD illumination units is shown in Figure 2, as the LOS condition for illumination and communication was considered in this paper [16]. The luminance intensity can be expressed as follows:
$I_\phi=I_o \cos ^m(\phi)$ (1)
where, m is the Lambertian order which can be found by the semi-angle of illumination as follows:
$m=-l n_2 / \ln \left(\cos \psi_c\right)$ (2)
Figure 2. Geometrical system model
The horizontal illumination at a distance of d can be given as follows:
$E_{h o r}=\frac{I_o \cos ^m(\phi)}{d^2} \cos (\psi)$ (3)
The LOS path's channel DC gain is provided as:
$H_o=\left\{\frac{(m+1) A}{2 \pi d^2} \cos ^m(\phi) T_s(\psi) g(\psi) \cos \left(\psi_c\right), 0 \leq \psi \leq \psi_c\right.$ (4)
where, A is the active area of the photodetector, while ψ is the incidence angle, Ts is the gain of the optical filter, g(ψ) is the gain of the concentrator, and ψc is refers to FOV at receiver. The concentrate gain is determined as in Eq. (5) where n is the refractive index of lens.
$g(\psi)=\left\{\frac{n^2}{\sin ^2\left(\psi_c\right)}, 0 \leq \psi \leq \psi_c\right.$ (5)
whereas, the optical power received at the photodetector can be found as follows.
$P_r=H_o \times P_c$ (6)
The expression of the consumed power of lighting units [17], which is an important parameter of the system:
$P_c=\left[\begin{array}{ccc}K_1 & \cdots & K_2 \\ \vdots & K_5 & \vdots \\ K_3 & \cdots & K_4\end{array}\right] \times P_t$ (7)
whereas, Pc and Pt represent the consumed power and the transmitted power, respectively, while K represents the number of LD in the lighting unit. The LD power is 2W.
2.3 VLC signal to noise ratio (SNR)
The communication quality is highly proportional to the SNR in VLC systems where the SNR is expressed as follows:
$S N R=\frac{R^2 P_{r s i g}^2}{\sigma_{\text {shot }}^2+\sigma_{\text {therm }}^2}$ (8)
where, $R$ is the responsivity of the optical detector, while $P_{r s i g}$ describes the signal power and $\sigma_{\text {shot }}$, and $\sigma_{\text {thermal }}$ is the shot noise and thermal noise, respectively, expressed in Eqs. (9) and (10). All parameters defined in Table 1 .
$\sigma_{s h o t}^2=2 q\left[R P_r+I_{b g} I_2\right] B$ (9)
$\sigma_{\text {thermal }}^2=8 \pi k T_k \eta A B^2\left(\frac{I_2}{G}+\frac{2 \Gamma \pi}{g_m} \eta A I_3 B\right)$ (10)
Table 1. Simulation characteristics
|
Parameters |
Values |
|
Room dimension (L×W×H) |
5×5×3 m3 |
|
LD array |
5×5 |
|
LD power (Pt) |
2W |
|
Irradiance intensity (I0) |
162 cd |
|
detector physical area (A) |
1cm2 |
|
Gain of optical filter (Ts) |
1 |
|
Refractive index (n) |
1.5 |
|
Field of View (FOV) |
35-70 |
|
Semi-angle at half power |
10ــ 80 |
|
Speed of light (c) |
3×10⁸ m/s |
|
Electronic charge (q) |
1.602×10⁻¹⁹ c |
|
Data rate |
30Mb/s |
|
Noise bandwidth factor(I2) |
0.562 |
|
Noise bandwidth factor(I3) |
0.0868 |
|
Boltzmann’s constant(k) |
1.38066 e-23 |
|
Absolute temperature (Tk) |
295[K] |
|
Open-loop voltage gain (G) |
10 |
|
FET channel noise factor (Γ) |
1.5 |
|
background light current (Ibg) |
5100e-6 |
|
Fixed capacitance (η) |
112[pF/cm2] |
|
Responsivity of photodetector (ℜ) |
0.4 A/W |
In this paper, the simulation is conducted to reach the best performance of the VLC system in terms of illumination distribution for the proposed scenario, besides finding an optimal semi-angle and optimum FOV to obtain the best optical power distribution and better SNR performance. As mentioned earlier, all parameters used in simulating the proposed scenario are given in Table 1.
3.1 Illumination distribution in the typical room
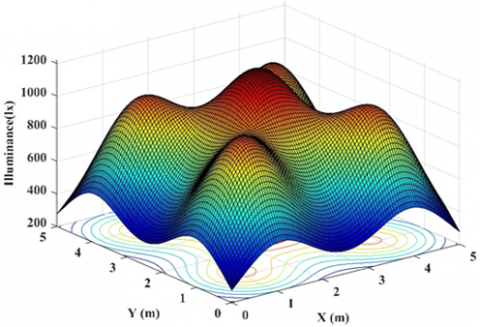
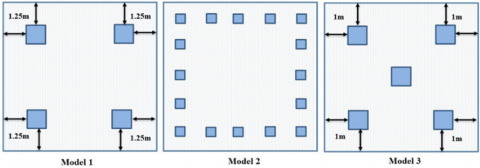
Figure 3 shows the horizontal illumination of the Model 3 at the locations of the new lighting units as follows: (1,1,3), (1,4,3), (4,4,3), (4,1,3), and (2.5,2.5,3). It was observed in Figure 4 that it gives a light distribution over the indoor area of the typical room. On the other hand, the previous scenarios suffered from some dark spots, especially in the middle of the room, which is considered the users' movement area. Figure 4 also illustrated the geometric distribution of the lighting units in the typical room for previous models, as Model 1 is the classic model and the composition of the lighting units contains 3600 LEDs. in addition to the lighting distribution that does not cover the middle of the room and consumes additional power, while in Model 2, the geometric distribution of units made a gap in the middle of the room, and this shows the weak distribution of lighting and neglect of the room's middle. Model 1 and this model are closer to the proposed model, as is Model 3, which is the proposed model where LD was used instead of LED due to its luminous intensity. As is evident in Figure 4, the geometric distribution of the lighting units covers the area of the middle of the typical room, which gives better performance efficiency.
Figure 3. Illumination distribution in typical room
Figure 4. Previous model of illumination distribution units
Table 2. Display the consumed power of the lighting units for all models
|
Model |
Source |
Number of Units |
Number of Sources |
Power of Source |
Total Power Consumption |
||
|
Per Unit |
All Units |
Per Unit |
All Units |
||||
|
Model1 |
LED |
4 |
3600 |
14400 |
2 mW |
72 W |
288 W |
|
Model2 |
LED |
16 |
900 |
14400 |
2 mW |
18 W |
288 W |
|
Model3 |
LD |
5 |
25 |
125 |
2 W |
50 W |
250 W |
As can be seen in Table 2, the number of LD contained within the lighting unit has a lower power consumption compared to the older models. The illumination distribution in the room's middle is shown in Figure 5, which you can find below. The proposed Model 3 demonstrated good efficiency in terms of lighting distribution in the center of the room while utilizing LD. It had a central illumination intensity of 162 cd, which was supplied in Table 1, and it was within the ISO range.
Figure 5. Illumination distribution at the center of the room
3.2 Power consumption
One of the objectives of this research is to reduce the power consumed in the lighting units, as LD luminaires were used with less power consumption than previous models that used LEDs, as shown in Table 2. The number of lighting units and the number of LDs and LEDs within each unit were displayed, in addition to the power consumed for each model, where the proposed Model 3 gives the least power consumed, which is calculated based on Eq. (7).
The distribution of the received optical power is one of the most important factors that affect the VLC system, as it is affected by two main points, which are the semi-angle in the optical transmitter and the FOV in the optical receiver, so the optimum value for both must be obtained. The first step is to study the semi-angle effect, as it is varied from 10o to 80o to improve the received optical power distribution model and to reach the highest received power at the level of the detector, through two characteristics, which are the contrast between the received power and the average optical power, to study the differences in power. Therefore, it must be calculated the non-uniformity power distribution (Nup) as well as the average received optical power, where Nup can be defined as a measure of the amount of power differences at the receiving level, i.e., the ratio of the maximum and the minimum power.
Figure 6. Showed the power distribution: (a) Nup power distribution; (b) Average power distribution
$N_{u p}=\frac{P_{\max }}{P_{\min }} \quad N_{U P} \geq 1$ (11)
It is observed that $N_{U P}$ is close to uniformity since the semi-angle increases, as in Figure 6(a). On the other hand, the increase in the semi-angle also leads to a decrease in the average received power distribution, as shown in Figure 6(b). This seems challenging and calls for the need to improve the average high power and low $N_{U P}$ at the same time; therefore, it was necessary to find the optimal semi-angle value, which is calculated as in Eq. (12).
$O F_{semi-angle } \triangleq \frac{P_{average }}{N_{U P}}$ (12)
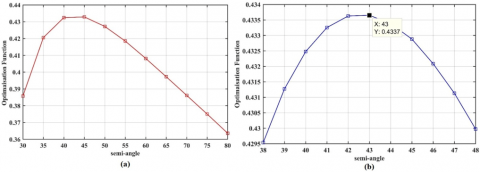
Since the goal of optimization is to achieve the maximum possible value of average power over the course of time, Figure 7(a) depicts the ideal value of the semi-angle that should be used. The lowest value of $N_{U P}$ may be acquired at the location where the best semi-angle of LD can be obtained. In Figure 7(a), the angle that is considered to be semi-optimal is between 38 and 48 degrees. As a result, a specialized simulation was carried out to demonstrate the optimal angle, which was determined to be 43 degrees and is shown in Figure 7 (b). The optimums were calculated for the angles to obtain the best lighting distribution for the interior room, but also this gives the best distribution of the optical power.
Figure 7. Optimize semi-angle: (a) Varied semi-angle from 30o to 80o; (b) Optimum semi-angle at 43o
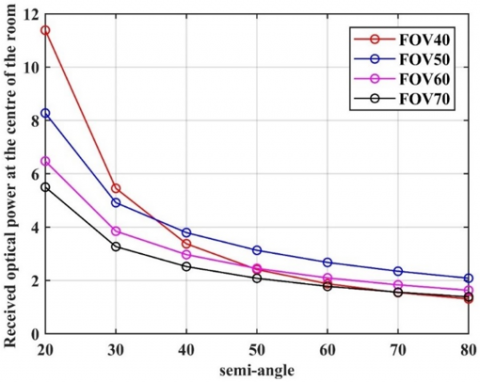
Figure 8. Variety FOV received optical power at the center of the room
Locating the field of view (FOV) that provides the best results in terms of received optical power is the second phase in the process of enhancing the optical power that is received. When altering the varied FOV, the behavior of the received optical power in the center of the room for Model 3 for semi-angle changes. This can be seen in Figure 8, which shows that the received optical power reduces with increasing the semi-angle until the low power is obtained. Optical signal received at 1.3086 dB at a semi-angle of 80 degrees and a field of view of 40 degrees. On the other hand, the optical power that is received is 2.0834 dB when the field of view is 50 degrees and the semi-angle remains the same. The received power of 5.5008 dB was attained when the semi-angle was set to 20 degrees and the FOV was set to 70 degrees. The maximum received power was acquired when the semi-angle and FOV were both set to low. In the meantime, 8.2774dB was measured at a FOV of 50 degrees. As can be seen in Figure 8, the most power was able to be produced at a small semi-angle as opposed to a broad semi-angle for all FOVs; additionally, the best results are given when the FOV is set to 50 degrees.
Figure 9. FOV: (a) Optimum FOV at 45°; (b) Optimum FOV received power compare with variety FOV
The best FOV for Model 3 to improve the received power is at 50 degrees, but this is not a very realistic representation. The optimal value was determined by first increasing and then decreasing the angle by 10 degrees from its starting point of 50 degrees, and then computing the field of view from 43 degrees to 51 degrees. Figure 9(a) and Figure 9(b) illustrate the simulation that was run to compare the optimal FOV to many values of FOV and offer the optimum FOV value the best results. On the other hand, the optimal FOV was determined for Model 3, and it is at 45 degrees
VLC is one of the best types of wireless optical communications in indoor environments because of its advantages, such as communication speed and a wide and unlicensed frequency spectrum, which is from 390 GHz to 780 GHz, making it the best alternative to RF communication. The VLC system has suffered from dark spots in the center of the room and high-power consumption. As models 1 and 2 spread the lighting units, the first on the corners only, and the second along the edges, and the center of the room was neglected, which caused a cold area that affects the quality of the lighting distribution in a consistent manner. The proposed Model 3 addressed these challenges through a new distribution of illumination units by five illumination units, using LD as a light source as an alternative to LED as it has a high illumination intensity in order to distribute the lighting in all areas of the room. The proposed Model 3 also achieved the highest optical power received by using the optimum values of the semi-angle at 43° and FOV at 45°, and it also achieved the best distribution performance of the SNR compared to the previous models. This model achieved the best illumination distribution in the middle of a typical room. On the other hand, Model 3 reduced the power consumption of illumination units compared to previous models. Thus, it was concluded that the Model 3 treated dark spots in the center of the room and achieved the best optical power received besides high SNR.
[1] Tronghop, D., Hwang, J., Jung, S., Shin, Y., Yoo, M. (2012). Modeling and analysis of the wireless channel formed by LED angle in visible light communication. In the International Conference on Information Network 2012, Bali, Indonesia, pp. 354-357. https://doi.org/10.1109/ICOIN.2012.6164399
[2] Qasim, A.A., Abdullah, M.F.L., Talib, R., Alsahlany, A.M., Gismalla, M.S.M. (2020). Modelling 5 units illumination for visible light communication system. In 2020 International Conference on Information Science and Communication Technology (ICISCT), Karachi, Pakistan, pp. 1-6. https://doi.org/10.1109/ICISCT49550.2020.9079946
[3] Qasim, A.A., Abdullah, M.F.L., Talib, R., Omar, K.A., Abdulrahman, A.M. (2019). Visible light communication the next future generation system. In 2019 International Conference on Information Science and Communication Technology (ICISCT), Karachi, Pakistan, pp. 1-7. https://doi.org/10.1109/CISCT.2019.8777446
[4] Hussein, A.T., Elmirghani, J.M. (2015). Mobile multi-gigabit visible light communication system in realistic indoor environment. Journal of Lightwave Technology, 33(15): 3293-3307. https://doi.org/10.1109/JLT.2015.2439051
[5] Ibrahim, A., Prat, J., Ismail, T. (2021). Asymmetrical clipping optical filter bank multi-carrier modulation scheme. Optical and Quantum Electronics, 53(5): 230. https://doi.org/10.1007/s11082-021-02867-2
[6] Niu, S., Wang, P., Chi, S., Liu, Z., Pang, W., Guo, L. (2020). Enhanced optical OFDM/OQAM for visible light communication systems. IEEE Wireless Communications Letters, 10(3): 614-618. https://doi.org/10.1109/LWC.2020.3040178
[7] Wu, M., Dang, J., Zhang, Z., Wu, L. (2017). Achievable rate of DCO-FBMC with low-resolution ADCs for optical wireless communication. In 2017 9th International Conference on Wireless Communications and Signal Processing (WCSP), Nanjing, China, pp. 1-6. https://doi.org/10.1109/WCSP.2017.8171124
[8] Qasim, A.A., Abdullah, M.F.L., Talib, R.B., Nemah, M.N., Hammoodi, A.T. (2020). Low complexity DCO-FBMC visible light communication system. International Journal of Electrical and Computer Engineering, 10(1): 928-934. https://doi.org/10.11591/ijece.v10i1.pp928-934
[9] Nguyen, H.Q., Choi, J.H., Kang, M., Ghassemlooy, Z., Kim, D.H., Lim, S.K., Kang, T.G., Lee, C.G. (2010). A MATLAB-based simulation program for indoor visible light communication system. In 2010 7th International Symposium on Communication Systems, Networks & Digital Signal Processing (CSNDSP 2010), Newcastle Upon Tyne, UK, pp. 537-541. https://doi.org/10.1109/CSNDSP16145.2010.5580355
[10] Gismalla, M.S., Abdullah, M.F., Niass, M.I., Das, B., Mabrouk, W.A. (2020). Improve uniformity for an indoor visible light communication system. International Journal of Communication Systems, 33(8): e4349. https://doi.org/10.1002/dac.4349
[11] Gismalla, M.M., Abdullah, M.L., Sami, M., Shah, N.S.M., Das, B., Qasim, A.A. (2020). Effect of optical attocells deployment on the RMSD spread in indoor visible light communication systems. In 2020 International Conference on Information Science and Communication Technology (ICISCT), Karachi, Pakistan, pp. 1-6. https://doi.org/10.1109/ICISCT49550.2020.9079939
[12] Niaz, M.T., Imdad, F., Kim, S., Kim, H.S. (2016). Deployment methods of visible light communication lights for energy efficient buildings. Optical Engineering, 55(10): 106113-106113. https://doi.org/10.1117/1.OE.55.10.106113
[13] Abdullah, M.F.L., Talib, R., Omar, K.A., Qasim, A.A., Abdulrahman, A.M., Dawood, A. (2019). Simulation of undersea optical communication system using DCF and SSF. In 2019 International Conference on Information Science and Communication Technology (ICISCT), Karachi, Pakistan, pp. 1-5. https://doi.org/10.1109/CISCT.2019.8777416
[14] Mahfouz, N.E., Fayed, H.A., Abd El Aziz, A., Aly, M.H. (2018). Improved light uniformity and SNR employing new LED distribution pattern for indoor applications in VLC system. Optical and Quantum Electronics, 50: 1-18. https://doi.org/10.1007/s11082-018-1618-6
[15] Din, I., Kim, H. (2014). Energy-efficient brightness control and data transmission for visible light communication. IEEE Photonics Technology Letters, 26(8): 781-784. https://doi.org/10.1109/LPT.2014.2306195
[16] Gismalla, M.S.M., Abdullah, M.F.L., Das, B., Mabrouk, W.A., Mahfouz, N.E. (2019). Design of an optical attocells configuration for an indoor visible light communications system. AEU-International Journal of Electronics and Communications, 112: 152946. https://doi.org/10.1016/j.aeue.2019.152946
[17] Gismalla, M.S.M., Abdullah, M.F.L. (2019). Optimization of received power and SNR for an indoor attocells network in visible light communication. Journal of Communications, 14(1): 64-69. https://doi.org/10.12720/jcm.14.1.64-69