Abdulrahman Al-Mafrachi*![]() | Sepanta Naimi
| Sepanta Naimi![]()
© 2024 The authors. This article is published by IIETA and is licensed under the CC BY 4.0 license (http://creativecommons.org/licenses/by/4.0/).
OPEN ACCESS
This research is executed to explore the substantial impacts of delay problems in construction projects and highlight some novel practices and solutions that could mitigate this issue. The research implemented two study methods, including quantitative and qualitative approaches. A third research approach, representing a case study of a building in Iraq, is analyzed via REVIT quantity take-off to compare the accuracy and delay problem between hand calculations and the REVIT method. The results revealed that the delay problem caused cost overrunning, losses in resources, rework, and customer dissatisfaction. Also, the findings indicated that active communication, effective teamwork, efficient support from top management, and robust project planning are important to resolve the delay issue. Further, the use of modern delay management techniques is vital to avoid financial and resource losses. The results also indicated that the projects’ activities should be tracked in accordance with their executions to help detect delays. Moreover, the results confirmed that utilizing the REVIT software for quantity take-off of steel, excavation, and concrete is greatly helpful, accurate, effortless, and could reduce significant human errors.
losses resulting, specified time, project management, completion, project management, schedule monitoring
The construction sector stands as a cornerstone in the economic framework of every nation, bringing forth substantial benefits and serving as a powerful engine for economic growth. It is, therefore, paramount to ensure the robust operation of the construction industry, as any downturn or inefficiency within this sphere could precipitate serious economic drawbacks—characterized by a dip in GDP, compromised financial liquidity, and a scarcity of employment opportunities, impacting everyone from engineers to the broader workforce [1-3].
The adoption and enforcement of project management principles within construction firms and engineering consultancies are critical in circumventing these challenges. These principles are instrumental in addressing common industry problems that might otherwise lead to reduced client satisfaction. Additionally, they play a significant role in risk mitigation at construction sites and throughout project phases [4-7]. Nevertheless, the issue of delays is a recurring challenge that continues to confront project managers. Such delays can inflict a multitude of adverse consequences on construction projects, ranging from mandatory additional expenditures to not meeting the expectations of clients and owners [8-16]. In severe cases, these delays can prompt owners and clients to initiate legal action against project managers, potentially causing substantial disruption to their business operations [17].
In response to these persistent hurdles, researchers and project management specialists have put forward various solutions and methodologies. These include, but are not limited to, the Critical Path Method (CPM), Scrum, SAFe, and the utilization of Gantt charts within software packages like Primavera [18-20]. Despite the availability of these tools and methods, the affliction of delays in the submission of construction projects—be they minor or grand in scale—remains a reality.
Thus, it is widely acknowledged that consulting with experienced project management professionals and construction experts is of great importance. Gleaning insights from their experiences with such predicaments can offer tangible strategies and solutions that have proven effective in real-world scenarios.
This study aims to delve into the issue of construction project delays, seeking the wisdom and guidance of various experts in project management and construction to contribute their critical opinions and advice. This input is essential for devising strategies to tackle and overcome the challenges of project tardiness, with the ultimate goal of enhancing client satisfaction and preventing fiscal losses. Tariq and Gardezi [21] provided a thorough examination of the delay phenomenon in construction projects, assessing its ramifications across different regions. Their extensive literature review of 172 scholarly articles illuminated the primary causes and repercussions of project delays. Moreover, it was revealed that this is a global issue, not confined to any single geographic location. Figure 1 depicts the prevalence of delays across various global regions.
Figure 1. Geographical distribution of studies reviewed for delays [21]
Similarly, Rauzana and Dharma [22] conducted a study utilizing a cross-sectional survey among 68 construction professionals to pinpoint significant risk factors contributing to project delays.
In light of the extensive literature and peer-reviewed research summarized above, it becomes evident that the quest for practical and effective strategies to address construction delays is ongoing. Recent studies have underscored the advantages of modern technology and BIM software tools, which can significantly reduce the efforts, costs, and time involved in managing construction projects, enabling precise material estimations based on accurate quantity take-off methods [23-25].
This study follows three substantial research methods. The first research approach is a quantitative study. The second one is qualitative research. The third research technique is the analysis problem using Building Information Modeling (BIM) technology. Those three research approaches are remarkably essential to provide vital information and classify factors from chief engineers and construction experts, who faced the delay problem several times and found effective solutions to treat and handle it to submit their projects on time. The three sections in the following paragraphs describe in more detail each research method.
2.1 Quantitative research
The quantitative research method (or quantitative cross-sectional descriptive study) is practical to achieve the goals of this study. This research approach can help the author collect the necessary knowledge and data regarding significant causes and reasons for the delay problem taking place in different construction projects. It is also beneficial to locate intelligent techniques and strategies adopted by project managers and construction engineers to resolve this issue and avoid any cost overruns in case the delay issue occurs. A survey questionnaire is prepared and developed to accomplish this research approach. The survey questionnaire will collect these mentioned data from engineers and project managers and help offer restorative practices to mitigate the delay issue repetition in projects. Figure 2 represents the research phase followed to prepare and develop the survey questionnaire.
Figure 2. The steps employed to design the questionnaire
At the same time, it is vital to adopt practical data analysis tactics of this cross-sectional quantitative research approach through which the most influential factors, critical elements, and considerable aspects that play a significant role in causing the delay issue in the project submission process could be identified. Furthermore, those data analysis methods are remarkably substantial to understanding some active practices and functional procedures that are recently implemented and adopted by high-experienced project managers to help alleviate the frequent challenging obstacle occurring in most construction projects in Iraq and globally, reflected in the delay that causes various negative consequences for all construction stakeholders. In this context, (A) SPSS, (B) Analysis of Variance (ANOVA), and (C) Regression tests are adopted to help classify all those aspects mentioned.
2.2 Qualitative research
Through the qualitative cross-sectional study approach adopted in this work, the author will prepare a list of some critical questions (with open-answer) to facilitate data collection from rich-knowledge people who have high experience in construction, challenged with the same problem of delay in their projects, and determined smart techniques to adopt and apply to alleviate this problem with a meager amount of financial losses and resources waste. This study method is executed with the help of interviews with top managers and key construction project specialists to identify some active solutions and substantial mechanisms to implement in case engineers face a delay issue in their projects.
2.3 Numerical delay analysis and modeling
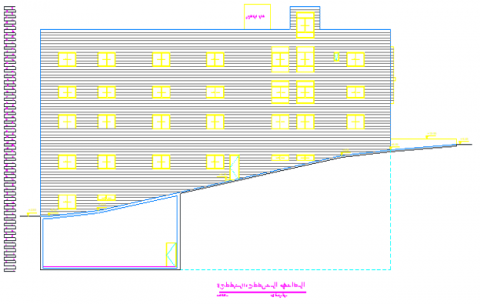
This research will also rely on a numerical approach through which the delay problem can be numerically investigated and analyzed using a BIM software package called REVIT. The REVIT program can be used to do quantity surveys, resolving the delay issue in a construction project with a higher degree of effectiveness. Therefore, a case study of a construction project is chosen to investigate. The REVIT will shed light on improvement ratios attained from modern BIM technologies instead of depending on hand calculations that may contribute to errors, rework, delay, and other problems. Thus, a comparative approach is adopted to make a comparison between the numerical estimation of construction materials and hand computations. The case study of this work comprises a project located in Iraq, specifically in the city of Baghdad. It is a multi-story commercial building, which contains three basement floors that will be used for parking and several shops. Furthermore, the building contains a ground floor, a mezzanine floor, a first floor, and a roof. Figure 3 displays a front view of the case study.
Figure 3. A front view of the building analyzed in this research
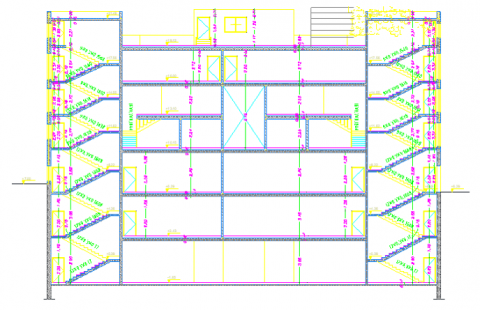
Figure 4. A second front view of the building’s sections explored in this research
Also, Figure 4 represents a second front view of the building’s sections.
This section displays the research outputs obtained after executing the three research approaches to make data collection and analysis. These sections illustrate the questionnaire results, interview outputs, and BIM analysis of the case study.
3.1 Quantitative cross-sectional research findings
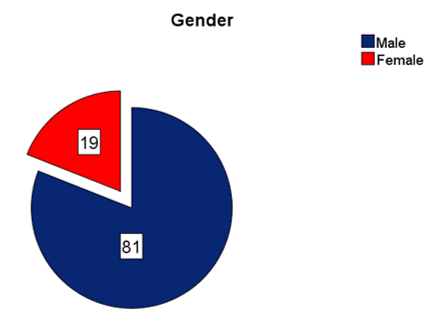
The research findings linked to the quantitative study approach are explained in this section. Moreover, this section represents some demographic databases associated with the respondents who take a role in this research, including male and female construction engineers from different disciplines. Considering the classification of those experts, engineers, and professionals would help understand their points of view and could provide an indication regarding their attitude, adoption, and practice of several beneficial techniques and approaches that may manage the submission and minimize delay in various construction projects. Table 1 illustrates the demographic data analysis of the study population surveyed according to gender.
Table 1 shows the percentage and frequency of gender for all participants. It can be indicated from Table 1 that male experts and engineers had a greatly significant ratio, corresponding to a portion of roughly 79.4%. At the same time, female engineers had a share of about 18.6%, as illustrated in Figure 5.
Figure 5. A graphical representation of the demographic data analysis for the study population related to gender
Figure 6. A graphical representation of the demographic data analysis for the study population related to qualification
Table 2 represents the demographic data analysis of the study sample related to qualification, and it also presents the percentage and frequency of qualification for overall participants who responded to this study. It can be noted from this table that the most considerable portion of participants depending on qualification, is engineers with a civil engineering degree, contributing to roughly 65.7%. This ratio is followed by the engineers with an architectural engineering degree, having a portion of about 19.6%. Furthermore, details on the qualification results are illustrated in Figure 6.
Table 1. The results of the demographic data for the study sample related to gender
|
Gender |
Frequency |
% |
Valid % |
Cumulative % |
|
|
Valid |
Male |
81 |
79.4 |
81.0 |
81.0 |
|
Female |
19 |
18.6 |
19.0 |
100.0 |
|
|
Total |
100 |
98.0 |
100.0 |
|
|
|
Missing |
System |
2 |
2.0 |
|
|
|
Total |
102 |
102 |
100.0 |
|
|
Table 2. The results of the demographic data for the study sample related to qualification
|
Qualification |
Frequency |
% |
Valid % |
Cumulative % |
|
|
Valid |
Civil Engineering |
67 |
65.7 |
67.0 |
67.0 |
|
Architectural Engineering |
20 |
19.6 |
20.0 |
87.0 |
|
|
Electrical Engineering |
9 |
8.8 |
9.0 |
96.0 |
|
|
Mechanical Engineering |
4 |
3.9 |
4.0 |
100.0 |
|
|
Total |
100 |
98.0 |
100.0 |
|
|
|
Missing |
System |
2 |
2.0 |
|
|
|
Total |
|
102 |
100.0 |
|
|
Table 3. The results of the demographic data for the study sample related to experience years.
|
Experience Years |
Frequency |
% |
Valid % |
Cumulative % |
|
|
Valid |
0-5 years |
9 |
8.8 |
9.0 |
9.0 |
|
6-10 years |
13 |
12.7 |
13.0 |
22.0 |
|
|
11-15 years |
68 |
66.7 |
68.0 |
90.0 |
|
|
16-20 years |
7 |
6.9 |
7.0 |
97.0 |
|
|
More than 20 years |
3 |
2.9 |
3.0 |
100.0 |
|
|
Total |
100 |
98.0 |
100.0 |
|
|
|
Missing |
System |
2 |
2.0 |
|
|
|
Total |
|
102 |
100.0 |
|
|
Table 4. The results of the demographic data for the study sample related to the type of engineering sector.
|
Type of Engineering Sector |
Frequency |
% |
Valid % |
Cumulative % |
|
|
Valid |
Public |
31 |
30.4 |
31.0 |
31.0 |
|
Private |
69 |
67.6 |
69.0 |
100.0 |
|
|
Total |
100 |
98.0 |
100 |
|
|
|
Missing |
System |
2 |
2.0 |
|
|
|
Total |
102 |
100 |
|
|
|
Table 3 displays the demographic data analysis related to the study sample according to experience years, and it also shows the percentage and frequency linked to experience years for all participants. It can be inferred that the most significant portion of participants related to experience years is for engineers with an experience of (11 to 15 years), contributing to a ratio of 66.7%. This percentage is followed by engineers with an experience of (6 to 10 years) with a portion of roughly 12.7%. More details are described in Figure 7.
Figure 7. A graphical representation of the demographic data analysis for the study population related to experience
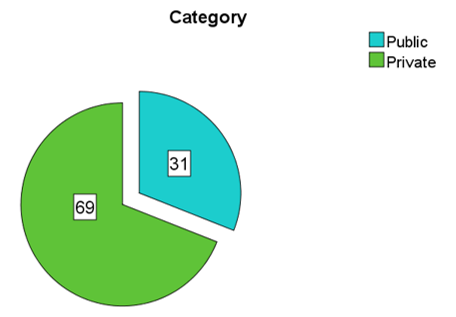
Table 4 displays the demographic data analysis related to the study population according to the type of engineering sector they work in.
It can be inferred, from Table 4, which represents the frequency and percentages of engineers working in the private and public (governmental) engineering sectors, that the ratio of engineers who are working in the private sector is larger than the percentage of those who are working in the public one, corresponding to approximately 67.6% compared to 30.4%. These ratios are represented in Figure 8.
Figure 8. Demographic data analysis related to the type of engineering sector
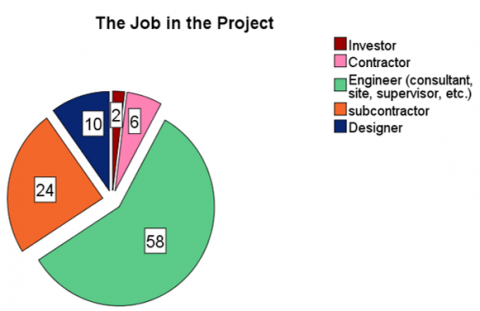
Table 5 represents the demographic data analysis for the study population related to the type of job for all participants.
It can be inferred, from Table 5, which represents the frequency and percentages of participants working in different disciplines, that the ratio of participants who are working as engineers equals 56.9%. At the same time, the percentage of participants who work as subcontractors is 23.5%. The rest of the percentages of job types can be illustrated in Figure 9.
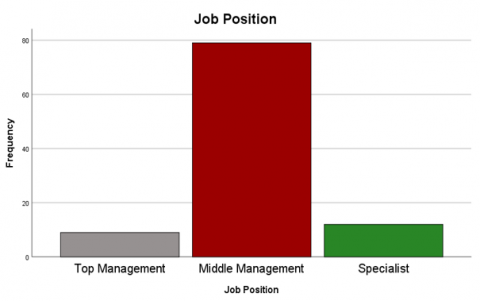
It can be inferred from Table 6, which illustrates the frequency and ratios of participants working at different management positions, that the portion of participants who are working in top management equals 8.8%. At the same time, the percentage of participants who work in middle management is about 77.5%. The rest of the percentages of management positions can be illustrated in Figure 10.
Figure 9. A graphical representation of the demographic data analysis for the study population related to the type of job
Figure 10. Analysis data related to administrative functions
Table 5. The results of the demographic data for the study sample related to the type of job
|
The Type of Job |
Frequency |
% |
Valid % |
Cumulative % |
|
|
Valid |
Investor |
2 |
2.0 |
2.0 |
2.0 |
|
Contractor |
6 |
5.9 |
6.0 |
8.0 |
|
|
Engineer (consultant, site, supervisor, etc.) |
58 |
56.9 |
58.0 |
66.0 |
|
|
Subcontractor |
24 |
23.5 |
24.0 |
90.0 |
|
|
Designer |
10 |
9.8 |
10.0 |
100.0 |
|
|
Total |
100 |
98.0 |
100.0 |
|
|
|
Missing |
System |
2 |
2.0 |
|
|
|
Total |
102 |
100 |
|
|
|
Table 6. The results of the demographic data for the study sample related to the position of management
|
Position of Management |
Frequency |
% |
Valid % |
Cumulative % |
|
|
Valid |
Top Management |
9 |
8.8 |
9.0 |
9.0 |
|
Middle Management |
79 |
77.5 |
79.0 |
88.0 |
|
|
Specialist |
12 |
11.8 |
12.0 |
100 |
|
|
Total |
100 |
98.0 |
100 |
|
|
|
Missing |
System |
2 |
2.0 |
|
|
|
Total |
102 |
100 |
|
|
|
Table 7. The results of the demographic data for the study sample related to the types of construction projects with which employees, engineers, and experts worked
|
Types of Construction Projects Achieved |
Frequency |
% |
Valid % |
Cumulative % |
|
|
Valid |
Domestic |
79 |
77.5 |
79.0 |
79.0 |
|
International |
14 |
13.7 |
14.0 |
93.0 |
|
|
Domestic and International |
7 |
6.9 |
7.0 |
100.0 |
|
|
Total |
100 |
98.0 |
100 |
|
|
|
Missing |
System |
2 |
2.0 |
|
|
|
Total |
102 |
100 |
|
|
|
Figure 11. Analysis related to engineers who worked on construction projects
Table 7 indicates the demographic data analysis related to the types of construction projects with which employees, engineers, and experts worked.
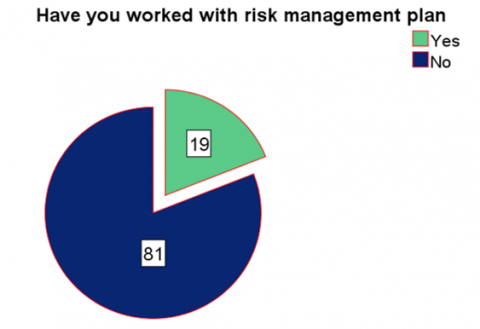
Figure 12. Analyzing data working in Iraq with international construction organizations regarding delays and risk management
It can be inferred from Table 7, which shows the frequency and ratios of engineers and experts who worked in different construction project types, that the portion of those people who worked in domestic projects equals 77.5%. Additionally, the percentage of those participants who worked on international projects is about 13.7%. The rest of the percentages of management positions can be illustrated in Figure 11.
Table 8 expresses the demographic data analysis related to the number of engineers and experts who worked in Iraq with international construction organizations that addressed delay and risk management.
Table 8. The number of engineers who worked in Iraq with international organizations that addressed delays and risk management
|
A* |
Frequency |
% |
Valid % |
Cumulative % |
|
|
Valid |
Yes |
19 |
18.6 |
19.0 |
19.0 |
|
No |
81 |
79.4 |
81.0 |
100 |
|
|
Total |
100 |
98.0 |
100 |
|
|
|
Missing |
System |
2 |
2.0 |
|
|
|
Total |
102 |
100 |
|
|
|
|
A*: Number of engineers and experts who worked in Iraq with international construction organizations that addressed delay and risk management. |
|||||
It can be inferred from Table 8, which shows the frequency and ratios of engineers and experts who worked in Iraq with international construction organizations that addressed delay and risk management, that the proportion of those individuals who worked with these organizations contributes to 18.6%. In comparison, 79.4% of them did not work with these organizations in Iraq. A graphical representation of this information is illustrated in Figure 12.
Table 9 illustrates the regression test results and ANOVA related to some demographic data.
Table 9. The results of the regression test and ANOVA related to gender and job title
|
ANOVAa |
||||||
|
Model |
Sum of Squares |
df |
Mean Square |
F |
Sig. |
|
|
1 |
Regression |
1.370 |
1 |
1.370 |
9.575 |
0.003b |
|
Residual |
14.020 |
98 |
0.143 |
|
|
|
|
Total |
15.390 |
99 |
|
|
|
|
|
a. Dependent Variable: Gender |
||||||
|
b. Predictors: (Constant), The Job in the Project |
||||||
Figure 13. Sum of squares in the regression analysis results obtained from performing the SPSS test
Figure 14. Regression analysis by performing SPSS test
Regression analysis is a statistical method that forecasts the value of a dependent variable based on the value(s) of one or more independent variables. This analysis delineates the dynamics of the relationship between the variables in question, both graphically through a regression plot and numerically via a regression equation. The regression line generated from the analysis provides a visual and algebraic representation of this relationship. Results presented in Table 9, following the application of regression analysis, reveal a regression coefficient associated with gender and job title to be 0.003, which falls below the significance threshold of 0.05. Therefore, these outcomes suggest that there is a statistically significant difference, as evidenced by the computed F-value exceeding the critical F-value at the specified degrees of freedom. Consequently, this leads to the dismissal of the null hypothesis in favor of the alternate hypothesis. Figure 13 illustrates the distribution of the explained variance in the dependent variable, as depicted by the sum of squares derived from the regression via the SPSS software. Besides, Figure 14 indicates another graphical illustration regarding the mean square in the regression analysis attained via the SPSS testing procedure.
Furthermore, in the last section of the online form required to fill by various participants, some experts and construction specialists wrote some critical points and substantial information regarding why delays would take place in their construction projects. They reported that a delay might happen because of:
Some of the important strategies and pivotal procedures reported by those people include the following vital aspects:
Employing new individuals in each construction company who are responsible for conducting continuous research and development on practical methods and procedures to overcome any challenges that may appear before, during, and after the execution of projects to help manage the schedule and prevent delay troubles in submission.
3.2 Qualitative research outputs
The results of the qualitative study method are attained after collecting data from chief engineers and experts via open-answer interviews through which several data and rich knowledge were obtained depending on their construction experience. Based on the open-answer interview findings, the following aspects can be concluded from this study approach:
3.3 The numerical delay analysis results
The results obtained from the numerical delay analysis provided a comparative analysis between the hand calculations’ accuracy and the REVIT software for effortless and accurate quantity survey. The results of the comparative analysis of these two methods are described in Table 10.
Also, Table 11 represents the comparative analysis results of reinforcement concrete’s quantity calculations between hand and numerical (REVIT) methods.
In addition, Table 12 shows the comparative analysis results of reinforcement steel’s quantity calculations between hand and numerical (REVIT) methods.
Table 10. The comparative analysis of the hand and numerical REVIT for the take-off of the excavation, blinding, and ground slab components
|
Comparison |
Manual (m3) |
REVIT (m3) |
Improvement Ratio in Accuracy |
|
|
Excavation |
16,776.58 |
16,643.83 |
99.21% |
|
|
Blinding |
126.40 |
125.54 |
99.32% |
|
|
Ground Slab Component |
Insulation Material |
11.56 |
11.56 |
100% |
|
Plain Concrete |
57.82 |
57.80 |
99.97% |
|
|
Crushed Stones |
173.46 |
173.39 |
99.96% |
|
Table 11. The comparative analysis findings of the hand and numerical REVIT method for the take-off of reinforcement concrete’s quantity
|
Comparison |
Manual (m3) |
REVIT (m3) |
Improvement Ratio in Accuracy |
|
Footing |
349.11 |
346.74 |
99.32% |
|
Ground slab |
115.64 |
115.59 |
99.96% |
|
Walls and Columns |
727.10 |
721.18 |
99.19% |
|
Slabs and Beams |
1099.39 |
1085.32 |
98.72% |
Table 12. The comparative analysis findings of the hand calculation method and numerical REVIT method for the take-off of reinforcement steel’s quantity
|
Comparison |
Manual (ton) |
REVIT (ton) |
Improvement Ratio in Accuracy |
|
Footing |
27.191 |
26.494 |
97.44% |
|
Columns |
69.804 |
67.921 |
97.30% |
|
Walls |
56.533 |
55.214 |
97.67% |
|
Beams |
162.958 |
156.544 |
96.06% |
|
Slabs |
63.640 |
59.561 |
93.59% |
|
Stair Case |
4.551 |
4.258 |
93.56% |
It can be observed from the results explained in Tables 10, 11, and 12 that the REVIT software employment as a BIM technology to resolve the delay issue contributed to significant benefits for project managers and chief engineers in the construction sector. For instance, higher levels of accuracy and performance were obtained. Furthermore, a very low number of human errors in estimating the quantity of excavation, concrete, and steel is also noted via the REVIT software. All in all, using the REVIT program can save much budget, cost of rework, and longer time required to make these take-off calculations depending on engineers. The reason is related to the fact that modern BIM tools, like REVIT, could help manage the estimation process of quantity take-off, helping avoid and alleviate to a considerable extent the repetitive errors and human faults that could lead to an overall repetition of the construction materials evaluation and assessment, besides that fact that the time required to make the quantity take-off is massive even it is done by professionals, especially when those materials are assessed and estimated for large-scale projects, like commercial skyscrapers or urban infrastructure projects. Thus, using REVIT and modern schedule management mechanisms is considerably recommended to address all those issues.
The results of the three research approaches, including quantitative, qualitative, and numerical analysis, revealed that the delay problem in construction projects could cause project cost overrunning, losses in resources, issues of rework, and customer dissatisfaction. Also, the research findings indicated that there are some innovative practices that could be implemented by project managers to solve this issue translated by providing active communication, effective teamwork, efficient support from top management, and robust project planning. Further, it was found that the use of modern delay management and reduction techniques is greatly vital for project managers to avoid financial and resource losses, such as BIM technology. The results also indicated that the projects’ activities should be tracked in accordance with their executions to help detect delays. Moreover, the results confirmed that utilizing the REVIT software for quantity take-off of steel, excavation, and concrete is greatly helpful, accurate, effortless, and could reduce significant human errors. These results are consistent with the results of [8-17], who carried out several investigations analyzing the delay issue in construction projects and found that the delay in submission could cause tremendous losses in terms of financial, time, and material resources. Additionally, the results of this work are consistent with the research findings of Shaqour [4], who found that implementing BIM technology in the construction sector is substantially useful, effective, and practical for project managers and plays a critical role in minimizing delay and reducing the rework problems.
All in all, to summarize the whole discussion, the research findings can be classified into the following points:
Utilizing the REVIT software for quantity take-off of steel, excavation, and concrete is beneficial, accurate, and effortless and could reduce significant human errors and rework that cause delays in submission.
[1] Onkar, P. (2022). The economic domino effect on housing and construction sector–a case of India. Journal of Financial Management of Property and Construction, 28(2): 206-219. https://doi.org/10.1108/JFMPC-07-2021-0049
[2] Ofori, G. (2022). Construction economics: Its origins, significance, current status and need for development. In Research Companion to Construction Economics, Edward Elgar Publishing, pp. 18-40. https://doi.org/10.4337/9781839108235
[3] Gumenna-Derij, M., Khorunzhak, N., Poprozman, N., Berezka, K., Kruchak, L. (2022). Modeling, accounting and control of formation and use of resources (on the example of the construction industry). Independent Journal of Management & Production, 13(3): s123-s144. https://doi.org/10.14807/ijmp.v13i3.1901
[4] Shaqour, E.N. (2022). The role of implementing BIM applications in enhancing project management knowledge areas in Egypt. Ain Shams Engineering Journal, 13(1): 101509. https://doi.org/10.1016/j.asej.2021.05.023
[5] Madureira, R.C., Silva, C.S., Amorim, M., Ferreira Dias, M., Lins, B., Mello, G. (2022). Think twice to achieve a sustainable project management: From ecological sustainability towards the sustainable project management cube model. Sustainability, 14(6): 3436. https://doi.org/10.3390/su14063436
[6] Lotfi, R., Yadegari, Z., Hosseini, S., Khameneh, A., Tirkolaee, E., Weber, G.E.R.H.A.R.D. (2022). A robust time-cost-quality-energy-environment trade-off with resource-constrained in project management: A case study for a bridge construction project. Journal of Industrial and Management Optimization, 18(1): 375-396. https://doi./10.3934/jimo.2020158
[7] Couto, J.C., Kroll, J., Ruiz, D.D., Prikladnicki, R. (2022). Extending the project management body of knowledge (PMBOK) for data visualization in software project management. SN Computer Science, 3(4): 1-22. https://10.1007/s42979-022-01168-z
[8] Shrivas, A., Singla, H.K. (2022). Analysis of interaction among the factors affecting delay in construction projects using interpretive structural modelling approach. International Journal of Construction Management, 22(8): 1455-1463. https://doi.org/10.1080/15623599.2020.1728486
[9] Sanni-Anibire, M.O., Mohamad Zin, R., Olatunji, S.O. (2022). Causes of delay in the global construction industry: A meta analytical review. International Journal of Construction Management, 22(8): 1395-1407. https://doi.org/10.1080/15623599.2020.1716132
[10] Annamalaisami, C.D., Kuppuswamy, A. (2022). Reckoning construction cost overruns in building projects through methodological consequences. International Journal of Construction Management, 22(6): 1079-1089. https://doi.org/10.1080/15623599.2019.1683689
[11] Kamal, A., Abas, M., Khan, D., Azfar, R.W. (2022). Risk factors influencing the building projects in Pakistan: From perspective of contractors, clients and consultants. International Journal of Construction Management, 22(6): 1141-1157. https://doi.org/10.1080/15623599.2019.1683693
[12] Do, S.T., Nguyen, V.T., Tran, C.N., Aung, Z.M. (2022). Identifying and evaluating the key claim causes leading to construction delays. International Journal of Construction Management, 1-13. https://doi.org/10.1080/15623599.2022.2030508
[13] Marhani, M.A., Jaapar, A., Bari, N.A., Shaari, S.M. (2022). Reducing over-processing construction waste by using lean construction tools in the Malaysian construction industry. In IOP Conference Series: Earth and Environmental Science, Shah Alam, Malaysia, 1067(1): 012048. https://doi.org/10.1088/1755-1315/1067/1/012048
[14] Danial, N., Misnan, M.S. (2022). Possession of site: Another layer of complexity in road construction. Sustainability, 14(11): 6809. https://doi.org/10.3390/su14116809
[15] Mahamid, I. (2022). Relationship between delay and productivity in construction projects. International Journal of Advanced and Applied Sciences. 9(2): 160-166.
[16] Mate, A.S., Deshmukh, S.S. (2022). Management of risk involved in construction sector. International Journal of Research in Engineering, Science and Management, 5(2): 177-180.
[17] Fashina, A.A., Fakunle, F.F., Omar, M.A. (2020). A Study on the effects of construction project delays in Somaliland construction industry. Journal of Management, Economics, and Industrial Organization, 4(3): 89-102. https://doi.org/10.31039/jomeino.2020.4.3.6
[18] Marco, A.D. (2019). Project management for facility constructions a guide for engineers and architects. Springer International Publishing AG, Part of Springer Nature. https://doi.org/10.1007/978-3-319-75432-1
[19] Piven, B. (2022). International project management (on the example of specific project) (on the basis of Novo Box entering the Moldovan market). Doctoral dissertation, Private Higher Educational Establishment-Institute “Ukrainian-American Concordia University”. http://elib.uacu.edu.ua/xmlui/handle/123456789/32.
[20] Leicht, D., Castro-Fresno, D., Dìaz, J., Baier, C. (2020). Multidimensional construction planning and agile organized project execution—The 5D-PROMPT method. Sustainability, 12(16): 6340. https://doi.org/10.3390/su12166340
[21] Tariq, J., Gardezi, S.S.S. (2022). Study the delays and conflicts for construction projects and their mutual relationship: A review. Ain Shams Engineering Journal, 101815. https://doi.org/10.1016/j.asej.2022.101815
[22] Rauzana, A., Dharma, W. (2022). Causes of delays in construction projects in the Province of Aceh, Indonesia. PloS one, 17(1): e0263337. https://doi.org/10.1371/journal.pone.0263337
[23] Khaleel, A., Naimi, S. (2022). Automation of cost control process in construction project building information modeling (BIM). Periodicals of Engineering and Natural Sciences, 10(6): 28-38. https://doi.org/10.21533/PEN.V10I6.3354
[24] Alfaggi, W., Naimi, S. (2022). An optimal cost estimation practices of fuzzy AHP for building construction projects in Libya. Civil Engineering Journal, 8(6): 1194-1204. https://doi.org/10.28991/CEJ-2022-08-06-08
[25] Reihanifar, M., Naimi, S. (2018). Evaluation of road construction projects by value engineering approach as a tool for sustainability. International Journal of Ecosystems and Ecology Science (IJEES), 8: 339-346.