Agus Arip Munawar*![]() | Hizir Hizir
| Hizir Hizir![]() | Syaifullah Muhammad
| Syaifullah Muhammad![]() | Yusmanizar Yusmanizar
| Yusmanizar Yusmanizar![]()
© 2023 IIETA. This article is published by IIETA and is licensed under the CC BY 4.0 license (http://creativecommons.org/licenses/by/4.0/).
OPEN ACCESS
Patchouli oil (PO) is a valuable commodity in the global market due to its numerous pharmaceutical properties. Consequently, adulteration of pure patchouli oil with other oil substances has become a prevalent issue. This study aims to develop rapid and non-destructive classification models for detecting patchouli oil fraudulence using support vector machine classification (SVMC) and discriminant analysis (DA) based on near-infrared (NIR) spectroscopic data. Pure PO was adulterated with oleoresin oil in proportions of 75:25 and 50:50 to create the adulterated samples. A total of 40 samples were used for model calibration, and 9 samples were employed for validation. NIR spectra covering a wavelength range of 1000-2500 nm were collected for all samples and preprocessed using the multiplicative scatter correction algorithm. Classification models based on SVMC and DA were developed using principal component analysis. Results demonstrated that pure patchouli oil and oleoresin oil could be accurately classified, while adulterated PO with a 50:50 proportion was detected with a maximum accuracy of 87%, and the 75:25 proportion yielded a detection accuracy of 97%. These findings suggest that combining NIR spectroscopy with appropriate classification models can efficiently detect patchouli oil adulteration in a rapid and non-destructive manner, offering a promising method for quality control in the industry.
models, NIRS, mathematical, agriculture, PCA, LDA, classification
Patchouli (Pogostemon cablin Benth) oil is a widely utilized essential oil in aromatherapy and medicine due to its unique characteristics and therapeutic properties. Its importance in medicine and pharmacy stems from the numerous pharmaceutical features it possesses [1]. Patchouli oil has been reported to exhibit neuroprotective, anti-influenza, and anti-inflammatory effects [2], and has been used traditionally to treat ailments such as colds, headaches, fever, nausea, and vomiting [3]. Recent studies have shown that patchouli oil demonstrates potential antidepressant activity. Patchouli alcohol (PA, C15H26O), a tricyclic sesquiterpene, is the major chemical constituent of patchouli oil, accounting for up to 37.53% of its composition [4]. PA has been found to possess gastroprotective properties, which may mitigate the gastrointestinal side effects of antidepressants [4, 5].
Indonesia is the leading producer of patchouli oil, supplying approximately 90% of the global market. The majority of this product is sourced from Aceh Province, which is renowned for producing high-quality patchouli oil. In 2020, Aceh was the second-largest patchouli oil producer in Indonesia, yielding 563 tons and spanning 2,740 hectares [6].
A significant concern in food security is the prevalence of fraudulent and counterfeit practices. The high demand and market value of patchouli oil have led some retailers to adulterate pure patchouli oil with other oil substances that share similar characteristics, such as being colorless, odorless, and easily blended with patchouli oil. The most common adulterants used for this purpose are oils derived from the Dipterocarpaceae family, commonly known as oleoresin or locally as Keruing oil [7]. Detecting these fraudulent practices is challenging using visual inspection alone, necessitating laboratory analysis. Conventional analytical methods, such as mass spectroscopy (e.g., GC-MS) and nuclear magnetic resonance (NMR), are often employed to detect adulterants in food, oil, and beverages [8, 9]. Despite their sensitivity and accuracy, these methods typically involve solvent extractions and complex sample preparation procedures, are expensive, and may contribute to environmental pollution due to the use of chemical materials during the analysis [10]. As a result, there is a growing need for alternative methods that can rapidly and accurately detect adulterated patchouli oil while addressing these limitations.
Near-infrared spectroscopy (NIRS) has recently emerged as a viable approach for real-time monitoring of food safety and quality control. NIRS offers rapid, sensitive, and simultaneous prediction of multiple chemical quality attributes of agricultural products, including adulterant detection [11, 12]. Performed in the wavelength range of 780–2500 nm, NIRS is a high-energy vibrational spectroscopy technique that can be used to determine the inner quality attributes of biological samples based on their spectral features and patterns, as well as the response of organic bonds when irradiated with NIR radiation [10, 13, 14]. This interaction between NIR radiation and biological samples can result in reflection, absorption, or transmission.
Numerous studies have demonstrated the capability of NIRS to determine various inner quality parameters of food and agricultural products [15, 16]. For adulteration detection, NIRS has proven successful in identifying adulterants in sesame oil [17], Argan oil [18], and honey [19]. However, to the best of our knowledge, there is a scarcity of research on the use of NIRS for detecting fraudulence in patchouli oil, particularly from Aceh Province, which is known for its high-quality oil.
The primary objective of this study is to investigate the potential of NIRS as a rapid and robust method for detecting adulteration and fraudulence in patchouli oil, with a focus on oil from Aceh Province. The authenticity of patchouli oil is assessed by developing classification models based on near-infrared spectral data using discriminant analysis (DA) and support vector machine classification (SVMC). Two DA algorithms, quadratic discriminant analysis (QDA) and Mahalanobis discriminant analysis (MDA), are employed to establish the classification models. The results reveal that NIRS combined with SVMC and DA can classify pure patchouli oil and adulterated samples with a maximum accuracy of 88.89%. Moreover, the SVMC model outperforms the QDA and MDA models in terms of accuracy.
2.1 Samples
A total of 49 bottles of pure and adulterated patchouli oil were used as samples. Samples for estimating PA levels of patchouli oil were prepared by fractionating patchouli oil, hence four variants of PA levels of patchouli oil were obtained. The value of PA content of patchouli oil was tested using the GC-MS method. Then 40 new variants of patchouli oil levels of PA were established. These oil samples were divided onto training and testing dataset. Training data were used to develop classification models whilst testing data was used for validation purpose. All samples were placed into bottles to acquire near infrared spectral data. Pure patchouli oil with high patchouli alcohol were obtained from the Atsiri Research Center (ARC) USK. Oleoresin oil or also known as Keruing oil was used as an adulterated material, resulted from Dipterocarpaceae plant. Each sample was filled in with maximum of 15 mL of pure patchouli oil and adulterated oil with different proportions, namely 75:25 from which 75% of pure patchouli oil was adulterated or mixed with 25% of oleoresin oil, and 50:50 proportion respectively.
2.2 NIR spectral data acquisition
The near infrared spectral data of all samples will be acquired in form of diffuse reflectance spectrum using a portable sensing device near infrared spectroscopy (PSD-NIRS i16). Spectral data were obtained in wavelength range from 1000 to 2500 nm with resolution of 0.2 nm and co-added of 32 scans per spectra measurement. Schematic illustration on how spectral data will be acquired is presented in Figure 1 [7].
2.3 Spectral data corrections
In order to achieve accurate and robust prediction performances, spectral data were corrected and enhanced using multiplicative scatter correction (MSC) [20]. Enhanced spectral data were then used as NIR spectral data to develop classification models, used to distinguish oil samples between pure and adulterated oils.
2.4 Classification models
To detect adulterated patchouli oil and distinguish oil samples based on purity/authenticity, classification models were developed using support vector machine classification (SVMC) and discriminant analysis (DA) optimized by principal component analysis (PCA) [21]. Classification plot were presented to observe in which concentration that adulterated patchouli oil will be detected. The minimum concentration can be detected the better models would be.
Prediction models performance were evaluated based on calibration and cross validation results according to the accuracy of the confusion matrices.
Figure 1. Spectral data acquisition for oil samples in wavelength range from 1000 to 2500 nm
3.1 Spectra features
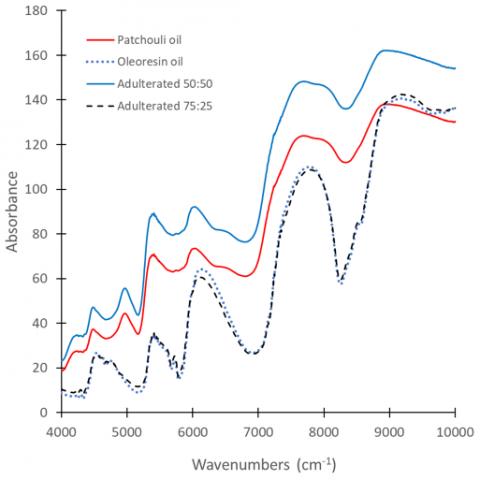
The spectral feature of pure patchouli oil, adulterated oil, 75:25 and 50:50 adulterations is presented in Figure 2. Near infrared spectrum of oil samples consisted of absorption bands of C-O, C-H-O, R-O-H and H-O. The typical spectra of the patchouli and adulterated oils are similar. A closer inspection reveals that the diffuse reflectance peak of pure patchouli oil and adulterated oil are distinct.
In addition, the formed peaks of the two oil spectra have slight differences. In particular, the dominant OH peak in patchouli oil differed from the dominant CH, CH2, and CH3 peaks in oleoresin oil. Literature stated that oleoresin oil has a similar characteristic to patchouli oil, thus, it is preferred as a substitute for patchouli oil.
When oleoresin oil is rubbed into the skin of the hands, it feels slippery and does not absorb into the skin, whereas in patchouli oil case, it feels warm, absorbs into the skin and emits a pungent odor. The aroma of natural therapy is detected by the sense of smell. In general, there are seven vibrations consisted of peaks and valleys of the featured samples spectrum.
Figure 2. Spectra features in near infrared region of patchouli oil, oleoresin oil and the adulteration
The NH2 peak corresponds to the first vibration in the wavelength range of 2150-2270 nm. According to the study [22], the wavelength range between 2180 and 2200 nm is associated with protein concentration. The presence of R-OH molecules is indicated by a peak at a wavelength of 1940 – 2020 nm, which corresponds to the second vibration. The wavelength range between 2000 and 18000 nm contains a significant amount of patchouli alcohol. However, R-OH was only detected in patchouli oil, whereas this peak was absent in oleoresin oil.
At a wavelength interval of 1970-1870 nm, the third vibration is a valley, which indicates the presence of H2O molecules. According to literatures, the wavelength range between 1910 and 1830 nm indicates water content. Moreover, the peak indicating the presence of CH, CH2, and CH3 molecules is found in the fourth vibration within the 1720-1580 nm wavelength range [23-25]. The wavelength range between 1910 and 1830 nm indicates the presence of fat. At a wavelength interval of 1440-1400 nm, the fifth vibration is a valley, which indicates the presence of H2O and R-OH molecules. Similar findings also noted that wavelength region between 910 and 1830 nm indicates the water and alcohol content of patchouli [26-28].
The sixth vibration within the 1350-1245 nm wavelength range is the peak indicating the presence of CH3 molecules, indicating the presence of fat content. The seventh vibration in the 1220-1170 nm wavelength range is a valley that indicates the presence of CH, CH2, and CH3 molecules. The sixth and seventh vibrations are more pronounced in the oleoresin oil spectrum, whereas they are weaker in the patchouli oil spectrum.
The adulterated proportion of 75% PO: 25% AO is comparable to PO. However, there are four combinations of peaks and valleys that changed significantly when pure PO was mixed with oleoresin oil to become 75% PO, when viewed in more details. The four peaks and valleys indicate the amount of alcohol and fat present in Patchouli oil.
Furthermore, the spectrum of pure patchouli oil (PO) and oil containing 50% of AO, consisted of four wave vibrations illustrate the PA and lipid content. The first vibration occurs at a wavelength between 1910 and 2175 nm, which indicates the high alcohol content of patchouli. In the PO spectrum, the formed peaks are very significant, whereas in the 50%: 50% adulteration proportion, they are still invisible, but are positioned deeper in the 50:50 adulteration valley than that in the 75:25 ones.
The second vibration has a wavelength between 1634 and 1705 nm, indicating the fat content. The peak for the PO spectrum does not change, whereas the peak for 50:50 adulteration proportion is extremely high. The third vibration has a wavelength between 1307 and 1352 nm, indicating the fat content. The peak of the PO spectrum is neither excessively high nor deep, whereas the 50:50 adulteration spectrum is higher at this peak. The fourth vibration between 1189 and 1239 nanometers indicates fat content. The valleys in the PO spectrum are not particularly deep, whereas the 50% adulteration spectrum has valleys that are significantly deeper than those in the 75% spectrum.
3.2 Classification models
Prior to classification models development, near infrared spectral data of all oil samples were corrected ad enhanced using multiplicative scatter correction algorithm. MSC attempts to remove the effects of scattering by linearizing each spectrum to an ‘ideal’ spectrum of the sample. Each individual spectrum is normalized to zero mean and unit variance.
Once after spectra correction was completed, the data was projected onto principal component analysis (PCA) to observe the differences between pure patchouli oil and the adulterated oils using oleoresin with different proportion as presented in Figure 3. The PCA seems can distinguish and separate pure patchouli oil and the adulterated ones. The maximum explained variance for the first two principal components (2 PCs) is 99% (PC1=96% and PC2=3%) respectively.
In practice, this classification models can be applied for rapid and real-time detection of patchouli oil fraudulence and adulteration by transferring the models into the NIR instrument. Further, user can directly detect the authenticity of the incoming patchouli oil samples by irradiating sample by means of NIRS. The projected classification models were then run and the sample can be classified either pure or adulterated. The whole process of this rapid detection can take approximately 50 seconds. Indeed, this study can be an alternative method beside the standard GC-MS method used to determine the purity of patchouli oil.
Figure 3. Pure patchouli oil and the adulterated oils can be distinguished by means of PCA
The PCA was also used to classify spectral data of oil samples with different adulterated proportions 75:25 and 50:50 as presented in Figure 4.
Figure 4. PCA result of adulterated patchouli oils with different proportion 75:25 and 50:50
Classification models were then established using Support vector machine classification (SVMC) and discriminant analysis (DA). SVM is a subclass of algorithms distinguished by their use of kernels. Historically, this technique was used to solve classification problems, but it is now also applied to regression problems. In kernel-based methods, calibration is performed in a space of non-linearly transformed input data without performing the transformation [29, 30]. The kernel function defines the feature space as a measure of spectral similarity. Gaussian and polynomial functions are the most popular kernel functions.
In Gaussian or radial basis function SVMC practices, there are three tuning parameters that must be optimized: the parameter C, also known as a capacity factor or penalty factor, is one of these parameters. It is a measure of the model's robustness. The value of the parameter C must be greater than 0. Gamma (ƴ) is a kernel parameter that specifies the extent of the training samples' influence. High gamma indicates a close, positive relationship that may result in accurate predictions but biased outcomes, and vice versa. The C and gamma parameters of the radial basis function kernel must be optimized simultaneously. If gamma is high, C will have a negligible effect. If gamma is low, C has the same effect on the model as it does on the linear model. In addition, the parameter epsilon (Ɛ) is defined as the error margin.
In this presented study, the parameters for SVMC were optimized using grid search optimization method from which the optimized parameters are: C=0.046, ƴ=0.065 and Ɛ=0,01 respectively. The achieved accuracy for the fraudulence detection of adulterated and pure patchouli oils is 75% as presented in the confusion matrix Table 1.
Table 1. Classification accuracy of pure and adulterated patchouli oil based on SVMC model (75%)
|
Actual/Predicted |
MN |
MK |
MNK_50 |
MNK_75 |
|
MN |
0 |
0 |
0 |
0 |
|
MK |
0 |
10 |
0 |
0 |
|
MNK_50 |
9 |
0 |
10 |
0 |
|
MNK_75 |
1 |
0 |
0 |
10 |
MN: pure patchouli oil, MK: adulterated oil/oleoresin oil, MNK_50: patchouli oil adulterated with oleoresin oil proportion 50:50, and MNK_75: patchouli oil adulterated with oleoresin oil proportion 75:25.
As shown in Table 1, pure adulterated oils and both adulteration proportions can be classified and categorized precisely using SVMC models. Each ten samples of those three classes can be clustered exactly as they are. However, the models could not classify the pure patchouli oil in the right place. Thus, the overall accuracy of this SVMC model is 75%.
Another attempted classification models were also developed using discriminant analysis (DA) which is optimized by the PCA analysis. Three DA algorithms were employed to establish the classification models namely linear discriminant analysis (LDA), quadratic discriminant analysis (QDA), and Mahalanobis discriminant analysis (MDA). The results for those three DA classifications are presented in Table 2 to Table 4.
Table 2. Classification accuracy of pure and adulterated patchouli oil based on LDA model (62.5%)
|
Actual/Predicted |
MN |
MK |
MNK_50 |
MNK_75 |
|
MN |
7 |
0 |
6 |
1 |
|
MK |
0 |
8 |
0 |
3 |
|
MNK_50 |
3 |
0 |
4 |
0 |
|
MNK_75 |
0 |
2 |
0 |
6 |
MN: pure patchouli oil, MK: adulterated oil/oleoresin oil, MNK_50: patchouli oil adulterated with oleoresin oil proportion 50:50, and MNK_75: patchouli oil adulterated with oleoresin oil proportion 75:25.
Table 3. Classification accuracy of pure and adulterated patchouli oil based on QDA model (72.5%)
|
Actual/Predicted |
MN |
MK |
MNK_50 |
MNK_75 |
|
MN |
10 |
0 |
9 |
1 |
|
MK |
0 |
10 |
0 |
1 |
|
MNK_50 |
0 |
0 |
1 |
0 |
|
MNK_75 |
0 |
0 |
0 |
8 |
MN: pure patchouli oil, MK: adulterated oil/oleoresin oil, MNK_50: patchouli oil adulterated with oleoresin oil proportion 50:50, and MNK_75: patchouli oil adulterated with oleoresin oil proportion 75:25.
As shown in Table 2, pure patchouli oil can be classified precisely 7 samples whilst remaining 3 samples were miss classified as adulterated 50:50. On the other hand, the adulteration oil, oleoresin oil can be classified by means of LDA model are 8 samples while the other 2 samples, the model categorized as adulterated oils 75:25 proportion. Thus, the two samples were miss-classified. Moreover, the correct classification for the adulterated oils for the proportion 50:50 and 75:25 are 4 and 6 samples respectively. The overall detection and classification accuracy for the LDA model is 62.5% Therefore, if we compared to the SVMC, the LDA classification model is less accurate to detect adulteration and fraudulence in patchouli oil.
A better accuracy than LDA is achieved when the model is developed using QDA and MDA approaches. The overall detection accuracy for both classification models is 72.5%. Pure patchouli oil can be classified precisely for all 10 samples by means of QDA, while using MDA, 6 samples are classified correctly whilst remaining 4 samples were miss-classified. The adulteration proportion 75:25 generally can be classified correctly for most of samples presented. This is probably due to a clear vibration of patchouli alcohol composition in pure patchouli oil was not found in oleoresin oil.
Table 4. Classification accuracy of pure and adulterated patchouli oil based on MDA model (72.5%)
|
Actual/Predicted |
MN |
MK |
MNK_50 |
MNK_75 |
|
MN |
6 |
0 |
6 |
0 |
|
MK |
0 |
10 |
0 |
0 |
|
MNK_50 |
4 |
0 |
4 |
1 |
|
MNK_75 |
0 |
0 |
0 |
9 |
MN: pure patchouli oil, MK: adulterated oil/oleoresin oil, MNK_50: patchouli oil adulterated with oleoresin oil proportion 50:50, and MNK_75: patchouli oil adulterated with oleoresin oil proportion 75:25.
The proportion 75:25 consisted of 75% of pure patchouli oil, hence, more samples of the adulteration can be detected. On the other hand, the adulteration proportion 50:50, the DA classification models seems has difficulties to detect the adulterated oils. The same proportion of pure and oleoresin oil makes the hard to detect by means of DA models. The uncertainty vibration of molecular bonds of patchouli alcohol content is the main reason for this. The relationship between near infrared spectra and targeted constituents to be modelled is not always linear. The source of nonlinearity may vary widely, and is difficult to identify. Thus, linear DA approaches cannot detect the adulteration in patchouli oil precisely.
Non-linearity inherent to NIR spectral data and target chemical components cannot be corrected by spectral pre-treatments and necessitates the application of nonlinear adjustment techniques. We hypothesized that these non-linear approaches would produce more accurate in detecting fraudulence and adulteration in patchouli oil. The SVMC method is one of the non-linear classification models developed in this work. As shown in this study, the use of SVMC improves the overall detection accuracy to 75%. The whole samples from pure oleoresin oil, adulterated oil with proportion 75:25 and 50:50 can be classified with 100% accuracy. Only the pure patchouli oil is miss-classified, mainly to adulteration 50:50 and 75:25.
The SVMC model was then tested independently using 9 oil samples to detect weather there are any fraudulent and adulteration in patchouli oil. The 9 tested samples consisted of 3 samples of oleoresin oil as an adulterated oil, and each 3 samples of 25% and 50% adulterated oils. Detection result of those 9 samples is presented in Table 5.
From all 9 tested samples, only one sample is miss-classified, while remaining 8 samples are projected and classified precisely as actual category. Hence, the overall accuracy of the SVMC model validation is 88.89%. Yet, further studies are still required to explore more details related to adulteration in patchouli oil, such as fewer concentration of an adulterant, and the impact of spectral data pre-treatments to the prediction accuracy of the classification models. Nevertheless, obtained results from this feasibility study showed that the NIRS combined with SVMC model can be used to rapidly detect adulteration and fraudulence in patchouli oil.
Table 5. Classification accuracy of pure and adulterated patchouli oil using validation dataset of tested samples based on SVMC model (88.9%)
|
No |
Actual |
Predicted |
|
1 |
MK |
MK |
|
2 |
MK |
MK |
|
3 |
MK |
MK |
|
4 |
MNK_50 |
MNK_50 |
|
5 |
MNK_50 |
MNK_50 |
|
6 |
MNK_50 |
MN |
|
7 |
MNK_75 |
MNK_75 |
|
8 |
MNK_75 |
MNK_75 |
|
9 |
MNK_75 |
MNK_75 |
MN: pure patchouli oil, MK: adulterated oil/oleoresin oil, MNK_50: patchouli oil adulterated with oleoresin oil proportion 50:50, and MNK_75: patchouli oil adulterated with oleoresin oil proportion 75:25.
This study attempted to solve problems related to fraudulence practice in patchouli oil, by developing classification models based on near infrared spectroscopy. The models were established by means of support vector machine classification (SVMC) and discriminant analysis (DA) approaches consisted of linear DA, quadratic DA and Mahalanobis DA. Achieved results showed that the prediction accuracy of the adulteration detection is 88.89% using SVMC model. Therefore, it may conclude that NIRS combined with SVMC model can be used to rapidly detect adulteration and fraudulence in patchouli oil. For practical purposes, the NIRS based classification models can be applied for rapid and real-time detection of patchouli oil fraudulence and adulteration by transferring the models into the NIR instrument. The whole process of this rapid detection can take approximately 50 seconds.
This work is supported by the directorate of research and community service LPPM Universitas Syiah Kuala through Penelitian H-Indeks PHI scheme 2023.
[1] Soh, S.H., Jain, A., Lee, L.Y., Chin, S.K., Yin, C.Y., Jayaraman, S. (2021). Techno-economic and profitability analysis of extraction of patchouli oil using supercritical carbon dioxide. Journal of Cleaner Production, 297: 126661. https://doi.org/10.1016/j.jclepro.2021.126661
[2] Chen, G., Xie, X., Peng, F., Wang, T., Chen, J., Li, G., Liu, J., Peng, C. (2022). Protective effect of the combination of essential oil from patchouli and tangerine peel against gastric ulcer in rats. Journal of Ethnopharmacology, 282: 114645. https://doi.org/10.1016/j.jep.2021.114645
[3] Jain, P.L., Patel, S.R., Desai, M.A. (2020). Enrichment of patchouli alcohol in patchouli oil by aiding sonication in hydrotropic extraction. Industrial Crops and Products, 158: 113011. https://doi.org/10.1016/j.indcrop.2020.113011
[4] Zhuo, J., Chen, B., Sun, C., Jiang, T., Chen, Z., Liu, Y., Nie, J., Yang, H., Zhang, J., Lai, X., Su, Z., Li, C., Li, Y. (2020). Patchouli alcohol protects against chronic unpredictable mild stress-induced depressant-like behavior through inhibiting excessive autophagy via activation of mTOR signaling pathway. Biomedicine & Pharmacotherapy, 127: 110115. https://doi.org/10.1016/j.biopha.2020.110115
[5] Yu, Z.X., Wang, L.J., Zhao, B., Shan, C.M., Zhang, Y.H., Chen, D.F., Chen, X.Y. (2015). Progressive regulation of sesquiterpene biosynthesis in Arabidopsis and Patchouli (Pogostemon cablin) by the miR156-targeted SPL transcription factors. Molecular Plant, 8(1): 98-110. https://doi.org/10.1016/j.molp.2014.11.002
[6] Indira, T.I., Burhan, K.H., Manurung, R., Widiana, A. (2021). Enhancement of essential oil yield from melaleuca leucadendra l. leaves by lignocellulose degradation pre-treatment using filamentous fungi. Journal of Bioresources and Bioproducts, 6(4): 379-386. https://doi.org/10.1016/j.jobab.2021.02.010
[7] Meilina, H., Munawar, A.A. (2021). Robust fraudulence detection of patchouli oil plant using near infrared spectroscopy. In IOP Conference Series: Earth and Environmental Science, 644(1): 012019. https://doi.org/10.1088/1755-1315/644/1/012019
[8] Muhammad, S., Munawar, A.A. (2021). Rapid detection of patchouli oil mixed by coconut oil using NIRS technology and chemometrics method. In IOP Conference Series: Earth and Environmental Science, 644(1): 012005. https://doi.org/10.1088/1755-1315/644/1/012005
[9] Basyir, F., Munawar, A.A., Aisyah, Y. (2021). Near infrared reflectance spectroscopy: Classification and rapid prediction of patchouli oil content. In IOP Conference Series: Earth and Environmental Science, 667(1): 012071. https://doi.org/10.1088/1755-1315/667/1/012071
[10] Pasquini, C. (2018). Near infrared spectroscopy: A mature analytical technique with new perspectives–A review. Analytica Chimica Acta, 1026: 8-36. https://doi.org/10.1016/j.aca.2018.04.004
[11] Tahir, H.E., Arslan, M., Mahunu, G.K., Mariod, A.A., Wen, Z., Zou, X., Huang, X., Shi, J., El-Seedi, H. (2020). Authentication of the geographical origin of Roselle (Hibiscus sabdariffa L) using various spectroscopies: NIR, low-field NMR and fluorescence. Food Control, 114: 107231. https://doi.org/10.1016/j.foodcont.2020.107231
[12] Rahman, A., Wang, S., Yan, J., Xu, H. (2021). Intact macadamia nut quality assessment using near-infrared spectroscopy and multivariate analysis. Journal of Food Composition and Analysis, 102: 104033. https://doi.org/10.1016/J.JFCA.2021.104033
[13] Munawar, A.A., Hörsten, D.V., Mörlein, D., Pawelzik, E., Wegener, J.K. (2013). Rapid and non-destructive prediction of mango sweetness and acidity using near infrared spectroscopy. Massendatenmanagement in der Agrar-und Ernährungswirtschaft–Erhebung–Verarbeitung–Nutzung.
[14] Comino, F., Aranda, V., García-Ruiz, R., Ayora-Cañada, M.J., Domínguez-Vidal, A. (2018). Infrared spectroscopy as a tool for the assessment of soil biological quality in agricultural soils under contrasting management practices. Ecological Indicators, 87: 117-126. https://doi.org/10.1016/j.ecolind.2017.12.046
[15] Nordey, T., Joas, J., Davrieux, F., Chillet, M., Léchaudel, M. (2017). Robust NIRS models for non-destructive prediction of mango internal quality. Scientia Horticulturae, 216: 51-57. https://doi.org/10.1016/j.scienta.2016.12.023
[16] Walsh, K.B., McGlone, V.A., Han, D.H. (2020). The uses of near infra-red spectroscopy in postharvest decision support: A review. Postharvest Biology and Technology, 163: 111139. https://doi.org/10.1016/j.postharvbio.2020.111139
[17] Chen, H., Lin, Z., Tan, C. (2018). Fast quantitative detection of sesame oil adulteration by near-infrared spectroscopy and chemometric models. Vibrational Spectroscopy, 99: 178-183. https://doi.org/10.1016/J.VIBSPEC.2018.10.003
[18] Farres, S., Srata, L., Fethi, F., Kadaoui, A. (2019). Argan oil authentication using visible/near infrared spectroscopy combined to chemometrics tools. Vibrational Spectroscopy, 102: 79-84. https://doi.org/10.1016/J.VIBSPEC.2019.04.003
[19] Ferreiro-González, M., Espada-Bellido, E., Guillén-Cueto, L., Palma, M., Barroso, C.G., Barbero, G.F. (2018). Rapid quantification of honey adulteration by visible-near infrared spectroscopy combined with chemometrics. Talanta, 188: 288-292. https://doi.org/10.1016/j.talanta.2018.05.095
[20] Munawar, A.A., Meilina, H., Pawelzik, E. (2022). Near infrared spectroscopy as a fast and non-destructive technique for total acidity prediction of intact mango: Comparison among regression approaches. Computers and Electronics in Agriculture, 193: 106657. https://doi.org/10.1016/j.compag.2021.106657
[21] Munawar, A.A., Zulfahrizal, Z., Hayati, R. (2022). Agricultural products quality determination by means of near infrared spectroscopy. In IOP Conference Series: Earth and Environmental Science, 951(1): 012112. https://doi.org/10.1088/1755-1315/951/1/012112
[22] Liu, Y., Yao, L., Xia, Z., Gao, Y., Gong, Z. (2021). Geographical discrimination and adulteration analysis for edible oils using two-dimensional correlation spectroscopy and convolutional neural networks (CNNs). Spectrochimica Acta Part A: Molecular and Biomolecular Spectroscopy, 246: 118973. https://doi.org/10.1016/j.saa.2020.118973
[23] Rifna, E.J., Pandiselvam, R., Kothakota, A., Rao, K.S., Dwivedi, M., Kumar, M., Thirumdas, R., Ramesh, S.V. (2022). Advanced process analytical tools for identification of adulterants in edible oils–A review. Food Chemistry, 369: 130898. https://doi.org/10.1016/j.foodchem.2021.130898
[24] Moghaddam, H.N., Tamiji, Z., Lakeh, M.A., Khoshayand, M.R., Mahmoodi, M.H. (2022). Multivariate analysis of food fraud: A review of NIR based instruments in tandem with chemometrics. Journal of Food Composition and Analysis, 107: 104343. https://doi.org/10.1016/j.jfca.2021.104343
[25] Elzey, B., Pollard, D., Fakayode, S.O. (2016). Determination of adulterated neem and flaxseed oil compositions by FTIR spectroscopy and multivariate regression analysis. Food Control, 68: 303-309. https://doi.org/10.1016/j.foodcont.2016.04.008
[26] Jamwal, R., Kumari, S., Dhaulaniya, A.S., Balan, B., Kelly, S., Cannavan, A., Singh, D.K. (2020). Utilizing ATR-FTIR spectroscopy combined with multivariate chemometric modelling for the swift detection of mustard oil adulteration in virgin coconut oil. Vibrational Spectroscopy, 109: 103066. https://doi.org/10.1016/j.vibspec.2020.103066
[27] Kaufmann, K.C., Sampaio, K.A., García-Martín, J.F., Barbin, D.F. (2022). Identification of coriander oil adulteration using a portable NIR spectrometer. Food Control, 132: 108536. https://doi.org/10.1016/j.foodcont.2021.108536
[28] Mohammed, F., Guillaume, D., Warland, J., Abdulwali, N. (2021). Analytical methods to detect adulteration of argan oil: A critical review. Microchemical Journal, 168: 106501. https://doi.org/10.1016/j.microc.2021.106501
[29] Chen, H., Xu, L., Ai, W., Lin, B., Feng, Q., Cai, K. (2020). Kernel functions embedded in support vector machine learning models for rapid water pollution assessment via near-infrared spectroscopy. Science of the Total Environment, 714: 136765. https://doi.org/10.1016/j.scitotenv.2020.136765
[30] Tu, J., Xiao, L., Jiang, Y., He, Q., Sun, S., Xu, Y. (2015). Near-infrared fluorescent turn-on detection of paraquat using an assembly of squaraine and surfactants. Sensors and Actuators B: Chemical, 215: 382-387. https://doi.org/10.1016/j.snb.2015.04.015