Mehwash Farooqui![]() | Atta-ur Rahman*
| Atta-ur Rahman*![]() | Roaa Alorefan
| Roaa Alorefan![]() | Mariam Alqusser
| Mariam Alqusser![]() | Lubna Alzaid
| Lubna Alzaid![]() | Sara Alnajim
| Sara Alnajim![]() | Amal Althobaiti
| Amal Althobaiti![]() | Mohammed Salid Ahmed
| Mohammed Salid Ahmed![]()
© 2023 IIETA. This article is published by IIETA and is licensed under the CC BY 4.0 license (http://creativecommons.org/licenses/by/4.0/).
OPEN ACCESS
Calorie estimation is of significant importance in promoting a healthy lifestyle, as it enables individuals to effectively manage their weight. Applications that calculate caloric intake by analyzing food images have the potential to save users time and effort. Consequently, the primary objective of this study is the development of a model capable of identifying food classes from images. This classification model is crucial for the first step of calorie estimation applications. While numerous food classification datasets are available online, there is a paucity of food segmentation datasets. In response to this challenge, a novel dataset for food segmentation is presented, designed to facilitate the estimation of food quantities—a critical component of the second step in calorie estimation. The performance of the MobileNetV2 model was evaluated for food classification, yielding an optimal accuracy of 93.06% and a loss of 0.31. These promising experimental results demonstrate the potential of the approach in real-time environments.
image processing, deep learning, image classification, image segmentation dataset
The energy content of food is measured in calories or kilocalories (kcal), which serves as a useful tool for monitoring average daily caloric intake. Calorie counting is beneficial for individuals aiming to lose, gain, or maintain a healthy weight. Each person's daily caloric needs differ based on factors such as gender, height, weight, and activity level. Controlling daily caloric intake can help manage weight effectively. Calorie counting involves multiple algorithms, including object detection, and relies on databases storing caloric information for various products and components. When users photograph their meals, the application identifies the food and instantly calculates total calories consumed. Many health and diet applications rely on this technology to help users track their caloric intake and prevent overeating [1].
A nutritious diet is essential in today's world, and applications that provide vital information such as calorie counts and nutritional data can assist users in maintaining and improving their health. A significant limitation of these applications is the absence of an item counting algorithm, which can impact the accuracy of the counting process. Additionally, the information provided is often too generic, requiring users to manually select quantities. To address these issues, this study aims to develop an improved calorie-counting tool using an extreme programming approach, focusing on continuous improvement and testing for accuracy.
This paper is structured as follows: Section 2 presents a review of relevant literature; Section 3 describes the proposed model; Section 4 discusses the dataset, preprocessing, and performance metrics used in the study; Section 5 presents the results and discussion on experimental outcomes; and Section 7 concludes the paper.
Several studies have attempted to estimate food calories using various methodologies. Chokr and Elbassuoni [2] developed a model capable of predicting calories in single food items, such as pizza, doughnuts, burgers, fried chicken, sandwiches, and salads, using a subset of the Pittsburgh fast food dataset. Their approach achieved promising results, with a mean absolute error of 0.0933 using a Multilayer Perceptron (MLP). This model is employed in the MyFitnessPal application.
Liang et al. [3] utilized deep learning techniques for food classification and weight prediction. Their study aimed to develop an approach suitable for home cooking by creating a custom dataset. Their Convolutional Neural Network (CNN)-based method achieved good results, with R^2, RSME, MAE, and average error rate values of 0.95, 43, 32, and 0.09, respectively.
Isaksen et al. [4] proposed a pipeline for calorie estimation, involving food segmentation and classification, weight estimation, and calorie lookup in a database. Their approach achieved a food classification accuracy of 90.95% using inceptionResNetV2 on the Food-11 dataset, while segmentation accuracy ranged between 69.6% and 92.0%. The weight estimation standard error was 8.95%.
Poply [5] employed Mask R-CNN for food item detection and segmentation, calculating food item surface area and calories per square inch. Their approach achieved an average accuracy of 95.45% for single food items and 95.17% for entire meals.
Deshmukh et al. [6] utilized machine learning techniques for calorie estimation, using the ECUSTFD food dataset and Faster R-CNN for food item detection. Their system achieved a measuring error of less than 10% for each tested food item, indicating high efficiency.
Szegedy et al. [7] followed a pipeline involving food object identification, volume and mass calculation, and calorie extraction from a table. Their approach, using Faster R-CNN and the UNIMIB 2016 dataset, achieved 93.06% accuracy for calorie prediction.
Ibrahim et al. [8] employed a deep learning model, CNN, for fruit classification and fruit family identification, achieving promising results in terms of classification accuracy and precision. Arooj et al. [9] and Nasir et al. [10] investigated transfer learning and fine-tuning for breast cancer detection and prediction, respectively, obtaining high classification results. Rahman et al. [11] proposed an Electrocardiogram (ECG) classification technique using deep learning approaches and transfer learning methods, with promising detection accuracy.
Most previous research utilized food classification, food segmentation, or both to estimate food calories. However, creating a dedicated dataset for experimentation is time-consuming and costly. To calculate calories, it is crucial to know the food's area or region in the image, which depends on the total number of pixels covering the food area and the distance between the camera and the food item. In this paper, we present a novel dataset for food segmentation, simplifying the first step and allowing researchers to focus on determining the camera's distance from the food item. Table 1 summarizes the food calorie estimation approaches in the literature, detailing the methodology, dataset used, results, and limitations.
Table 1. Summary of calories estimation approaches
|
Ref. |
The main idea |
Techniques |
Dataset |
Results |
Limitations |
|
[2] |
The model can predict the amount of calories by identifying the object and estimating the size of a single food item. It doesn’t need any extra information except the food picture. |
Multilayer Perceptron. |
Pittsburgh fast food dataset. |
Mean absolute error 0.0933. |
Their data sets include images with a white background so that the background may affect the performance in real life. In addition, their prediction is based on an individual food item, and they only covered six types of fast food. |
|
[3] |
The user must take a picture of the dish, and then the object detection model will determine the location and category of the food in the image. So, use the weight prediction model to predict the weight. Then calculate the weight and calories of the whole dish by deep learning techniques to identify food categories and then estimate the food's calories. |
CNN |
Customized food dataset |
R2 is 0.95, RMSE is about 43, the mean absolute error (MAE) is about 32, and the average error rate is 9%. |
Their app requires a white plate to run excellently since their scenario focused on the home kitchen. So, they need to expand their database and modify their approaches to enhance their app to meet the need of several users. |
|
[4] |
The Pipeline of extracting calories will be first segmenting a picture, classifying each food item, estimating the weight according to size, and extracting calories from the database. |
InceptionResNetV2 for classification - Darkflow for segmentation |
Food-101, Food-11, (Kaggle) The foodX dataset they create it contains a ruler in each food picture. |
classification accuracy of 90.95 Segmentation accuracy 69.6 - 92.0% weight estimation standard error 8.95 |
The prediction of size was inferior for some types of food, such as drinks. The dataset included photos for the glass from the above only, so the network couldn’t estimate the height of glass they needed to extend their dataset with different angles for the same food item. |
|
[5] |
Their approach to calculate the calories was, to begin with, object segmentation. The output will be a mask on the surface area for each food object, then used the surface area (area calculation: by using reference object) to calculate the food size. Lastly, they predict the calories are in each food. |
Mask R-CNN |
UNIMIB 2016 |
Average accuracy 95.17% |
If the input picture does not have a reference object to determine pixel per square inch, the calculation will give the wrong result. |
|
[6] |
The user will click on the food image. The outline of the food image will detect, and the food volume will evaluate using algorithms and mathematical formulas to show the exact calorie output. |
Faster R-CNN And GrabCut segmentation algorithms |
ECUSTFD food data |
For all food items The measurement error was less than 10%. |
It is preferable to use a deep learning model for better accuracy. |
|
[12] |
Estimate the calories of the food via detecting dishes from the video stream captured, then counting the calories of each caught food by image-based food calorie estimation. Whereas AR DeepCalorieCam is an augmented reality (AR) version of DeepCalorieCam, a combination of calorie estimation and augmented reality (AR). |
They use YOLOv2, the state-of-the-art object detector using CNN. |
They collected calorie annotated recipe data from the online cooking recipe sites. |
The highest accuracy was 76.9%. |
They did not provide a counting algorithm. The calculation is based on assuming the serving size for one person. |
|
[13] |
They were building a model to estimate the calories of Chinese food based on food images and previous calorie data. The models also specify the name and recipe of Chinese food accurately. Finally, the model provides advice on the meal plan. |
CNN and SSD |
Western food (Food-101) https://www.kaggle.com/dansbecker/food-101 |
Highest accuracy = 97.56% |
The data set used factors that cause noise in the data, such as many objects in one image and blurred resolution in the images, which causes no differentiation between food categories. |
|
[14] |
A picture of a well-organized English breakfast plate will be an input for the model. It will Identify each food object and count how many portions or items from this specific food, then calculate the calories by retrieving them from the database |
Faster-RCNN |
USDA National Nutrient Database, which is a nutritional database https://fdc.nal.usda.gov/download-datasets.html |
High accuracy for object detection and moderate accuracy for object counting |
The object counting algorithm wasn’t explained very well as they explained the object detection techniques. They didn’t provide any numbers for accuracy, so it’s hard to compare with other works. They only focused on English breakfast. According to their result, object counting needs improvement. |
|
[15] |
The model input is a picture from the top of a plate with multiple food items. The model will identify each item on the plate, label it by image segmentation, estimate the volume and mess, and look for calories. |
Faster R-CNN, RefineNet methodology |
UNIMIB 2016 dataset http://www.ivl.disco.unimib.it/activities/food-recognition/ |
93.06% accuracy |
The data set used factors that cause noise in the data, such as many objects in one image and blurred resolution in the images, which causes no differentiation between food categories. |
This paper mainly focused on the models in order to have the best accuracy. To achieve the classification step, we tried several models and compared them to have the best accuracy. The approach was rather hit and trial and purely experimental and the models were built from the scratch. For instance, by means of transfer learning, the EfficientNet model, InceptionV3 model, and MobileNetv2 model were investigated. However, the results were not encouraging, so the models were fine-tuned to enhance the accuracy. Nonetheless, after applying the fine-tuning step to all models, the problem of overfitting appeared. Consequently, we found that the dataset was not clean. After cleaning, the results were completely different, and the best outcome was obtained by the MobileNetv2 model.
So the sequence of the experiments is explained here. Initially, the data was manually cleansed by deleting the irrelevant pictures. Then by using Python on Jupyter Notebook; we split the data into training, validation, and test sets. Then we applied the transfer learning on the pre-trained classification models by freezing all the layers except the last layer that we changed to fit our data; the freezing of the layers was done by assigning False to the model.trainable function. After the transfer learning, we applied fine-tuning by changing the model.trainable function to be True to increase the accuracy.
3.1 Inception V3
Inception is a CNN model developed by Google, and in its third version, published in 2015, it was trained on about one million images from the ImageNet dataset to classify images. It is considered one of the most famous models in this field and has been used in many applications related to image classification [7]. One of the reasons behind its popularity is its suitability for online and real life applications. In this work, we have utilized the model with its defalult parameters.
3.2 EfficientNet B0
EfficientNet is a convolutional neural network (CNN) architecture and scaling approach that utilizes a compound coefficient to scale all depth, width, and resolution dimensions uniformly. In the EfficientNet scaling method, network width, depth, and resolution are uniformly scaled using fixed scaling coefficients, in contrast to conventional practice, which arbitrarily scales these factors. However, base EfficientNet-B0 is built on the residual inverted bottleneck blocks of MobileNetV2 and squeeze-and-excitation blocks [8]. In the proposed framework, it was used for sake of its uniform nature and scaling approach to handle the food images dataset. As the dataset is comprised of different dimensional food images with various resolutions. In this way a model like this can justify the fairness.
3.3 MobileNet V2
MobileNet version 2 was published in April 2017 by a group of researchers from Google, is designed for embedded vision and mobile applications, and MobileNetV2 is considered a kind of convolutional neural network (CNN). They are established on a streamlined architecture that utilizes depth wise separable convolutions to construct lightweight deep neural networks with low latency for mobile and embedded machines [16-19]. In the proposed model, its utilization was making it the approach suitable for smartphone based apps.
The dataset used in this paper was a subset from the UPMC Food-101 dataset containing 101 food categories, most obtained from Google image search. The image classification model was trained on eight classes of this dataset which are carrot_cake, cheesecake, club_sandwich, donuts, falafel, greek_salad, hamburger, and pizza, where the segmentation dataset is made after putting the annotation on the eight classes dataset.
We used Quantigo's help to make the annotations, as they are a Supervisely-affiliated organization. They provide this service for a price, depending on the annotations type. The segmentation dataset is available at Kaggle [19] for download and use. The Figure 1 and Figure 2 display a sample of random images selected from both datasets, respectively.
Figure 1. Classification dataset
Figure 2. Segmentation dataset
4.1 Performance metrics
There are several performance metrics used in the studies involving classification and identification as given in the work [20-26]. Accuracy is a metric for describing how well the model performs across all classes. It is the proportion of correct predictions to total input samples as given in Eq. (1).
$Accuracy =\frac{\textit { Number of correct predictions }}{\textit { Total number of input samples }} \quad* 100$ (1)
Accuracy is worthwhile when all classes are treated equally. For instance, consider that we have a training set containing 95% samples of class Apple and 5% samples of class Orange. Then, by simply predicting every training sample belonging to class say Apple, the proposed model can easily achieve 95% training accuracy. While in the testing phase the proposed model with 60% samples of class A and 40% samples of class B, it will drop the test accuracy to nearly 60%.
Hence, Classification Accuracy can be wonderful but can give us a false sense of accomplishment, the impression that we have achieved high accuracy. In other words, the real problem arises when the cost of misclassification of the insignificant class samples is exceptionally high [27]. The average of the absolute differences between predictions and actual observations is known as the mean absolute error (MAE). That can give a better sense of experimental outcome for the problem at hand.
This, like Mean Square Error (MSE), measures the magnitude of errors without taking into account their direction. Unlike MSE, MAE requires more complex methods to compute the gradients, such as linear programming. Furthermore, because MAE does not require square, it is more resistant to outliers [28]. The said metrics are chosen based on the literature review where different approaches have chosen the said parameters for the similar type of analyses.
5.1 MobileNet V2
The curves depicted in Figure 3 reveal the training and validation behavior according to the accuracy and loss of the old dataset. After the fine-tuning, we see the performance improved and achieved higher accuracy than before, but overfitting occurred after fine-tuning.
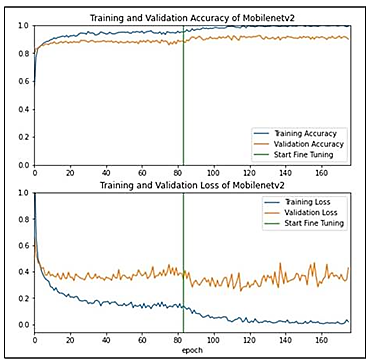
The curves shown in Figure 4, clarify the training and validation behavior according to the accuracy and loss with the new dataset. The model achieved high accuracy and increased more after the fine-tuning, and lines approximately fit each other. Moreover, the loss is decreased after fine-tuning, which means that the performance improved after the fine-tuning. MobileNetV2 model achieved the highest accuracy and the lowest loss.
Figure 3. MobileNetV2 curves - old dataset
Figure 4. MobileNetV2 curves - new dataset
In Table 2, the result after evaluating the model is displayed. We observe that both datasets show improved accuracies after fine-tuning. Moreover, the loss decreased slightly after the fine-tuning with the new dataset but increased with the old dataset.
Table 2. MobileNetV2 evaluation result
|
|
Before fine-tuning |
After fine-tuning |
||
|
|
Accuracy |
Loss |
Accuracy |
Loss |
|
Old dataset |
74.82% |
0.72 |
83.70% |
0.86 |
|
New dataset |
88.33% |
0.45 |
93.06% |
0.31 |
The best accuracy and loss we obtained were 93.06% and 0.31, respectively, from evaluating the MobileNetV2 model with the new dataset and after fine-tuning.
The main reason behind obtaining such good results is two fold. Firstly, the dataset is properly cleansed, which was not performed earlier. Secondly, the fine tuning in the model was not performed that was done later. Consequenlty, the big boost up in the accuracy has been observed.
Same was applied to the other two models and similar enhancements in the classification accuracy was evident as well. Apparently, cleansing followed by fine-tuning played the important role in the accuracy enhancement.
5.2 EfficientNet B0
The curves plotted in Figure 5, demonstrate the training and validation behavior according to the accuracy and loss of the old dataset. The lines are stable and approximately fit before the fine-tuning, but the accuracy is more petite. After the fine-tuning, the accuracy increased, but a little overfitting occurred as evident in Figure 5.
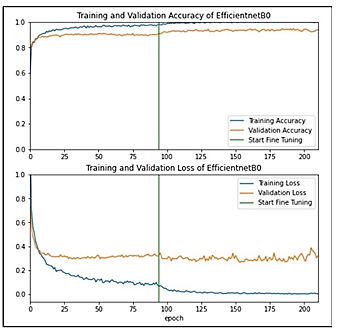
In the Figure 6 plot, the curves show the training and validation behavior according to the accuracy and loss with the new dataset. As the MobileNetV2 model with the new dataset, EfficientNetB0 also achieves high accuracy, and after the fine-tuning, it is increased more. The result of evaluating the model is illustrated in Table 3. We can see that both accuracies improved after fine-tuning, but the accuracy in the new dataset is slightly enhanced. The loss in both datasets increased after fin-tuning.
With this new dataset and after the fine-tuning, we find the best results for the EfficientNetB0 model are 92.78% accuracy and 0.41 loss after fine-tuning.
Figure 5. EfficientNetB0 curves - old dataset
Figure 6. EfficientNet B0 curves - new dataset
Table 3. EfficientNet B0 evaluation result
|
|
Before fine-tuning |
After fine-tuning |
||
|
|
Accuracy |
Loss |
Accuracy |
Loss |
|
Old dataset |
78.47% |
0.68 |
84.31% |
0.95 |
|
New dataset |
91.11% |
0.37 |
92.78% |
0.41 |
5.3 Inception V3
This plot in the Figure 7, illustrates the training and validation behavior according to the accuracy and loss with the old dataset. Before fine-tuning, the lines are stable, but after the fine-tuning, we can see there is overfitting since there is a large gap between the training and validation line.
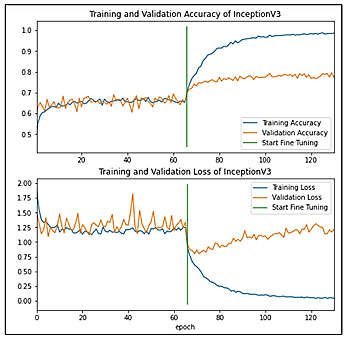
In the Figure 8 plot highlights the training and validation behavior according to the accuracy and loss with the new dataset. We can see how the performance improved, and there is no overfitting the gap between training and validation is normal. And we can see that the performance increase after the fine-tuning.
Table 4 shows the result after evaluating the model. We can notice a slight improvement after the fine-tuning with both datasets. But the loss is increased a little bit after the fine-tuning with the new dataset. The loss before fine-tuning is decreased by half with the new dataset, and there is a remarkable increase in the accuracy.
Figure 7. InceptionV3 curves - old dataset
Figure 8. InceptionV3 curves - new dataset
Table 4. InceptionV3 evaluation result
|
|
Before fine-tuning |
After fine-tuning |
||
|
|
Accuracy |
Loss |
Accuracy |
Loss |
|
Old dataset |
63.75% |
1.19 |
74.94% |
0.87 |
|
New dataset |
85.00% |
0.52 |
88.89% |
0.46 |
The best results we obtained from evaluating the InceptionV3 model with the new dataset after fine-tuning are 88.89% for accuracy and 0.46 for loss. In future, we are intended to investigate both the dataset with other models involving machine learning, deep learning, transfer learning, federated learning and deep extreme learning machines to further fine tune the results [12-15, 29-40]. As there is still a room for improvement in terms of addition of more food types like street foods, Chinese foods and continental foods etc. Moreover, the system should be able to grasp more accurate number of calories with respect to weight and size of the food.
This paper presented a food classification model, which is the first step to calculating calories using deep learning. We built and tested several models to get the highest possible accuracy, including inceptionv3, efficientB0, and MobileNetv2. After cleaning the dataset manually and performing fine-tuning to the models, MobileNetv2 achieved the best accuracy and loss, reaching 93.06% and 0.31, respectively. We investigated a dataset that includes annotations to train the segmentation models, which helps calculate calories according to the volume of the food in the image. Our future work will be training the annotation dataset and trying to obtain higher accuracy from the segmentation model. Moreover, advance classification techniques may also be investigated for the diverse datasets.
|
AI |
Artificial intelligence |
|
kcal |
Kilocalories |
|
CNN |
Convolutional neural network |
|
ANN |
Artificial neural network |
|
YOLO |
You Look Only Once |
|
SSD |
Single-shot detector |
|
AR |
Augmented Reality |
|
MAE |
Means absolute error |
|
OD |
Object detection |
|
BMI |
Body Mass Index |
|
FCN |
Fully Convolutional Networks |
|
GPU |
Graphics processing unit |
|
CPU |
Central processing unit |
|
CNN |
Convolutional neural network |
|
ANN |
Artificial neural network |
[1] How to count calories for weight loss or muscle gain, https://www.medicalnewstoday.com/articles/counting-calories, accessed on May 1, 2023.
[2] Chokr, M., Elbassuoni, S. (2017). Calories prediction from food images. In Proceedings of the AAAI Conference on Artificial Intelligence, 31(2): 4664-4669. https://doi.org/10.1609/aaai.v31i2.19092
[3] Liang, H., Gao, Y., Sun, Y., Sun, X. (2020). CEP: calories estimation from food photos. International Journal of Computers and Applications, 42(6): 569-577. https://doi.org/10.1080/1206212X.2018.1486558.
[4] Isaksen, R., Knudsen, E.B., Walde, A.I. (2019). A deep learning segmentation approach to calories and weight estimation of food images. Master's thesis, Universitetet i Agder; University of Agder. 93.
[5] Poply, P. (2020). An instance segmentation approach to food calorie estimation using mask r-cnn. In Proceedings of the 2020 3rd International Conference on Signal Processing and Machine Learning, pp. 73-78. https://doi.org/10.1145/3432291.3432295.
[6] Deshmukh, P.B., Metre, V.A., Pawar, R.Y. (2021). Caloriemeter: Food calorie estimation using machine learning. In 2021 International Conference on Emerging Smart Computing and Informatics (ESCI), Pune, India, pp. 418-422. https://doi.org/10.1109/ESCI50559.2021.9397023.
[7] Szegedy, C., Vanhoucke, V., Ioffe, S., Shlens, J., Wojna, Z. (2016). Rethinking the inception architecture for computer vision. In Proceedings of the IEEE Conference on Computer Vision and Pattern Recognition, Las Vegas, NV, USA, pp. 2818-2826. https://doi.org/10.1109/CVPR.2016.308
[8] Ibrahim, N.M., Gabr, D.G.I., Rahman, A.U., Dash, S., Nayyar, A. (2022). A deep learning approach to intelligent fruit identification and family classification. Multimedia Tools and Applications, 81(19): 27783-27798. https://doi.org/10.1007/S11042-022-12942-9.
[9] Arooj, S., Zubair, M., Khan, M.F., Alissa, K., Khan, M. A., Mosavi, A. (2022). Breast cancer detection and classification empowered with transfer learning. Frontiers in Public Health, 10: 924432. https://doi.org/10.3389/fpubh.2022.924432
[10] Nasir, M.U., Ghazal, T.M., Khan, M.A., Zubair, M., Rahman, A.U., Ahmed, R., Yeun, C.Y. (2022). Breast cancer prediction empowered with fine-tuning. Computational Intelligence and Neuroscience, 2022: Article ID 5918686. https://doi.org/10.1155/2022/5918686
[11] Rahman A.U., Asif R.N., Sultan K., Alsaif S.A., Abbas S., Khan M.A., Mosavi A. (2022). ECG Classification for Detecting ECG Arrhythmia Empowered with Deep Learning Approaches. Computational Intelligence and Neuroscience, 2022: Article ID 6852845. https://doi.org/10.1155/2022/6852845
[12] Tanno, R., Ege, T., Yanai, K. (2018). AR DeepCalorieCam: An iOS App for food calorie estimation with augmented reality. In MultiMedia Modeling: 24th International Conference, MMM 2018, Bangkok, Thailand, Proceedings, Part II 24, pp. 352-356. https://doi.org/10.1007/978-3-319-73600-6_31
[13] Hu, H., Zhang, Z., Song, Y. (2020). Image based food calories estimation using various models of machine learning. In 2020 5th International Conference on Mechanical, Control and Computer Engineering (ICMCCE), pp. 1874-1878. https://doi.org/10.1109/ICMCCE51767.2020.00411
[14] Woon, Z.L. (2020). Accurate calorie counting algorithm for carefuly plated dishes (Doctoral dissertation, UTAR). Thesis submitted to Faculty of Information and Communication Technology, Universiti Tunku Abdul Rahman, Malaysia.
[15] Poply, P., Jothi, J.A.A. (2021). Refined image segmentation for calorie estimation of multiple-dish food items. In 2021 International Conference on Computing, Communication, and Intelligent Systems (ICCCIS), Greater Noida, India, pp. 682-687. https://doi.org/10.1109/ICCCIS51004.2021.9397169
[16] Tan, M., Le QV, E. (1905). rethinking model scaling for convolutional neural networks. arXiv. 2019. https://arxiv.org/pdf/1905.11946v5.pdf
[17] Howard, A.G., Zhu, M., Chen, B., Kalenichenko, D., Wang, W., Weyand, T., Adam, H. (2017). MobileNets: Efficient convolutional neural networks for mobile vision applications. arXiv preprint arXiv:1704.04861. https://doi.org/10.48550/arXiv.1704.04861
[18] 14Sandler, M., Howard, A., Zhu, M., Zhmoginov, A., Chen, L.C. (2018). MobileNetv2: Inverted residuals and linear bottlenecks. In Proceedings of the IEEE Conference on Computer Vision and Pattern Recognition, pp. 4510-4520.
[19] https://www.kaggle.com/datasets/mm862215/food8-segmentation-dataset.
[20] Rahman, A.U., Abbas, S., Gollapalli, M., Ahmed, R., Aftab, S., Ahmad, M., Mosavi, A. (2022). Rainfall prediction system using machine learning fusion for smart cities. Sensors, 22(9): 3504. https://doi.org/10.3390/S22093504
[21] Alhaidari, F., Shaib, N.A., Alsafi, M., Alharbi, H., Alawami, M., Aljindan, R., Zagrouba, R. (2022). ZeVigilante: Detecting Zero-Day malware using machine learning and sandboxing analysis techniques. Computational Intelligence and Neuroscience, 2022: Article ID 1615528. https://doi.org/10.1155/2022/1615528.
[22] Jamal, M., Zafar, N.A., Atta-ur-Rahman, Musleh, D., Gollapalli, M.A., Chabani, S. (2022). Modeling and verification of aircraft take off through novel quantum nets. Computers, Materials and Continua, 72(2): 3331-3348. https://doi.org/10.32604/cmc.2022.025205
[23] Gollapalli, M., Musleh, D., Ibrahim, N., Khan, M.A., Abbas, S., Atta, A., Omer, A. (2022). A neuro-fuzzy approach to road traffic congestion prediction. Computers, Materials and Continua, 72(3): 1-16. https://doi.org/10.32604/cmc.2022.027925
[24] Rahman, A., Mahmud, M., Iqbal, T., Saraireh, L., Kholidy, H., Gollapalli, M., Musleh, D., Alhaidari, F., Almoqbil, D., Ahmed, M.I.B. (2022). Network anomaly detection in 5G networks. Mathematical Modelling of Engineering Problems, 9(2): 397-404. https://doi.org/10.18280/mmep.090213
[25] Ur, A., Rahman, S., Naseer, I., Majeed, R., Musleh, D., Gollapalli, M.A.S., Khan, M.A. (2021). Supervised machine learning-based prediction of Covid-19. Computers, Materials and Continua, 21-34.
[26] Dilawari, A., Khan, M.U.G., Al-Otaibi, Y.D., Rehman, Z.U., Rahman, A.U., Nam, Y. (2021). Natural language description of videos for smart surveillance. Applied Sciences, 11(9): 3730. https://doi.org/10.3390/app11093730
[27] https://towardsdatascience.com/metrics-to-evaluate-your-machine-learning-algorithm-f10ba6e38234
[28] Descending into ML: Training and Loss, https://developers.google.com/machine-learning/crash-course/descending-into-ml/training-and-loss, accessed on May 1, 2023.
[29] Alotaibi, S.M., Basheer, M.I., Khan, M.A. (2021). Ensemble machine learning based identification of pediatric epilepsy. Computers, Materials & Continua, 68(1): 149-165. https://doi.org/10.32604/cmc.2021.015976
[30] Zaman, G., Mahdin, H., Hussain, K., Abawajy, J., Mostafa, S.A. (2021). An ontological framework for information extraction from diverse scientific sources. IEEE Access, 9: 42111-42124. https://doi.org/10.1109/ACCESS.2021.3063181
[31] Alhaidari, F., Almotiri, S. H., Al Ghamdi, M.A., Khan, M.A., Rehman, A., Abbas, S., Khan, K.M. (2021). Intelligent software-defined network for cognitive routing optimization using deep extreme learning machine approach. Computers, Materials & Continua, 67(1): 1269-1285. https://doi.org/10.32604/cmc.2021.013303
[32] Khan, M.A., Saleem, M.A., Mushtaq, M.F., Rehman, A., Khan, M.F. (2020). Modelling and simulation of COVID-19 outbreak prediction using supervised machine learning. Computers, Materials and Continua, 66(3): 2397-2407. https://doi.org/10.32604/cmc.2021.014042
[33] Rahman, A. (2020). GRBF-NN based ambient aware real-time adaptive communication in DVB-S2. Journal of Ambient Intelligence and Humanized Computing, 1-11. https://doi.org/10.1007/s12652-020-02174-w
[34] Alhaidari, F., Rahman, A., Zagrouba, R. (2020). Cloud of Things: architecture, applications and challenges. Journal of Ambient Intelligence and Humanized Computing, 1-19. https://doi.org/10.1007/s12652-020-02448-3
[35] Rahman, A.U., Dash, S., Luhach, A.K. (2021). Dynamic MODCOD and power allocation in DVB-S2: A hybrid intelligent approach. Telecommunication Systems, 76: 49-61. https://doi.org/10.1007/s11235-020-00700-x
[36] Rahman, A.U., Dash, S., Luhach, A.K., Chilamkurti, N., Baek, S., Nam, Y. (2019). A Neuro-fuzzy approach for user behaviour classification and prediction. Journal of Cloud Computing, 8(1): 1-15. https://doi.org/10.1186/s13677-019-0144-9
[37] Rahman, A. (2019). Memetic computing based numerical solution to Troesch problem. Journal of Intelligent & Fuzzy Systems, 37(1): 1545-1554. https://doi.org/10.3233/JIFS-18579
[38] Rahman, A. (2019). Optimum information embedding in digital watermarking. Journal of Intelligent & Fuzzy Systems, 37(1): 553-564. https://doi.org/10.3233/JIFS-162405
[39] Nasir, M.U., Gollapalli, M., Zubair, M., Saleem, M.A., Mehmood, S., Khan, M.A., Mosavi, A. (2022). Advance genome disorder prediction model empowered with deep learning. IEEE Access, 10: 70317-70328. https://doi.org/10.1109/ACCESS.2022.3186998
[40] Rahman, A.U., Nasir, M.U., Gollapalli, M., Alsaif, S.A., Almadhor, A.S., Mehmood, S., Mosavi, A. (2022). IoMT-based mitochondrial and multifactorial genetic inheritance disorder prediction using machine learning. Computational Intelligence and Neuroscience, 2022: 2650742. https://doi.org/10.1155/2022/2650742