Juan Gabriel Rueda-Bayona*![]() | Julián Carrillo
| Julián Carrillo![]() | Juan José Cabello Eras
| Juan José Cabello Eras![]()
© 2023 IIETA. This article is published by IIETA and is licensed under the CC BY 4.0 license (http://creativecommons.org/licenses/by/4.0/).
OPEN ACCESS
The river deltas are hydrodynamic systems where high energy flux occurs due to the interaction of the river discharge, winds, water levels and wave field. This interaction triggers complex surface non-linear interactions that affect the wave parameters at the river delta, hence, non-linear analysis methods might ease the understanding of intricate surface ocean processes. Then, this research selected the Magdalena River delta to perform a novel application of a DOE-ANOVA. 23 factorial design using winds, surface currents, and water levels as factors and surface wave parameters such as significant wave heights and peak period as responses. The factor’s data was retrieved from calibrated and validated hydrodynamic modelling of the main climate seasons (February, June, and October, respectively) in 2010, which is the year reporting the lowest and highest water levels in the river before 2015. The DOE-ANOVA results evidenced that winds modulated the surface wave parameters suggesting quadruplets wave-wave interactions, white-capping dissipation, and a surface river plume curvature due to the wind effect. The water level and currents at the river delta controlled the wave parameters, modulating the wave energy distribution between kinetic and potential. Finally, this research expanded the use of the DOE-ANOVA factorial design through factors and responses handled in time series, what eased to analyze the cause and effect within complex ocean surface interactions among wind, currents, water levels and waves.
Delft3D, design of experiments hydrodynamics, river delta, tides, wind stress, waves
The growing worldwide awareness to reduce CO2 emissions and the recent proposition of China in considering the dual carbon goals for reaching a carbon neutrality [1], motivated the development of new projects for renewables, considering the impacts of these technologies on the human health and environment [2] and a fair access to it [3]. Herein, the marine energy technologies [4] participate in the world energy transition, where the maturity and development of these depends on applied research.
There exist limited but very important studies performed in Colombia about marine power potential [5], salinity gradient power [6, 7], wave power [8], offshore wind [9-11], tidal energy [12] and ocean thermal energy [13], what evidence the interest of the engineering community for the non-conventional energies. In this sense, engineering applications such as wave power extraction at rivers deltas require the understanding of the effects of atmospheric and ocean forcers over the surface wave parameters to reduce uncertainties of electricity generation because of the high nonlinearity of waves (e.g., whitecapping, quadruplets, triads) [14], where the proportion of the forcers over the wave parameters depends of the river delta configuration and climate variability [15, 16]. The effects of wind-waves-water levels nearby a river delta generate non-linear interactions over the wave hydrodynamics, that difficult the understanding of transport processes due to the complex met-ocean interactions [17].
The Magdalena River delta is located in the Colombian Caribbean shelf, and drives fresh water to the Caribbean Colombian coast, generating a triangular delta of 1,690 km2 [18]. The coastline associated with the deltaic system showed intense wave activity with 206 ergs s-1m-1 of power [19]. Coleman and Wright [19] categorized the river delta as a wave-dominated system. The Magdalena River mouth during January to April (windiest season) discharges 4360 m3s-1 of fresh water into the ocean [20], and its nearby wave field shows high energy because the surface wind stress generates wave heights up to 2.5 m [21]. During September to December (rainiest season), the high stream river flow of the Magdalena River delta discharges 8063 m3s-1 of fresh water [20], and its ocean hydrodynamic field exhibits low wave energy because moderate surface winds produce wave heights lower than 1.5 m [21]. A transition season occurs during May to August where river flows and wave heights are moderate with records within the limit range [22]. Local government studies established that the Magdalena River delta is influenced by three climate seasons governed by the local rainfall and surface winds [23, 24]: December-March (dry season), April-July (transition season), and August-November (wet season).
Bastidas-Salamanca and Rueda-Bayona [25] argued that the mesoscale climate of the Magdalena River delta is modulated by the Caribbean Low level jet which produces two representative climate seasons: dry (February) and wet (October). That research concluded that the climate variability in the study area is dominated by short, mid and long term scenarios, where the surface winds weaken during positive Atlantic Multidecadal Oscillation (AMO) and La Niña events. The same researchers pointed out that the surface winds in the Magdalena River delta shows a bimodal annual cycle with a maximum in February and the lowest magnitudes in October [26].
Studies related to the Magdalena River delta are limited because the zone exhibits a high-energy hydrodynamic field which triggers several security risks for the field campaigns. For example, the equipment deployment and measurements to perform hydrographic and oceanographic surveys in the Magdalena River mouth are highly restricted due to navigation security considerations, that limit the data collection periods. Restrepo et al. [27] measured just one-half of the tidal period because of the security restrictions in the channel. These restrictions have been overcome with the utilization of remote images such as the study of Moreno-Madriñán et al. [28] who used MODIS reflectance images as an indicator of the superficial sediment concentration of the Magdalena River discharge. Restrepo and López [29] characterized the marine climate in the Magdalena River mouth through remote sensing and time series analysis of river flows, sea levels, and wave fields. They utilized water level data (1954-2000) and wave data (1963-2000) for the climate analysis. These authors reported a significant wave height (Hs) at the delta of 2.1 m, an M2 tidal amplitude of 0.3 m, a mean sea water level of 0.62 m, a spring tide of 0.64 m, and a neap tide of 0.48 m. Restrepo et al. [30] applied MODIS satellite images to capture the space-time variability of the distribution of suspended sediment of the Magdalena River delta.
The application of hydrodynamic modelling is another alternative to face technical restrictions at river deltas and marine areas [31-39]. At the Magdalena River delta, Urbano-Latorre et al. [40] modelled the currents and wave field using the H2D [41] and SWAN models [42] but the model was not calibrated, then, the reported Hs and velocity currents were not compared with in-situ data to verify the numerical model accuracy. Ospino et al. [43] performed hydrodynamic modelling to analyse the saltwater intrusion into the Magdalena River delta and pointed that water levels and surface winds modulated the saltwater intrusion.
Advanced statistical techniques such as DOE-ANOVA are commonly used for analysing complex non-linear interactions among independent variables and their effect on dependent variables, hence for the proper application of this technique it must be verify the Central Limit Theorem (samples < 30) and the homoscedasticity, normality and independency tests [44]. The application of factorial DOE-ANOVA analysis is evidenced in several research topics of Oceanography and Ocean Engineering such as wave run-up, debris loads, coastal protection, naval design, and ocean modelling [45-51] However, the use of time series as factor and responses for factorial design and the use of DOE-ANOVA for analysing wind-currents-water levels effect over wave field have not been reported.
The studies of the Magdalena River abovementioned showed the complexity of the local hydrodynamic processes, the limitation of installing and deploying instruments for mid or long-term periods in the river channel and delta, the access restrictions to local databases, and the need for understanding the dynamic of surface wave parameters at river deltas. In this sense, the novelty of this research is the application of the DOE-ANOVA factorial design using continuous time-series as inputs for understanding complex met-ocean interactions at river deltas. Then, this study used time series with 1-hour time interval of surface winds, currents and water levels as factors and significant wave heights and peak periods as responses to identify the effect of wind-water level–current effects over the wave hydrodynamics in the nearby field of the Magdalena River delta.
The study area, data, numerical tools and the applied methodologies required for the multivariate analysis of the effect of factors (wind, currents, water levels) over the surface wave parameters are described in this section.
2.1 Study area
The study area is located at the Magdalena River mouth which discharges fresh water to the Colombian Caribbean Sea (Figure 1). A 3D hydrodynamic model implemented by Rueda-Bayona et al. [51] for the study area was applied for generating the input data for the DOE-ANOVA analysis. The model in that study was validated and calibrated for water levels using hourly in situ records of the 2012, what derived a determination coefficient of 0.79, with p-value ≪ 0.05 and 95% confidence. In addition, the calibration of waves heights required hourly in situ records of the 2009, which generated a determination coefficient of 0.70, with p-value ≪ 0.05 and 95% of confidence. The same model was validated by Rueda-Bayona [52] who compare along the river channel the numerical results against currents measured in 2010 by an ADCP (Acoustic Doppler Current Profiler), and found similar velocities nearby the river banks (0.15 m/s) and the thalweg (1 m/s).
The labelled places in Figure 1 denotes numerical control points (Bocas de Ceniza station, Casa pilotos, Punta Roca station, DIMAR buoy) for the validation process of the hydrodynamic numerical results generated in this study. The points 1 and 2 with depth of 9 m and 5.35 m are numerical control points (Figure 1) to generate time-series for assessing the wind-current-water level effects over the wave hydrodynamics through a further multivariate analysis. Technical specifications of the points will be described in the next section.
Figure 1. Location of the study area. Projected coordinates in Magna-Sirgas Bogota Zone; units in meters (Map data from Esri, Garmin, © OpenStreetMap contributors, and the GIS user community)
2.2 Model setup and validation
To construct the grid and water depth layers for the numerical models, this study extracted the bathymetry from the ETOPO1 database [53] and merged it with information of local nautical charts. The in situ bathymetry of the channel access and river mouth was provided by the Institute of Hydraulic and Environmental Research (IDEHA) at the Universidad del Norte (Colombia); the resulted bathymetry is showed in Figure 2.
Figure 2. Bathymetry of the Magdalena River delta and locations of point markers that represent distance in kilometres from the river mouth (kilometre 0 - K0)
Note: Projected coordinates in Magna-Sirgas Bogota Zone. The white area represents the dry zone delimited by the hydrodynamic model. The location of K0 correspond to the same location of Point 1 (Figure 1).
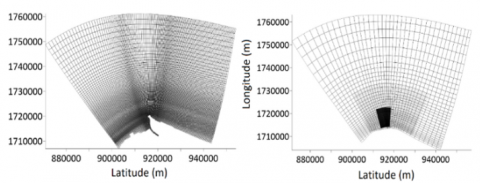
A curvilinear mesh was built for the flow module of Delft3D model with grid cell dimensions of 30 m × 30 m at the Magdalena River mouth, known as Bocas de Ceniza, and cells with dimensions of 550 m × 210 m for the outer area (Figure 3, left). The wave model included three nested grids: the biggest was 1.8 km × 1.8 km, the intermediate was 600 m × 600 m (Figure 3, right), and the smallest was like the hydrodynamic grid cells nearby to the Magdalena River mouth (Figure 3, left).
Figure 3. Grids model of Delft3D (left) and SWAN (right). Projected coordinates in Magna-Sirgas Bogota Zone (units in meters)
The salinity and temperature profiles used for the sea boundaries of the model were extracted from the World Ocean Atlas 2013 database. The salinity, temperature surface data used for the river boundary resulted from the water quality monitoring data system (REDCAM, in Spanish) database (https://siam.invemar.org.co/). Information of in-situ river flows was measured at the TEBSA hydrologic station [54] which were provided by the IDEHA laboratory (www.uninorte.edu.co) and were utilized as the input for the model boundary; the river flow time series were measured at hourly time-intervals for 2010 (Figure 4), the year with the highest river flow levels [52]. According to other studies the annual mean discharge is 7182±2644 m3/s, with variations between 4360 m3/s in the dry season (January) to 8063 m3/s in wet season (November) [20, 55], hence, the 2010 was an outlier year that deserved be analysed in this study.
Figure 4. In situ river flow data of the Magdalena River of 2010 year with hourly time-interval
The wind, solar radiation, cloud coverage, air temperature and relative humidity data required for the heat flux model of Delft3D was extracted from the NCEP North American Regional Reanalysis (NARR) database [56]. The ocean boundary for the wave model utilized online available data derived from the WAVEWATCH III model. The GRENOBLE model [57] was also utilized to generate water level time series for the ocean boundaries of the Delft3D model.
The Delft3D hydrodynamic (flow) module communicates in a two-way mode with the wave module (SWAN model), which solves the Action Balance Equation [58]. The flow module generates currents and water level data. Then, the wave module assimilates the information and solves the wave hydrodynamics. The two-way mode communication considers instantaneously the physics of wave-current interaction, decreasing the possibility of overestimating or underestimating waves, water level, or currents; the mathematics and fundamentals of Delft3D are described in more details in the user manuals [59]. The implemented model in this study was calibrated and validated by tunning the main parameters and physical processes as seen in Table 1.
Table 1. Tunned parameters of Delft3D model
|
Parameter |
Method / Value |
|
Bottom roughness |
Chezy/60 |
|
Stress formulation due to wave forces |
Fredsoe |
|
Horizontal eddy viscosity |
1 m2/s |
|
Horizontal eddy diffusivity |
10 m2/s |
|
Heat flux model |
Ocean |
|
Turbulence |
3D / k-epsilon |
|
Time step |
1 min |
|
Wave generation mode for physics |
3rd generation |
|
Depth-induced breaking |
B&J model [60] / Alpha 1, Gamma 0.73 |
|
Bottom friction |
JONSWAP / 0.067 m2s-3 |
|
Wind growth |
Activated |
|
Whitecapping |
Komen et al. [61] |
|
Wave propagation in spectral space |
Refraction, Frequency Shift |
|
Time step |
1 min |
|
Wind drag coefficients |
Breakpoint A / 0.0163, 0 m/s Breakpoint B / 0.014129, 10 m/s Breakpoint C / 0.014195, 20 m/s |
The 2D SWAN model faces restrictions during complex 3D processes generated by wave driven currents and enhanced turbulence, because the 2D vertical averaging does not consider the non-linear distribution of wave forces along the vertical axis [62], Then, to handle the above, it is recommended that numerical monitoring points would not be located in strong stratified layers, guarantying that water density profile will be more vertical (well mixed) and the 2D averaging approach would be adequate.
In the case of river deltas, the momentum flux of the river discharge concentrates near to the free surface, because of the lower density of fresh water compared to the seawater. Then, the highest energy and momentum transfer of the fresh water into the ocean occur at surface layers, which generate variations of wave energy in terms of potential energy (wave heights) and kinetic energy (wave periods). Accordingly, the wave tunning parameters is important to solve the radiation stress restriction in river deltas, therefore, the calibration and validation of wave models is mandatory to guarantee that the main quantity of energy flux is being captured by the modelled wave parameters (Hs, Tp) at the surface.
Table 2. In-situ sea surface temperature and salinity values for 2010 registered through directed measurement in the Magdalena River plume
|
Point |
Coordinates (WGS84 system) |
Temperature (℃) |
Salinity (ppt) |
|
Bocas de Ceniza (B) |
11°6'37.44"N 74°52'4.57"W |
28.2 |
1 |
|
Punta Roca |
11°2'51.54"N 74°52'38.02"W |
28.2 |
34 |
Source: [63]
Atmospheric and ocean parameters data was utilized to feed the flow module, then, the flow module delivered numerically modelled currents, winds, and tides to the wave module. The wave module received offshore wave data (WAVEWATCH III model) to solve the hydrodynamics and sending wave stress and wave transport data to the flow module.
The validation of the surface temperature and salinity numerical results for 2010 utilized the REDCAM database for comparison. This database is supported and supervised by the Colombian government for guaranteeing a high-quality data. Detailed information about REDCAM may be found on their institutional website (www.invemar.org.co). For the validation of salinity and temperature modelling results, two oceanographic stations of REDCAM were selected (Table 2).
2.3 Multivariate analysis
Considering the literature review of the introduction section, there were selected the most representative months of each climate season of the study area, to analyze the effect of met-ocean parameters on the surface wave parameters through a Design of Experiment (DOE) and Analysis of Variance (ANOVA). The representative months are February (dry season) as the windiest month, June (transition season) is a moderate month and October (wet season) is the rainiest.
Then, this study performed 3 experiments through the DOE-ANOVA to assess quantitatively the effect of wind, water level and currents over the wave parameters such as Hs and Peak wave period (Tp). The objective of a factorial DOE-ANOVA analysis is to identify the effect of factors on the response of dependent variables. The DOE-ANOVA factorial design for this study considered factors (continuous independent variables) to the current velocity (A), water level (B), u-wind speed (C) and v-wind speed (D) (Table 3), and Hs and Tp as response parameters (continuous dependent variables); the second order of factors (AA, BB, CC, DD) and their interactions were considered. Three experiment compounds the DOE-ANOVA taking the 3 main climate seasons of the study area: dry (February), transition (June) and wet (October). The assumptions of normality, independence and homoscedasticity were verified before performing the experiments.
The first and second order factor are the following: current velocity (A, AA), water level (B, BB), u-wind speed (C, CC), v-wind speed (D, DD).
Table 3. DOE-ANOVA factorial design
|
Experiment |
Runs (records) |
Elapsed time (hh-dd/mm/yyyy) |
Current velocity (m/s) |
Water level (m) |
U-wind speed (m/s) |
V-wind speed (m/s) |
||||
|
low |
high |
low |
high |
low |
high |
low |
high |
|||
|
February |
672 |
01-01/02/2010 to 00-1/03/2010 |
0.01 |
1.81 |
-0.08 |
0.42 |
-1.34 |
9.21 |
-0.20 |
12.21 |
|
June |
720 |
01-01/06/2010 to 00-01/07/2010 |
0.05 |
1.86 |
-0.08 |
0.47 |
-2.30 |
5.81 |
-0.30 |
9.61 |
|
October |
744 |
01-01/10/2010 to 00-1/11/2010 |
0.18 |
2.09 |
-0.03 |
0.76 |
-2.07 |
5.85 |
-0.30 |
10.06 |
The DOE-ANOVA factorial design considered two levels (low, high) with continuous runs (hourly) without replication. The data for the response variables (Hs, Tp) was retrieved from the two numerical control points (Point 1 and 2) of the study area (Figure 1).
The statistical results of the DOE-ANOVA factorial design were analysed through Pareto charts and main effect plots. The Pareto charts show the absolute values of the standardized effects and their statistical significance (p-value < 0.005), and the main effect plots show the shape (linear, convex-concave curves) of the dependent variable response (Hs, Tp).
After the definition of the study area and the implementation of the numerical model, a hydrodynamic numerical validation is performed through the comparison of numerical results against hydrodynamic in situ records and satellite imagery. During the validation, the numerical results of water levels, and the modelled sea surface salinity (SSS) and temperature (SST) considering local in-situ databases and the results of other studies are revised. After the numerical validation, the wave fields of the three seasons for the further DOE-ANOVA analysis are analysed.
Hydrodynamic numerical validation
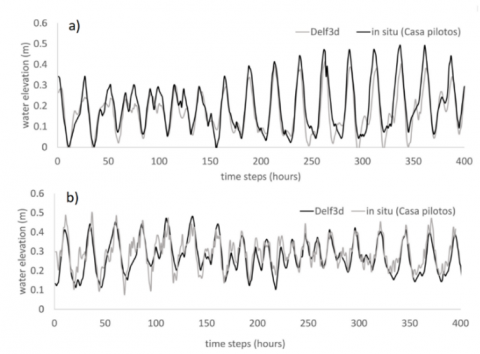
This study validated the water levels for June and October 2010 (Figure 5); the water level simulation results (Figure 5a) for June 2010 compared to the in-situ measurements of the Casa Pilotos station (Figure 1) indicated a determination coefficient of 0.78. Additionally, the validation of October 2010 (Figure 5b) showed a lower determination coefficient of 0.70, which could be generated by human errors because the water level was measured through direct observations using a fixed rule. Furthermore, the Form Factor F [64] calculated from the simulated water level indicated a mixed semi and micro diurnal tide.
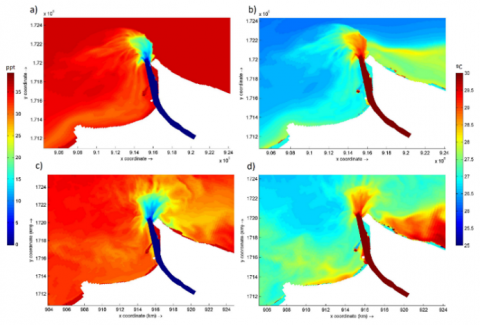
The validation of SSS and SST evidenced that during February 2010, the surface modelled thermohaline values (Figure 6) from K0 to K6 of the Magdalena River channel (Figure 2) were similar to the findings of Alvarez-Silva and Osorio [65] and Restrepo et al. [55]. On February 4th, the surface salinity distribution along the river channel from the river mouth (K0) up K10 (Figure 2) varied between 0.1 and 5 (Figure 6a). The modelled salinity of the surface Magdalena River plume also showed values between 10 ppt and 32 ppt, which were like the numerical results [43].
Figure 5. Water level validation from in-situ records of Casa Pilotos station; (a) June 1st to 17th of 2010; (b) October 9th to 25th of 2010
Figure 6. Surface hydrodynamic modelling for February 4th of 2010 at 2300 hr (a) Salinity (ppt); (b) Temperature (℃), and February 24th of 2010 at 0000 hr; (c) Salinity (ppt); (d) Temperature (℃)
Note: The white area represents the dry zone delimited by the hydrodynamic model.
Salamanca et al. [66] measured surface salinity and temperature at two stations in the Magdalena River mouth; one located inside the channel (river area) and the other was located beside the channel (sea area). The salinity in the river area during February 4th and 24th reported in that study was like the findings of this research (Figure 6 a, c) with values varying between 0.1 ppt and 0.5 ppt. The modelled salinity on February 4th and 24th of this study was also similar to the measurements performed by Salamanca et al. [66] in the sea locations with 34 ppt and 30 ppt of salinity respectively. Besides, the surface temperature for February 4th and 24th measured in that study varied between 26℃ and 28℃, that range was like the numerical results of this study (Figure 6 b, d).
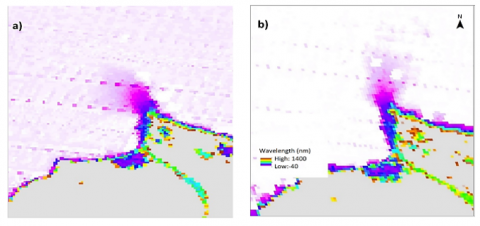
This research analysed two MODIS reflectance images (modis.gsfc.nasa.gov/data/dataprod/mod09.php) of February 2010 to visualize the effect of winds over the surface Magdalena River plume. (Figure 7). Low reflectance values are an indicator of a more turbid surface water because of the surface albedo reduction, so the purple values indicated a darker surface colour that could be associated with a high turbidity due to the effect of the surface sediment plume. In this sense, the image of February 4, 2010 (Figure 7 a) showed low reflectance values (purple) pointing that the river plume turned to the west.
From January to March, northeast trade winds predominate over the study area with maximum velocities between 4.5 m/s and 6.1 m/s [23]. As a result, the local hydrodynamics under the effect of winds (Figure 6) depicts a curvature of the surface Magdalena River plume (Figure 7 a).
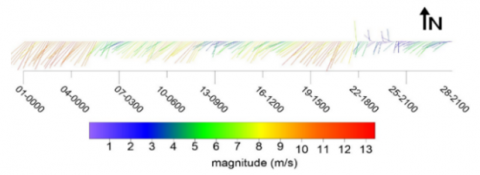
Figure 8 shows wind vectors from north-northeast during February 2010, with maximum velocities up to 13 m/s during the first and third week. From the 22nd to the 28th, the wind vectors decreased in magnitude and changed the direction for the 23rd and 24th. The change in wind direction (Figure 8) from northeast to the south allowed to the Magdalena River discharge arriving at the ocean without the curvature (Figure 6 c,d). Considering the influence of wind on the river discharge, it is important noticing that the seasonal variability of local winds strongly modulates the hydrodynamics and surface transport in the study area.
The modelled surface salinity distribution of February 2010 (Figure 6 a, c) showed the wind effect on the study area during February 4th; the wind predominated from the northeast (Figure 8), which curved the surface river plume to the west. In contrast, on February 24th, the wind predominated from the south, allowing a uniform discharge (radial) and reducing the salinity values in the eastern coastal zones (Figure 6b). The comparison between in situ measurements in Bocas de Ceniza station and modelled salinity and temperature (Figure 6) showed that the implemented model was able to simulate the surface thermohaline levels associated with the local characteristics. Additionally, the modelled surface thermohaline of the Punta Roca station, located further from the river mouth, performed similarly to the in-situ REDCAM information for February 24th (Figure 6 c, d). Consequently, this study evidenced the effect of wind, water level and currents over the nearby wave field and the surface Magdalena River plume.
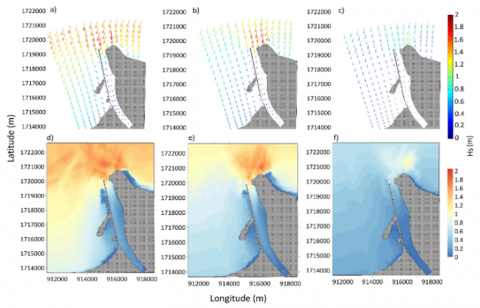
After the validation of water levels and surface salinity-temperature numerical results in the study area, the nearby wave field from the river delta was analysed. As a result, it was observed that wave vectors in the access channel predominated from the north-northeast during all the sea states (Figure 9), entering the river and diffracting to the left side of the channel (left jetty). The wave field during the dry season of 2010 (February) showed wave heights with maximum values of 2 m in front of K0 (Figure 9 a). Then, the numerical model indicated wave heights with a mean value of 0.37 m and a minimum of 0.05 m inside the river channel; the modelled area nearby the Casa Pilotos station showed a wave height of 0.77 m. The wave heights in the access channel (K-1.5) were maximum during the dry season (Figure 9 d) due to the wind effect from January to March.
For the transition season (June) of 2010 at the Casa Pilotos station, maximum, mean, and minimum wave heights were 0.62 m, 0.34 m, and 0.16, respectively (Figure 9 b), with vector directions like February (Figure 9 a). Finally, the wet season at the Casa Pilotos station (Figure 9 c and Figure 9 f) featured wave heights of 0.6 m, 0.35 m, and 0.01 m, respectively, with vectors’ directions similar to the other two seasons (Figure 9 a, b).
Figure 7. Data pixels (a) MODIS band 2 satellite image for February 4th 2010; (b) MODIS band 2 satellite image for February 24th 2010
Figure 8. Surface wind vectors during February 2010 over Magdalena River delta
Figure 9. Modelling of wave field during 2010; (a) vectors on February 21th 1300 hr; (b) vectors in June 16th 1300 hr; (c) vectors in October 21th 1300 hr; (d) Hs (m) in February 21th 1300 hr; (e) Hs (m) in June 16th 1300 hr; (f) Hs (m) in October 21th 1300 hr.
Note: Projected coordinates in Magna-Sirgas Bogota Zone (units in meters).
DOE-ANOVA analysis
To analyze the effect of wind-currents-water level on the surface wave parameters at the study area, a multivariate statistical analysis was performed in this study. The first (e.g., A) and second order effects (e.g., AA) of the independent variables produced a higher effect over the response when compared to the combine effects (e.g., AB). In this sense. the combined effects scatter the influence of the independent variables over the response of the dependent variables. Herein, the DOE-ANOVA showed that during February (dry season), the Hs of the Point 1 and 2 is positive and directly affected by v-wind speed (+D, +DD), and by u-wind speed (+C) only at Point 1 (Table 4). The Tp at Point 1 decreases with the increment of current velocity (-AA) and u-wind speed (-CC), in contrast, the Tp at Point 2 decreases when v-wind speed increases (-C, -D).
Table 4. Standardized effects of wind, water level and currents (factors) over Hs and Tp (responses)
|
Point 1 |
Point 2 |
|||
|
Experiment |
Hs |
Tp |
Hs |
Tp |
|
February (dry season) |
-AC, -AA, +C, -CC, +DD |
-AC, -CC, -AA |
+C, +CC, +DD |
-C, +AC, +AD, -D, -CC, -BD, +A |
|
June (transition season) |
-A, -B, +AB, +AC, +CD, - |
+A, -BB, -C. +CC, -BC, -D, -B |
+AA, -AB, -AC, +CD |
-AA, -BB, +A, -BC, +CC, +AB |
|
October (wet season) |
+C, +AA, -A, +CC |
+DD, +CC (not statistically significant) |
+C, +CC, -AB. +AA |
+AB, +CC (not statistically significant) |
Note: The + and - signs indicates a positive and negative standardized effect. A second order effect of factors over the responses is identified by a double letter (i.e., AA, BB, CC, DD) and combined effects by two letters (i.e., +AD, -AC).
Figure 10. Pareto charts and main effect plots of Point 1 (a, b, c, d) and Point 2 (e, f, g, h) for June (transition season) in 2010
In June (transition season), the Hs at Point 1 decreases due to the increment of current velocity and water levels (-B, -A), with a reduced wind speed effect (+AC, +CC) (Table 4, Figure 10). At the Point 2, the Hs changes non-linearly (convex) with the increment of current velocity (+AA) and behaves linearly positive with the direct effect of wind speed (+CC, +DD). The Tp at Point 1 rises with the increment of current velocity (+A) and falls when water levels increase (-B, -BB). For the Point 2, Tp changes non-linearly (concave) because of the rise of current velocity (-AA) and water levels (-BB). In the wet season (October), the Hs at the Point 1 (Table 4,) decreases when the current velocity increases, and behaves non-linear (convex) predominantly positive with the increment of wind-speed (+C, +CC). The Hs at the Point 2 rises and performed convex because of wind speed (+CC). The response of Tp at Points 1 and 2 was not statistically significant, hence, the effect of factors on the Tp was not proved.
The higher standardized effects were found in June when the flow river discharge and winds were not stronger than Februarys’ nor lower than Octobers’. In this sense, the Pareto charts and main effect plots of June are depicted in Figure 10 to visualize the statistical significance and the linear and non-linear behaviour (convex, concave) of the Hs and Tp due to the effect of winds, water levels and currents.
According to the DOE-ANOVA for Points 1 and 2 (Table 4), it was evidenced that the factors (wind, water level, currents) induced differently the responses of Hs and Tp. The Point 1 is located aside of the Magdalena River’s mouth (Figure 1) under the direct effect of currents of surface plume which increase the sea water level in the nearby field, then, waves at this point are dissipated due to the flow river discharge and because of changes in bathymetry that produces energy dissipation (shoaling and refraction). The Point 2 is located further from the river mouth at a zone without important changes of bathymetry toward the river mouth. In this sense, this location is less affected by the surface river plume that reduces the wave energy due to the opposite current and the increment of the water level. When direction of currents is opposite to the wave direction, occurs a choke because of the encountering (convergence) of kinetic energy vector of currents and waves. This choke provokes a redistribution of kinetic wave energy to potential, what is observed in the increment of wave heights and the decrement of wave celerity. When currents and waves propagate with same direction, the kinetic energy of wave increase, extracting its potential energy and reducing its wave heights.
The Magdalena River mouth increases the freshwater discharge from February (minimum) to December (Figure 4), being October the starting month of the wet season (high precipitations). Because the winds of the study area are associated with the Interconvergence Tropical Zone (ICTZ) [67, 68], the winds and flow river are directly opposite. In this sense, the low flow river discharge during February (windiest season) allows to the strong winds forcing to curve the surface river plume to left, easing the wave propagation into the coast. After the dry season, the winds decrease up to December and the river flow increases, causing the reduction of the wave energy due to a stronger opposite current. Regarding to the response of Tp, it was evidenced that the current velocity and water level increase it with some non-linearities due to the complex hydrodynamic interactions. In contrast, the wind speed reduces the Tp because the local wind forcing generates momentum that redistributes the wave energy frequencies.
The main and second-order effects found in the DOE-ANOVA of this study (Table 4) evidenced that river discharge transferred energy into the ocean, through the velocity currents (kinetic energy) and water level changes (potential energy). That energy transfer reduces notably the energy frequency distribution of waves during most of the year, which is evidenced in the increment of Tp and the reduction of Hs when flow river discharge increases.
The local wind field significantly affects the wave field during the dry season (February) increasing the Hs and reducing the Tp by the momentum transfer. Similarly, to the findings reported by Rueda-Bayona et al. [51], DOE-ANOVA analysis showed second-order standardized effects related to extreme wave events that occurred in February, probably pointing to the presence of quadruplets wave-wave interactions and white-capping dissipation that redistribute the frequencies along the wave spectra.
The reduction of water levels and the Magdalena River flow allowed to the wind intensifying the local wave field, consequently, the wave height increased, and the breaking zone moved closer to the access river channel (K0). During the transition season, winds decreased, and river flow increased, generating a decrement of the wave potential energy at the river delta. In the wet season, the wind speed decreased but the river flow showed maximum records, which reduced the wave heights at the river mouth. Accordingly, the wave field of the Magdalena River delta was modulated by the wind and river flows during all the three seasons. In this sense, the winds modulated (rise) the wave energy potential during the dry season (Figure 9d), and during the wet season, the river flows reduced the wave heights that could move the breaking zone further from K0 (Figure 9f).
Considering that the study area is dominated by the Caribbean Low level jet, the intrusion and curvature of the Magdalena River delta will depend of the river’s flow controlled by the precipitations of the upper basin during the wet season (October), and the highest wind stress over the river delta during the dry season (February). That explain the predominance of the river’s flow and surface winds over the wave parameters because of the first and second order effects seen in February and October (Figure 10, Table 4). The water level factor during these two seasons (dry, wet) had not an important contribution over the response of wave parameters. However, during the transition season (June), the water levels had a more important contribution being the second factor, after the velocity currents, which influenced the behaviour of the Hs and Tp.
The results of DOE-ANOVA (Table 3) allowed to identify the effects of the three main factors (A, B, C and D) over the wave parameters in the study area (Hs, Tp), where the first and second order effects of one factor (e.g., C, CC) revealed the direct effect of the factor (e.g., u-wind) on the response (e.g., Hs). Then, the three performed experiments showed that dry season exhibited the most statistical significance of the effect of winds and currents compared to the transition and wet season. In this sense, during the dry season at the two points (Table 4), the winds intensify the Hs (+C) and reduce the Tp (-C, -D), which suggest that kinetic wave energy is reduced and transferred to the potential wave energy. In the transition season, currents, and water level controls the wave energy, where the kinetic energy (in terms of Tp) at Point 1 is reduced and potential energy is incremented (in terms of Hs), and the kinetic energy at Point 2 decreases and the potential energy rises. In the wet season, the winds (+C) increase the potential energy at Points 1 and 2, due to the wind stress push the waves against to the intensified flow of the river delta, which increase the wave heights and provoke a rapid redistributed wave frequencies because of the river-waves encounter. This rapid redistribution of wave frequencies associated to a turbulent and complex hydrodynamic field was evidenced using the results of the DOE-ANOVA for October (Table 4), where there was not significant statistical evidence that wind, currents and water levels influenced the Tp in the study area.
Three numerical runs were performed for the dry (February), transition (June), and wet (October) seasons of 2010 to generate the time series of water levels, surface currents, Hs, and Tp, using a multivariate analysis through a DOE-ANOVA factorial design. The modelled results of surface temperature-salinity and their validation with satellite imagery evidenced the wind effect on the surface distribution of the Magdalena River plume. The strong winds of February caused a curvature over the surface river plume and reduced the surface temperature of the coastal zones because of the wind cooling effect as well. The maximum wave heights were observed during the dry season (February), with 1.98 m in front of Bocas de Ceniza (K0). The DOE-ANOVA analysis pointed the significant effect of surface winds over the Hs and Tp during the dry season (February), increasing the wave energy potential and the wave frequency distribution. During the transition (June) and wet season (October), the river discharge reduces the Tp and Hs of the nearby field, which is evidenced in the predominance of current velocity and water level standardized effects.
The novel application of a DOE-ANOVA factorial design using time series as factor-response seen in this study allowed to analyze the complex surface interactions of surface met-ocean parameters at the Magdalena River delta. The DOE-ANOVA showed the effects of key factors (winds, surface currents, water levels) on the surface wave parameters, which is important for analysing the variability of the wave energy potential for future marine energy projects. The identified effects of winds, currents and water levels on the wave parameters evidenced the transfer of wave energy between kinetic and potential. In dry season the potential wave energy (high wave heights) predominates; in transition season, kinetic and potential predominates depending on the location, and the potential energy predominates during the wet season. Finally, the DOE-ANOVA may be considered a valuable tool for understanding complex energy transfer processes for marine and coastal research, and for the planning of engineering activities such as dredging, coastal restoration, identifying potential locations for wave energy harvesting, and selecting the proper wave technology depending on the main extracting mechanism (kinetic, potential).
[1] Huo, X., Jiang, D., Qiu, Z., Yang, S. (2022). The impacts of dual carbon goals on asset prices in China. Journal of Asian Economics, 83: 101546. https://doi.org/10.1016/j.asieco.2022.101546
[2] Rueda-Bayona, J.G., Eras, J.J.C., Chaparro, T.R. (2022). Impacts generated by the materials used in offshore wind technology on human health, natural environment and resources. Energy, 261: 125223. https://doi.org/10.1016/j.energy.2022.125223
[3] Eras, J.J.C., Fandino, J.M.M., Gutiérrez, A.S., Bayona, J.G.R., German, S.J.S. (2022). The inequality of electricity consumption in Colombia. Projections and implications. Energy, 249: 123711. https://doi.org/10.1016/J.ENERGY.2022.123711
[4] Opeyemi, B.M. (2021). Path to sustainable energy consumption: The possibility of substituting renewable energy for non-renewable energy. Energy, 228: 120519. https://doi.org/10.1016/j.energy.2021.120519.
[5] Osorio, A.F., Ortega, S., Arango-Aramburo, S. (2016). Assessment of the marine power potential in Colombia. Renewable and Sustainable Energy Reviews, 53: 966-977. https://doi.org/10.1016/j.rser.2015.09.057
[6] Roldan-Carvajal, M., Vallejo-Castaño, S., Álvarez-Silva, O., Bernal-García, S., Arango-Aramburo, S., Sánchez-Sáenz, C.I., Osorio, A.F. (2021). Salinity gradient power by reverse electrodialysis: A multidisciplinary assessment in the Colombian context. Desalination, 503: 114933. https://doi.org/10.1016/j.desal.2021.114933
[7] Alvarez-Silva, O., Maturana, A.Y., Pacheco-Bustos, C.A., Osorio, A.F. (2019). Effects of water pretreatment on the extractable salinity gradient energy at river mouths: The case of Magdalena River, Caribbean Sea. Journal of Ocean Engineering and Marine Energy, 5: 227-240. https://doi.org/10.1007/s40722-019-00141-y
[8] Ortega, S., Osorio, A.F., Agudelo, P. (2013). Estimation of the wave power resource in the Caribbean Sea in areas with scarce instrumentation. Case study: Isla Fuerte, Colombia. Renewable Energy, 57: 240-248. https://doi.org/10.1016/j.renene.2012.11.038
[9] Ruiz, S.A.G., Barriga, J.E.C., Martínez, J.A. (2021). Wind power assessment in the Caribbean region of Colombia, using ten-minute wind observations and ERA5 data. Renewable Energy, 172: 158-176. https://doi.org/10.1016/J.RENENE.2021.03.033
[10] Devis-Morales, A., Montoya-Sánchez, R.A., Bernal, G., Osorio, A.F. (2017). Assessment of extreme wind and waves in the Colombian Caribbean Sea for offshore applications. Applied Ocean Research, 69: 10-26. https://doi.org/10.1016/j.apor.2017.09.012
[11] Rueda-Bayona, J.G., Guzmán, A., Eras, J.J.C., Silva-Casarín, R., Bastidas-Arteaga, E., Horrillo-Caraballo, J. (2019). Renewables energies in Colombia and the opportunity for the offshore wind technology. Journal of Cleaner Production, 220: 529-543. https://doi.org/10.1016/J.JCLEPRO.2019.02.174
[12] Aguilar, G.E.Q., Bayona, J.G.R. (2021). Tidal energy potential in the center zone of the colombian pacific coast. INGE CUC, 17(2): 65-75. https://doi.org/10.17981/ingecuc.17.2.2021.07
[13] Devis-Morales, A., Montoya-Sánchez, R.A., Osorio, A.F., Otero-Díaz, L.J. (2014). Ocean thermal energy resources in Colombia. Renewable Energy, 66: 759-769. https://doi.org/10.1016/j.renene.2014.01.010
[14] Dong, S., Gong, Y., Wang, Z., Incecik, A. (2019). Wind and wave energy resources assessment around the Yangtze River Delta. Ocean Engineering, 182: 75-89. https://doi.org/10.1016/j.oceaneng.2019.04.030
[15] Restrepo, J.D., Kjerfve, B., Correa, I.D., González, J. (2002). Morphodynamics of a high discharge tropical delta, San Juan River, Pacific coast of Colombia. Marine Geology, 192(4): 355-381. https://doi.org/10.1016/S0025-3227(02)00579-0
[16] Ávila, B., Gallo, M.N. (2021). Morphological behavior of the Magdalena River delta (Colombia) due to intra and interannual variations in river discharge. Journal of South American Earth Sciences, 108: 103215. https://doi.org/10.1016/J.JSAMES.2021.103215
[17] Valle-Levinson, A., Schettini, C.A., Truccolo, E.C. (2019). Subtidal variability of exchange flows produced by river pulses, wind stress and fortnightly tides in a subtropical stratified estuary. Estuarine, Coastal and Shelf Science, 221: 72-82. https://doi.org/10.1016/j.ecss.2019.03.022
[18] Coleman, J. (1981). Deltas: Processes of Deposition and Models for Exploration. Springer Dordrecht, 2nd ed.
[19] Coleman, J.M., Wright, L.D. (1975). Modern river deltas: variability of processes and sand bodies. In Deltas: Models for Exploration. Edited by M.L. Broussard. 99-149.
[20] Higgins, A., Restrepo, J.C., Ortiz, J.C., Pierini, J., Otero, L. (2016). Suspended sediment transport in the Magdalena River (Colombia, South America): Hydrologic regime, rating parameters and effective discharge variability. International Journal of Sediment Research, 31(1): 25-35. https://doi.org/10.1016/j.ijsrc.2015.04.003
[21] Ortiz-Royero, J.C., Otero, L.J., Restrepo, J.C., Ruiz, J., Cadena, M. (2013). Characterization and effects of cold fronts in the Colombian Caribbean Coast and their relationship to extreme wave events. Nat. Hazard. Earth Syst. Sci. Discuss, 1(4): 3659-3687. https://doi.org/10.5194/nhessd-1-3659-2013
[22] Otero, L.J., Ortiz-Royero, J.C., Ruiz-Merchan, J.K., Higgins, A.E., Henriquez, S.A. (2016). Storms or cold fronts: What is really responsible for the extreme waves regime in the Colombian Caribbean coastal region? Natural Hazards and Earth System Sciences, 16(2): 391-401. https://doi.org/10.5194/nhess-16-391-2016
[23] DIMAR-CIOH CIOH. Climatología de Los Principales Puertos Del Caribe Colombiano – Barranquilla, 2010.
[24] DIMAR-CIOH Climatología de Los Principales Puertos Del Caribe Colombiano – Cartagena, 2010.
[25] Bastidas-Salamanca, M., Rueda-Bayona, J.G. (2021). Effect of climate variability events over the colombian caribbean offshore wind resource. Water, 13(22): 3150. https://doi.org/10.3390/w13223150
[26] Bastidas-Salamanca, M., Bayona, J.G. (2021). Pre-feasibility assessment for identifying locations of new offshore wind projects in the Colombian Caribbean. International Journal of Sustainable Energy Planning and Management, 32: 139-154. https://doi.org/10.5278/ijsepm.6710
[27] Restrepo, J.C., Schrottke, K., Traini, C., Ortíz, J.C., Orejarena, A., Otero, L., Marriaga, L. (2016). Sediment transport and geomorphological change in a high-discharge tropical delta (Magdalena River, Colombia): Insights from a period of intense change and human intervention (1990-2010). Journal of Coastal Research, 32(3): 575-589. https://doi.org/10.2112/jcoastres-d-14-00263.1
[28] Moreno-Madriñán, M.J., Rickman, D.L., Ogashawara, I., Irwin, D.E., Ye, J., Al-Hamdan, M.Z. (2015). Using remote sensing to monitor the influence of river discharge on watershed outlets and adjacent coral Reefs: Magdalena River and Rosario Islands, Colombia. International Journal of Applied Earth Observation and Geoinformation, 38: 204-215. https://doi.org/http://dx.doi.org/10.1016/j.jag.2015.01.008
[29] Restrepo, J.D., López, S.A. (2008). Morphodynamics of the pacific and caribbean deltas of colombia, South America. Journal of South American Earth Sciences, 25(1): 1-21. https://doi.org/10.1016/j.jsames.2007.09.002
[30] Restrepo, J.D., Escobar, R., Tosic, M. (2018). Fluvial fluxes from the Magdalena River into Cartagena Bay, Caribbean Colombia: Trends, future scenarios, and connections with upstream human impacts. Geomorphology, 302: 92-105. https://doi.org/10.1016/j.geomorph.2016.11.007
[31] Luan, H.L., Ding, P.X., Wang, Z.B., Yang, S.L., Lu, J.Y. (2018). Morphodynamic impacts of large-scale engineering projects in the Yangtze River delta. Coastal Engineering, 141: 1-11. https://doi.org/10.1016/j.coastaleng.2018.08.013
[32] Gabriel Rueda-Bayona, J., Fernando Osorio-Arias, A., Guzmán, A., Rivillas-Ospina, G. (2019). Alternative method to determine extreme hydrodynamic forces with data limitations for offshore engineering. Journal of Waterway, Port, Coastal, and Ocean Engineering, 145(2): 05018010. https://doi.org/10.1061/(asce)ww.1943-5460.0000499
[33] Tu, L.X., Thanh, V.Q., Reyns, J., Van, S. P., Anh, D. T., Dang, T. D., Roelvink, D. (2019). Sediment transport and morphodynamical modeling on the estuaries and coastal zone of the Vietnamese Mekong Delta. Continental Shelf Research, 186: 64-76. https://doi.org/10.1016/j.csr.2019.07.015
[34] van Rijn, L.C., Walstra, D.J.R., van Ormondt, M. (2007). Unified view of sediment transport by currents and waves. IV: Application of morphodynamic model. Journal of Hydraulic Engineering, 133(7): 776-793. https://doi.org/10.1061/(ASCE)0733-9429(2007)133:7(776)
[35] Pandoe, W.W., Edge, B.L. (2008). Case study for a cohesive sediment transport model for Matagorda Bay, Texas, with coupled ADCIRC 2D-transport and SWAN wave models. Journal of Hydraulic Engineering, 134(3): 303-314. https://doi.org/10.1061/(ASCE)0733-9429(2008)134:3(303)
[36] Garcia, M., Ramirez, I., Verlaan, M., Castillo, J. (2015). Application of a three-dimensional hydrodynamic model for San Quintin Bay, BC, Mexico. Validation and calibration using OpenDA. Journal of Computational and Applied Mathematics, 273: 428-437. https://doi.org/10.1016/j.cam.2014.05.003
[37] Parsapour-Moghaddam, P., Rennie, C.D. (2018). Calibration of a 3D hydrodynamic meandering river model using fully spatially distributed 3D ADCP velocity data. Journal of Hydraulic Engineering, 144(4): 04018010. https://doi.org/10.1061/(ASCE)HY.1943-7900.0001424
[38] Des, M., DeCastro, M., Sousa, M.C., Dias, J.M., Gómez-Gesteira, M. (2019). Hydrodynamics of river plume intrusion into an adjacent estuary: The Minho River and Ria de Vigo. Journal of Marine Systems, 189: 87-97. https://doi.org/10.1016/j.jmarsys.2018.10.003
[39] Rueda-Bayona, J.G., Horrillo-Caraballo, J., Chaparro, T.R. (2020). Modelling of surface river plume using set-up and input data files of Delft-3D model. Data in Brief, 31: 105899. https://doi.org/10.1016/j.dib.2020.105899
[40] Latorre, C.P.U., Díaz, L.J.O., Lonin, S. (2013). Influencia de las corrientes en los campos de oleaje en el área de Bocas de Ceniza, Caribe Colombiano. Boletín Científico CIOH, 31: 191-206.
[41] GIOC The H2D Long Wave Propagation Model. (1990). https://www.tesisenred.net/bitstream/handle/10803/35687/3de9.MLSCcap3.pdf?sequence=4, accessed on May 22, 2023.
[42] Booij, N.R.R.C., Ris, R.C., Holthuijsen, L.H. (1999). A third-generation wave model for coastal regions: 1. Model description and validation. Journal of Geophysical Research: Oceans, 104(C4): 7649-7666. https://doi.org/10.1029/98JC02622
[43] Ospino, S., Restrepo, J.C., Otero, L., Pierini, J., Alvarez-Silva, O. (2018). Saltwater intrusion into a river with high fluvial discharge: A microtidal estuary of the Magdalena River, Colombia. Journal of Coastal Research, 34(6): 1273-1288. https://doi.org/10.2112/jcoastres-d-17-00144.1
[44] Montgomery, D.C. (2017). Design and Analysis of Experiments. 9 Edition, John Wiley & Sons, Inc.: Hoboken, NJ, USA.
[45] Power, H.E., Gharabaghi, B., Bonakdari, H., Robertson, B., Atkinson, A.L., Baldock, T.E. (2019). Prediction of wave runup on beaches using Gene-Expression Programming and empirical relationships. Coastal Engineering, 144: 47-61. https://doi.org/10.1016/j.coastaleng.2018.10.006
[46] Derschum, C., Nistor, I., Stolle, J., Goseberg, N. (2018). Debris impact under extreme hydrodynamic conditions part 1: Hydrodynamics and impact geometry. Coastal Engineering, 141: 24-35. https://doi.org/10.1016/j.coastaleng.2018.08.016
[47] Hanley, M.E., Hoggart, S.P.G., Simmonds, D.J., Bichot, A., Colangelo, M.A., Bozzeda, F., Thompson, R.C. (2014). Shifting sands? Coastal protection by sand banks, beaches and dunes. Coastal Engineering, 87: 136-146. https://doi.org/10.1016/j.coastaleng.2013.10.020
[48] Fragasso, J., Moro, L., Lye, L.M., Quinton, B.W. (2019). Characterization of resilient mounts for marine diesel engines: Prediction of static response via nonlinear analysis and response surface methodology. Ocean Engineering, 171: 14-24. https://doi.org/10.1016/j.oceaneng.2018.10.051
[49] Young, D.L., Scully, B.M. (2018). Assessing structure sheltering via statistical analysis of AIS data. Journal of Waterway, Port, Coastal, and Ocean Engineering, 144(3): 04018002. https://doi.org/10.1061/(ASCE)WW.1943-5460.0000445
[50] Kotroni, V., Lagouvardos, K., Lykoudis, S. (2014). High-resolution model-based wind atlas for Greece. Renewable and Sustainable Energy Reviews, 30: 479-489. https://doi.org/10.1016/j.rser.2013.10.016
[51] Rueda-Bayona, J.G., Guzmán, A., Cabello Eras, J.J. (2020). Selection of JONSWAP spectra parameters during water-depth and sea-state transitions. Journal of Waterway, Port, Coastal, and Ocean Engineering, 146(6): 04020038. https://doi.org/10.1061/(asce)ww.1943-5460.0000601
[52] Rueda Bayona, J.G. (2017). Identificación de la influencia de las variaciones convectivas en la generación de cargas transitorias y su efecto hidromecánico en las estructuras Offshore. Universidad del Norte.
[53] https://www.ngdc.noaa.gov/mgg/global/, accessed on May 20, 2023.
[54] Ruíz, M.J. IDEAM-Instituto de Hidrología, Metereología y Estudios Ambientales.
[55] Restrepo, J.C., Schrottke, K., Traini, C., Bartholomae, A., Ospino, S., Ortíz, J.C., Orejarena, A. (2018). Estuarine and sediment dynamics in a microtidal tropical estuary of high fluvial discharge: Magdalena River (Colombia, South America). Marine Geology, 398: 86-98. https://doi.org/10.1016/j.margeo.2017.12.008
[56] Mesinger, F., DiMego, G., Kalnay, E., Mitchell, K., Shafran, P.C., Ebisuzaki, W., Shi, W. (2006). North American regional reanalysis. Bulletin of the American Meteorological Society, 87(3): 343-360. https://doi.org/10.1175/BAMS-87-3-343
[57] Le Provost, C., Genco, M.L., Lyard, F., Vincent, P., Canceil, P. (1994). Spectroscopy of the world ocean tides from a finite element hydrodynamic model. Journal of Geophysical Research: Oceans, 99(C12): 24777-24797. https://doi.org/10.1029/94JC01381
[58] Holthuijsen, L.H. (2010). Waves in oceanic and coastal waters. Cambridge university press.
[59] Deltares, D.F. (2013). Simulation of multi-dimensional hydrodynamic flows and transport phenomena, including sediments. Deltares, Rotterdamseweg, The Netherlands, 1-706.
[60] Battjes, J.A., Janssen, J.P.F.M. (1978). Energy loss and set-up due to breaking of random waves. In Coastal Engineering, 569-587. https://doi.org/10.1061/9780872621909.034
[61] Komen, G.J., Hasselmann, S., Hasselmann, K. (1984). On the existence of a fully developed wind-sea spectrum. Journal of Physical Oceanography, 14(8): 1271-1285. https://doi.org/10.1175/1520-0485(1984)014<1271:oteoaf>2.0.co;2
[62] Deltares, D.W. (2014). Simulation of shore-crested waves with SWAN—user manual. Version, 3, 34160.
[63] Ordóñez, O.G., Arenas, M.R.B., Olaya, V.C., Rueda, R. (2018). INVEMAR Diagnóstico y Evaluación de La Calidad Ambiental Marina En El Caribe y Pacífico Colombiano. Red de Vigilacia Para La Conservación y Protección de Las Aguas Marinas y Costeras de Colombia. Diagnóstico Nacional y Regional 2010.
[64] Pugh, D.T. (1996). Tides, surges and mean sea-level (reprinted with corrections). https://doi.org/10.1016/0264-8172(88)90013-X
[65] Alvarez-Silva, O., Osorio, A.F. (2015). Salinity gradient energy potential in Colombia considering site specific constraints. Renewable Energy, 74: 737-748. https://doi.org/10.1016/j.renene.2014.08.074
[66] Salamanca, J.M., Álvarez-Silva, O., Tadeo, F. (2019). Potential and analysis of an osmotic power plant in the Magdalena River using experimental field-data. Energy, 180: 548-555. https://doi.org/10.1016/j.energy.2019.05.048
[67] Poveda, G., Jaramillo, L., Vallejo, L.F. (2014). Seasonal precipitation patterns along pathways of South American low-level jets and aerial rivers. Water Resources Research, 50(1): 98-118. https://doi.org/10.1002/2013WR014087
[68] Henao, F., Viteri, J.P., Rodríguez, Y., Gómez, J., Dyner, I. (2020). Annual and interannual complementarities of renewable energy sources in Colombia. Renewable and Sustainable Energy Reviews, 134: 110318. https://doi.org/10.1016/j.rser.2020.110318