Elisa Kusrini![]() | Vembri Noor Helia*
| Vembri Noor Helia*![]() | Suci Miranda
| Suci Miranda![]() | Fahrul Asshiddiqi
| Fahrul Asshiddiqi![]()
© 2023 IIETA. This article is published by IIETA and is licensed under the CC BY 4.0 license (http://creativecommons.org/licenses/by/4.0/).
OPEN ACCESS
Measuring supply chain performance is crucial for enhancing competitiveness. The Supply Chain Operations Reference (SCOR) model is a widely adopted approach for evaluating supply chain performance. To facilitate successful implementation of the SCOR model, APICS has developed a straightforward, five-stage methodology known as the SCOR Racetrack, which includes defining the scope, configuring the supply chain, optimizing the project, and preparing for implementation. This paper presents a case study examining the application of SCOR 12 using the SCOR Racetrack methodology within a leather craft small and medium enterprise (SME). The study aims to improve Asset Management Efficiency Performance through a series of steps, beginning with scope definition, supply chain configuration, project optimization, and concluding with readiness for implementation. The case study demonstrates that performance improvement of AM.1.2 Return on Supply Chain Fixed Assets (ROF) can be achieved, reaching an 11.9% target through three distinct projects: developing marketing strategies, enhancing brand awareness, and implementing budgeting analysis. It is estimated that executing the marketing strategy will increase ROF by 1%. In subsequent racetrack stages, the SME can undertake the second and third projects to attain the desired 11.9% ROF target. Further exploration is recommended for applying SCOR 12 across various industries and projects to augment their competitive performance.
Supply Chain Operation Reference (SCOR), SCOR racetrack, supply chain, performance measurement, return on supply chain fixed assets (ROF)
Performance measurement is essential for enhancing business performance in competitive environments [1-3], particularly in light of globalization, value creation, and networking within multicultural business contexts [4]. By providing critical feedback for decision-makers, performance measurement can illuminate potential strategic management opportunities and success metrics, as well as facilitate a deeper understanding of problems [5]. Moreover, it enables organizations to concentrate management attention, refine company objectives, and reengineer business processes [6-8]. In order to bolster supply chain performance, it is crucial to establish an effective supply chain performance measurement system that ensures high customer satisfaction levels [9, 10], promotes social and environmental sustainability [11, 12], considers dynamic capabilities [13], and fosters resilience [14].
The Supply Chain Operations Reference (SCOR) model is a prominent and widely adopted approach for measuring and improving supply chain performance [15]. Initiated by the Supply Chain Council (SCC), the SCOR model provides a comprehensive description of the operational aspects of supply chain management (SCM) [16]. As the most recognized and consistent SCM framework, the SCOR model encompasses business processes determined by activities such as Plan, Source, Make, Deliver, Return, and Enable. Performance is gauged by factors including reliability, responsiveness, flexibility, cost, and asset management efficiency [17].
However, the SCOR model lacks practical measurement instructions, which can lead to confusion during implementation. To address the shortcomings of the SCOR model and ensure its successful deployment, APICS developed a straightforward, five-stage methodology known as the SCOR Racetrack. This framework offers guidance for enhancing supply chain performance through detailed steps, ranging from defining the scope of the supply chain and identifying performance indicators in need of improvement, to determining the best alternative improvements for implementation [17]. This study presents an examination of SCOR implementation using the Racetrack methodology within a small and medium enterprise (SME) context. The objective of this paper is to derive insights from a case study on improving supply chain performance using the SCOR Racetrack, which can serve as a guide for achieving excellence in performance. This aligns with related research on SCOR that connects processes and strategies to drive performance improvements [18]. A project aimed at enhancing asset management efficiency performance will be undertaken through a series of steps based on the SCOR Racetrack.
2.1 Studies on performance measurement using SCOR
The SCOR model serves as a method for evaluating the effectiveness of supply chains across industries, encompassing management, business processes, and responsiveness to market demands. SCOR possesses the necessary attributes for managing commercial activities to fulfill client requirements and is regularly updated to adapt to changes in supply chain business processes. By employing SCOR, organizations can gain a competitive advantage [19], making it more applicable to various sectors than other supply chain performance monitoring methodologies [20, 21]. SCOR has also been utilized in developing countries to measure supply chain performance [22, 23], assess potential impacts on supply chain management [24], and address implementation challenges [25].
At present, numerous leading companies and organizations have adopted the SCOR framework [20, 26]. Research on performance measurement using SCOR has been conducted in diverse areas, including oil and gas companies [27], the steel industry [24, 28], the textile industry [29], the leather industry [22], and the batik industry [30]. However, when implementing the SCOR model, companies employ various approaches, often combining SCOR with other methods such as the Balanced Scorecard [31], Technique for Order Preference by Similarity to Ideal Solution (TOPSIS) [28], Quality Function Deployment [32], Analytical Hierarchy Process (AHP) [33, 34], and simulations with SCOR [35].
2.2 SCOR racetrack
The Supply Chain Operation Reference (SCOR) Model contains methodologies, diagnostics, and benchmarking tool that helps companies create improvement projects in the supply chain process. The SCOR Racetrack model contains steps to create a supply chain performance improvement program using the methodology and standards for performance, process, practice, and people in SCOR 12. The method is divided into five distinct phases [17].
Figure 1. SCOR racetrack's step [17]
(1) Pre-SCOR program
At this stage is preparing the organization in order to have a mission of improvement efforts.
(2) Setting the scope of the project
Describe the processes and business environment in which the supply chain operates and select products for certain market segments whose performance will be improved.
(3) Configure the supply chain
At this stage, the selection of performance attributes is carried out, followed by measuring the gap using benchmarking. Then an analysis is carried out to obtain alternative for improvement.
(4) Optimize projects
The focus on this stage is grouping performance gaps into projects. Then, a metric benefit for each project will be calculated. So, we can prioritize projects into implementations.
(5) Ready for implementation
Implementing a project based on result from previous steps. Once completed the project, team can start to initiate a new improvement cycle in a repeated racetrack program. The details of the process can be seen in Figure 1.
2.3 SCOR as supply chain performance measurement
The performance element of SCOR is concerned with the measurement and assessment. A full technique for measuring, evaluating, and diagnosing supply chain performance consists of three components. The three components include Performance Attributes, Metrics, and Process [17].
Performance attribute is strategic supply chain performance which is used to link supply chain performance with company strategy. SCOR 12 has five performance attributes that can be seen in Table 1. Metrics are performance measures that consist of several hierarchical levels. Every company has objective. An objective is a specific description used to evaluate how well a supply chain business process is performing and incorporates a process model for accepted best practice and leading practice.
In each performance attribute there are one or more strategic metrics. This metric serves as a tool to measure hierarchically and can estimate effectiveness in achieving market goals. SCOR classifies measurements into three categories: level 1, level 2, and level 3. Interactions between these levels are informative. Level-2 metrics serve as checkpoints for level-1 measures. This means that looking at the performance of level-2 measurements can help explain performance gaps or increases for level-1 indicators. Metric decomposition or root-cause analysis are terms used to describe this type of supply chain performance study. Similarly, level-3 measurements serve as diagnostics for level-2 measures. A measure's level is encoded in the metric's codification.
Table 1. Performance attribute
|
Performance attribute |
Definition |
|
Reliability |
The ability to execute tasks in the desired order. The emphasis of dependability is on the predictability of a process's output. On-time delivery, the right amount, and the right quality are all classic signs of reliability. |
|
Responsiveness |
The frequency with which tasks are accomplished. The speed with which a supply network delivers things to a customer. One example is cycle-time measurements. |
|
Agility |
The ability to adjust to external circumstances as well as market changes in order to gain or maintain a competitive advantage. SCOR Agility metrics include Adaptability and overall value at risk. |
|
Costs |
The expense of carrying out supply chain processes. This includes labor, material, management, and transportation costs. |
|
Asset Management |
Asset management is related to the efficiency of the use of resources. Starting from reducing inventory and using in-sourcing and out-sourcing approaches. Examples of measures for asset management include inventory days of supply and asset utilization rates. |
The aim of this paper is to obtain lessons learned from a case in effort to improve supply chain performance using SCOR racetrack. A case study in craft industry small-medium enterprise for improving performance will be presented. This research methodology employs SCOR Racetrack, which consist of steps starting from setting the scope, configure the supply chain, optimize the project, and ready for implementation.
3.1 Set the scope
The business environment in each company is assessed at this stage. Then, it is equipped with an improvement program using SCOR. Some activities must be done, including:
(1) Business summary
SWOT analysis is an analysis to see the competitive position of a business using strengths, weaknesses, opportunities, and threats.
(2) Supply chain mapping
The process of mapping the supply chain by identifying the main raw material suppliers and other materials, products, channel partners and customers. Also equipped with data on the organizational structure of marketing, procurement, and types of services for these products.
(3) Prioritizing the supply chain
It is important to recognize that not all supply chains provide comparable value or profit to the business, therefor team improvement need to prioritizing product or segment market to be selected for improvement. Some quantitative criteria may be utilized to determine ranking.
(4) Geographical mapping
Geographical mapping aims to:
·Visualization of all company activities
·Visualization of exchange of information on supply chain actors
·Know the identification of products and services sold to supply chain channels
·Knowing the relationship in the SCOR process and its supply chain actors
(5) Performance data
The stage for collecting company performance data and to find out performance gaps.
(6) Defining scope
The activity at this stage is to create a scope for performance improvement programs, metrics, schedules, activities, resources, benefits, and so on related to the scope of the project.
3.2 Configure the supply chain
Six main activities in this stage are as follows:
(1) Kickoff meeting.
(2) Selecting the SCOR performance attribute.
(3) Collecting detail data and gather specific information.
(4) Benchmarking to competitors or different standards.
(5) Gap analyzing to describe what performance need to be focuses on improvement program.
(6) Preparing for the next stage.
3.3 Optimize the project
The optimize the project stage includes identifying the benefits and costs of measuring the data obtained in the previous stage. Those with the highest gaps become priority projects that require improvement.
3.4 Ready for implementation
At this stage it shows that the project team has approved the improvement project to be carried out, where the project will provide great benefits. The time frame, team members, and so on have readiness for implementation. The stages are as follows:
(1) Initiate project Kickoff.
(2) Create a project schedule.
(3) Adherence to SCOR level 3 and level 4 based on best practices.
(4) Construct, test, pilot product, and deploy solutions.
(5) Begin next project.
In this research, a case study of improving the performance of asset management efficiency in one of the small medium enterprises (SME) in Yogyakarta, one of the provinces in Indonesia using a SCOR racetrack has been carried out. This SME produce many craft product made from leather. This product is sold directly to customers and sold to other SMEs (business to business) using make to stock and make to order.
During pandemic covid-19, this SME experiencing marketing loss and therefore their income declined drastically in 2020. Many orders were canceled, and as a result, this SME received fewer orders. Based on interview with the owner, he wanted to increase their revenue. Based on SCOR Racetrack version 12.0, the first step to improve performance is set the Scope. In this step, business context summary, supply chain and geographical mapping are developed and used as a consideration in determining priority product and market segments to be improved (prioritizing supply chain). Based on historical sales data, bags, apparel and wallet are the most sold products contributing 67% of revenue. The biggest market segments are Jakarta and Jogjakarta. Therefore, the scope of this project improvement is how to improve revenue for the three products in market Jakarta and Jogjakarta.
The next step is configuring the supply chain with the main objective is to select the SCOR performance attribute and benchmark with other competitors or standard performance to obtain gap data as a basis for improvement. The performance attribute that corresponds to this problem is the asset management efficiency with level 1 metric, namely AM.1.2 Return on Supply Chain Fixed Assets. The calculation of Return on Supply Chain Fixed Assets (ROF) is as follows.
ROF = (Supply Chain Revenue - Total Cost to Serve) Supply chain fixed asset (1)
where, ROF=(113,913,500-119,609,175)/299,000,000, ROF=-0.019=-1.9%.
AM.1.2 Return on Supply Chain Fixed Asset is minus 1.9 percent. Total revenue supply chain is IDR113,913,500 and the total cost is IDR119,609,175. The issue arises because the cost of serving exceeds supply chain income. Based on this calculation, a gap analysis is carried out by comparing the actual ROF value with the target. The internal ROF target is 10 percent. Therefore, there is a gap 11.9 percent. Based on this gap, an analysis is carried out to find the cause of this gap. project improvement will focus on increasing ROF by 11.9 percent.
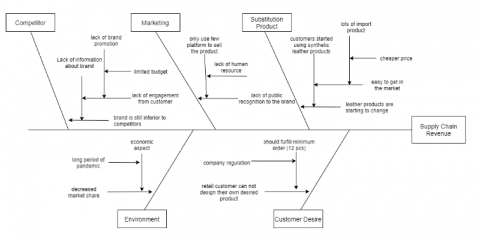
To analyze the causes of the gap, fishbone diagram analysis was used through interviews with SME’s owners. Fishbone analysis produces three root causes, namely marketing strategy, public recognition and labor costs as depicted in Figure 2. To overcome the source of problems, three improvement projects are proposed: Develop marketing strategy, improve brand awareness, and develop budgeting analysis.
Figure 2. Fishbone diagram for ROF
The next step is to optimize the project. In this process, the selection of alternative improvements is carried out in terms of risks and benefits that will be obtained when implementing these improvements. Because the three projects are urgent to be carried out to increase revenue, then all projects will be implemented. This project is grouped based on the process and the similarity of the problems. Improvement project for develop marketing strategy and improve brand awareness are grouped into plan process, while develop budgeting analysis is group in to make process.
The final step is ready for implementation to ensure supply chain readiness to undertake improvement projects. The tool used at this stage is Readiness Check which consists of Vision, Incentives, Resources, Skills, and Action plans. The SME is ready to implement the project base on 5 variables of readiness.
In order to determine which project will be implemented first, the priority matrix analysis which considers return, effort and risk by giving a rating of 1 (low) to 5 (high) for each project. Projects with low risk & effort and high returns will be selected as the first projects to be implemented.
Based on the analysis of return, effort and risk, the recommended project to be implemented is project 1, followed by project 3 and project 2. Therefore, the development of marketing strategy will be implemented in this SME to increase ROF. Marketing strategy has a significant direct impact on brand equity and has an indirect impact on corporate image [36]. The marketing strategies referred to here include channel performance, value-oriented, price, promotion, and after-sales service. Therefore, companies need to focus on improving their marketing strategies in order to have brand equity and a strong corporate image to support a sustainable competitive advantage. Marketing that is successful and can improve company performance is a customer-based marketing strategy [37].
In addition, operational efficiency and differentiation are needed as the key to growth services. Similarly, event marketing and advertising as part of a marketing strategy will have a significant impact on the company's revenue and brand value. Advertising spending has a positive impact on brand value and company revenue [38]. By implementing this project, it is expected that the revenue and profit will increase so that it will improve the performance of asset management efficiency. Base on research [39], it is expected that the profit will increase 50% by implementing marketing strategy. based on the ROF formula and cost calculation, if profit increases by 50% then some components of overhead costs (marketing costs) are also assumed to increase by 50%. On the other hand, Supply chain fixed assets value will be fixed because it is not affected by operational costs. The result of this calculation is the ROF will increase by 1%. This estimated increase in ROF is obtained by implementing one project. on the next racetrack, this SME can carry out the second and third projects to achieve the ROF target of 11.9%.
This paper presents study on how to implement SCOR using SCOR Racetrack in a leather craft small-medium enterprise through a series of steps based on the SCOR Racetrack. This case study for improving asset management efficiency has been described in this study. Base on this case study, the performance improvement of AM.1.2 Return on Supply Chain Fixed Assets (ROF) was carried out to achieve the 11.9 percent target with three improvement projects, i.e., develop marketing strategy, improve brand awareness and develop budgeting analysis. Marketing strategy implementation is estimated to increase ROF by 1%. in accordance with its philosophy as a racing track, which is a form of continuous improvement, then subsequently, this SME can carry out the second and third projects to achieve the ROF target of 11.9%. Other project initiatives can be generated through repeated step racetracks to achieve the target.
A lesson learned from this case can be summarized that improving performance using SCOR Racetrack is starting from set the scope, configure the supply chain, optimize the project and ready for implementation. Before program SCOR Racetrack start, company need to prepare the organization for the mission critical SCOR improvement effort to gain commitment from all stakeholders. The main critical activities in set the scope is understand the business environment and determining which product and market segment need to be focused on in order to improve company performance. Configure the supply chain is aimed to find what exactly performance attribute needs to be escalate using some tools such as benchmarking, gap analysis and fishbone diagram. The focus on Optimize Projects is grouping performance gaps into projects, calculating a metric benefit for each project, and prioritizing projects into implementations. The last steps is ready for Implementation is a checking readiness before the implementation of improvements in term of Vision, Incentives, Resources, Skills, and Action plans. The success of the improvement program implementation will be influenced by the readiness of these five factors in the organization.
The stages of the SCOR Racetrack can be used as guidance for company to improve their performance. Companies can enrich methods at each stage to adapt to company conditions and get more effective results. Further implementation is suggested for the implementation of SCOR 12 in various industries and various projects to improve their superior performance. Implication management of this research is how SCOR framework can be used to improve supply chain performance and help management to prioritize the action to be done in order to achieve higher performance. Management can prepare readiness in all resources aspect and follow this SCOR framework start from pre SCOR, set the scope, configure performance, optimize project and ready for implementation. The important thing needs to be done in advance is awareness and knowledge from all stakeholders in organization to run this framework.
This study is supported by DPPM (Direktorat Penelitian dan Pengabdian Masyarakat), UII, Yogyakarta, Indonesia and Industrial Engineering Department, FTI-UII, Yogyakarta, Indonesia.
[1] Petrillo, A., De Felice, F., Zomparelli, F. (2019). Performance measurement for world-class manufacturing: A model for the Italian automotive industry. Total Quality Management & Business Excellence, 30(7-8): 908-935. https://doi.org/10.1080/14783363.2017.1408402
[2] Datta, P.P. (2017). Enhancing competitive advantage by constructing supply chains to achieve superior performance. Production Planning & Control, 28(1): 57-74. https://doi.org/10.1080/09537287.2016.1231854
[3] Kirovska, Z., Josifovska, A., Kiselicki, M. (2021). Efficient management of supply chain in achieving a significant competitive advantage in the market. Journal of Sustainable Development, 5(14): 5-22.
[4] Nudurupati, S.S., Bititci, U.S., Kumar, V., Chan, F.T.S. (2011). State of the art literature review on performance measurement. Computers and Industrial Engineering, 60(2): 279-290. https://doi.org/10.1016/j.cie.2010.11.010
[5] Narkunienė, J., Ulbinaitė, A. (2018). Comparative analysis of company performance evaluation methods. The International Journal of Entrepreneurship and Sustainability Issues, 1(September): 125-138. https://doi.org/10.9770/jesi.2018.6.1(10)
[6] Chan, F.T.S. (2003). Performance measurement in a supply chain. The International Journal of Advanced Manufacturing Technology, 21: 534-548. https://doi.org/10.1007/s001700300063
[7] Angeleanu, A. (2015). New technology trends and their transformative impact on logistics and supply chain processes. International Journal of Economic Practices and Theories, 5: 413-419.
[8] Kim, S.W. (2006). Effects of supply chain management practices, integration and competition capability on performance. Supply Chain Management: An International Journal, 11(3): 241-248. https://doi.org/10.1108/13598540610662149
[9] Bastas, A., Liyanage, K. (2018). Sustainable supply chain quality management: A systematic review. Journal of Cleaner Production, 181: 726-744. https://doi.org/10.1016/j.jclepro.2018.01.110
[10] Liebetruth, T. (2017). Sustainability in performance measurement and management systems for supply chains. Procedia Engineering, 192: 539-544. https://doi.org/10.1016/j.proeng.2017.06.093
[11] Beske-Janssen, P., Johnson, M.P., Schaltegger, S. (2015). 20 years of performance measurement in sustainable supply chain management – What has been achieved? Supply Chain Management, 20(6): 664-680. https://doi.org/10.1108/SCM-06-2015-0216
[12] Martins, C.L., Pato, M.V. (2019). Supply chain sustainability: A tertiary literature review. Journal of Cleaner Production, 225: 995-1016. https://doi.org/10.1016/j.jclepro.2019.03.250
[13] Hong, J., Zhang, Y., Ding, M. (2018). Sustainable supply chain management practices, supply chain dynamic capabilities, and enterprise performance. Journal of Cleaner Production, 172: 3508-3519. https://doi.org/10.1016/j.jclepro.2017.06.093
[14] Ramezankhani, M.J., Torabi, S.A., Vahidi, F. (2018). Supply chain performance measurement and evaluation: A mixed sustainability and resilience approach. Computers and Industrial Engineering, 126: 531-548. https://doi.org/10.1016/j.cie.2018.09.054
[15] Persson, F. (2011b). SCOR template - A simulation based dynamic supply chain analysis tool. International Journal of Production Economics, 131(1): 288-294. https://doi.org/10.1016/j.ijpe.2010.09.029
[16] Huan, S.H., Sheoran, S.K., Wan, G. (2004). A review and analysis of supply chain operations reference (SCOR) model. Supply Chain Management, 9(1): 23-29. https://doi.org/10.1108/13598540410517557
[17] APICS. (2017). Supply chain operations reference model: SCOR version 12.0. Chicago: APICS.
[18] Alomar, M., Pasek, Z.J. (2014). Linking supply chain strategy and processes to performance improvement. Procedia CIRP, 17: 628-634. https://doi.org/10.1016/j.procir.2014.01.144
[19] Delipinar, G.E., Kocaoglu, B. (2016). Using SCOR model to gain competitive advantage: A literature review. Procedia - Social and Behavioral Sciences, 229: 398-406. https://doi.org/10.1016/j.sbspro.2016.07.150
[20] Kottala, S.Y., Herbert, K. (2019). An empirical investigation of supply chain operations reference model practices and supply chain performance: Evidence from manufacturing sector. International Journal of Productivity and Performance Management, 69(9): 1925-1954. https://doi.org/10.1108/IJPPM-09-2018-0337
[21] Sillanpää, I. (2010). Supply chain performance measurement in the manufacturing industry A single case study research to develop a supply chain performance measurement framework. Acta Univ. Oul.
[22] Georgise, F.B., Thoben, K.D., Seifert, M. (2016). Application of the adapted SCOR model to the leather industry: An Ethiopian case study. Lecture Notes in Logistics, 441-451. https://doi.org/10.1007/978-3-319-23512-7_43
[23] Lee, K.H., Ru, T., Shiu, Y.S., Sivakumar, P. (2012). The applications of SCOR in manufacturing: Two cases in Taiwan. Procedia Engineering, 38: 2548-2563. https://doi.org/10.1016/j.proeng.2012.06.300
[24] Kamarudin, N., Izaidin, A.M. (2018). Using the supply chain operation reference (SCOR) model to assess the potential impact on business management in Malaysia SME industry: A conceptual. Ijbmcnet.Com, 3(4): 14-23. http://ijbmcnet.com/images/Vol3No4/2.pdf
[25] Georgise, F.B., Wuest, T., Thoben, K.D. (2017). SCOR model application in developing countries: Challenges & requirements. Production Planning & Control, 28(1): 17-32. https://doi.org/10.1080/09537287.2016.1230790
[26] Kusrini, E., Caneca, V.I., Helia, V.N., Miranda, S. (2019). Supply chain performance measurement using supply chain operation reference (SCOR) 12.0 model: A case study in A leather SME in Indonesia. IOP Conference Series: Materials Science and Engineering, 697(1): 0-10. https://doi.org/10.1088/1757-899X/697/1/012023
[27] Hafeez, J., Khalid, R., Mir, S. (2016). SCOR implementation in oil and gas company from an emerging market. International Journal of Operations Research and Information Systems, 8(1): 93-107. https://doi.org/10.4018/ijoris.2017010105
[28] Seifbarghy, M., Akbari, M.R., Sajadieh, M.S. (2010). Analyzing the supply chain using SCOR model in a steel producing company. 40th International Conference on Computers and Industrial Engineering: Soft Computing Techniques for Advanced Manufacturing and Service Systems, CIE40 2010, June 2020. https://doi.org/10.1109/ICCIE.2010.5668328
[29] Kusrini, E., Miranda, S. (2021). Determining performance metrics of supply chain management in make-to-order small-medium enterprise using supply chain operation reference model (SCOR Version 12.0). Mathematical Modelling of Engineering Problems, 8(5): 750-756. https://doi.org/10.18280/mmep.080509
[30] Susanty, A., Puspitasari, D., Marga, B.V. (2014). Using scorecard to measure supply chain performance in SMEs hand-stamped batik. Journal of Supply Chain and Operations Management, 12(2): 78.
[31] Guersola, M., Lima, E.P.D., Steiner, M.T.A. (2018). Supply chain performance measurement: A systematic literature review. International Journal of Logistics Systems and Management, 31(1): 109-131. https://doi.org/10.1504/IJLSM.2018.094193
[32] Irawan, H., Tricahyono, D., Hendayani, R. (2016). Determining the characteristics of E-SCM for small and medium enterprise in screen printing in Indonesia using supply chain operation reference and quality function deployment. International Journal of Economics, Commerce and Management.
[33] Bukhori, I.B., Widodo, K.H., Ismoyowati, D. (2015). Evaluation of poultry supply chain performance in XYZ slaughtering house Yogyakarta using SCOR and AHP method. Agriculture and Agricultural Science Procedia, 3: 221-225. https://doi.org/10.1016/j.aaspro.2015.01.043
[34] Hasibuan, A., Arfah, M., Parinduri, L., Hernawati, T., Harahap, B., Sibuea, S.R., Sulaiman, O.K. (2018). Performance analysis of supply chain management with supply chain operation reference model. In Journal of Physics: Conference Series, 1007(1): 012029. https://doi.org/10.1088/1742-6596/1007/1/012029
[35] Persson, F. (2011). SCOR template—A simulation based dynamic supply chain analysis tool. International Journal of Production Economics, 131(1): 288-294. https://doi.org/10.1016/j.ijpe.2010.09.029
[36] Amini, A., Darani, M., Afshani, M., Amini, Z. (2012). Effectiveness of marketing strategies and corporate image on brand equity as a sustainable competitive advantage. Interdisciplinary Journal of Contemporary Research Business, 4(2): 192-205.
[37] Zahay, D., Griffin, A. (2010). Marketing strategy selection, marketing metrics, and firm performance. Journal of Business & Industrial Marketing, 25(2): 84-93. https://doi.org/10.1108/08858621011017714
[38] Liu, L., Zhang, J., Keh, H.T. (2018). Event-marketing and advertising expenditures: The differential effects on brand value and company revenue. Journal of Advertising Research, 58(4): 464-475. https://doi.org/10.2501/JAR-2017-043
[39] Dzisi, S., Ofosu, D. (2014). Marketing strategies and the performance of SMEs in Ghana. European Journal of Business and Management, 6(5): 102-111.