Theingi Nwe![]() | Monsak Pimsarn*
| Monsak Pimsarn*![]()
© 2023 IIETA. This article is published by IIETA and is licensed under the CC BY 4.0 license (http://creativecommons.org/licenses/by/4.0/).
OPEN ACCESS
Ensuring safety in the design of railway infrastructure and rolling stock is a critical aspect of railway operations. Railway axles are subjected to fluctuating bending and torsion loads, which often lead to the development of plastic stresses in the vicinity of fillets and notches, even though they are designed to withstand nominal elastic loads. This study aims to provide an accurate fatigue-life prediction for a motor bogie axle, taking into account the braking effects in conjunction with press fitting and the influence of masses in motion on the axle. Initially, the stress and deflection of the axle under combined loadings are calculated in accordance with the EN 13104 standard. Subsequently, a comparative simulation analysis is conducted using ABAQUS commercial software, with particular emphasis on specific loading conditions. A strain-based approach is employed to estimate fatigue life under multiaxial loading and variable amplitude overloading scenarios, utilizing fe-safe commercial fatigue analysis software. The results reveal a strong correlation between the theoretical and finite element analyses. The braking effects are found to reduce fatigue life by 50% compared to the influences of press fitting combined with masses in motion. This research highlights the significance of considering braking effects in fatigue-life predictions of railway axles to ensure safe and robust design.
braking, fatigue life, multiaxial loading, railway axle, strain-life
Axles are a vital component in locomotive systems' rolling stock, serving to support rotating elements and transmit rotational motion and power. They must withstand various combined loads, which can result in extensive fatigue damage during operation. Railway axles are subjected to complex loads, such as vertical forces due to wagon mass and payload, lateral forces, and braking forces. An axle drives a vehicle by transmitting power from an electric motor to the vehicle wheels and by managing the rotational speed of the axle or stopping the vehicle using brake discs [1, 2]. Consequently, a railway axle must absorb braking forces and be designed to operate safely with a known fatigue life.
Two types of brakes are commonly employed: adhesion-dependent and independent brakes, consisting of a tread and brake disc that can be mounted either on the axle or the wheel [1, 2]. Owing to limited space in bogies, axle-mounted disc brakes are typically used on trailers, while wheel-mounted disc brakes are utilized on motor bogies, where the braking force is transferred through the wheel to the axle [3, 4]. Although traction forces generated by power transmission must be considered according to applicable standards, they are deemed unnecessary in this analysis since traction and braking forces are not applied to an axle simultaneously. Hence, moments caused by traction forces are not considered.
Fatigue due to cyclic loading is the most common cause of railway axle failure. Even well-designed axles may experience mechanical failure when subjected to repeated loading or overloading. Fatigue-life evaluation is a crucial technique often used to develop or improve product designs. Complete information regarding component shape, material, load condition, work environment, and work limitations is required for fatigue-failure analysis. Traditional uniaxial models are insufficient for addressing actual axle loads, as axles experience combined multiaxial loading of direct and shear stresses under service conditions [5, 6]. Testing is expensive, and the load spectrum of a railway axle is random, necessitating the development of a novel approach to calculate axle fatigue life. Accordingly, this study focuses on examining railway axle fatigue under variable amplitude cyclic overloading due to track irregularities, including curves, alignment, longitudinal level, switches, and crossovers, using a strain-life method.
Recent studies have not considered the braking effect as a significant issue for design calculation and fatigue-life prediction [7-10]. Nonetheless, contemporary research on railway axle design calculation and fatigue-life prediction offers a more comprehensive understanding of materials, manufacturing, design methods, and press fitting effects. Parametric research on the composite railway axle lightweight design concept has been reported, revealing a potential 75% reduction in unsprung mass compared to a conventional hollow steel axle [11]. Son et al. [12] proposed a new material and taper bore axle geometry to predict fatigue life under various service conditions as a novel design approach. Hirakawa and Kubota [13] explored a fatigue design method comparing Japanese and European design philosophies and examined fretting fatigue damage of press-fitted parts. Other studies [14-17] emphasized the importance of accounting for the press-fitting effect in railway axle design and demonstrated how research findings have been applied to improve axle manufacturing. A systematic review by Günay et al. [1] investigated various braking systems used in railway vehicles, as well as design and material selection. A parametric study was conducted on wheel tread damage resulting from repeated braking concerning braking temperature and field tests. Wear simulation methodologies for brake blocks and wheel treads were developed [18, 19].
This research aims to investigate the impact of braking on the fatigue crack initiation life of railway axles, an area that has been largely underexplored. All forces due to press fitting, masses in motion, and braking effects are combined according to the EN 13103/4 standard. Stress acting on an axle is calculated in various transition sections where stresses are concentrated for analytical calculations. The finite element (FE) method was employed for numerical modeling and validation of the analytical calculation results. Based on the stress histories of FE analysis, fatigue-life prediction was performed multiaxially, employing a variable amplitude overload history with a strain-based approach.
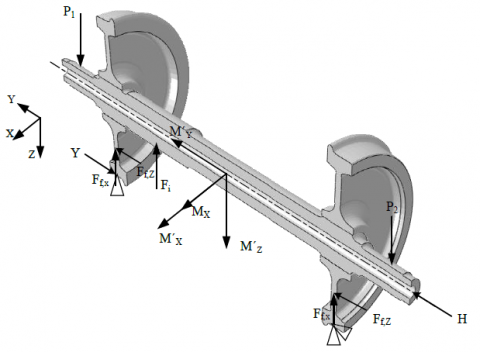
This study followed the EN 13104 standard for determining the bending moment and stress along an axle configuration using a specific load on a powered motor bogie wheelset. Figures 1 and 2 show schematic free-body diagrams of the wheelset induced by masses in motion and braking defined by the EN standards.
Figure 1. A schematic free-body diagram of a motor bogie wheelset due to masses in motion (measurements are in mm)
Figure 2. A schematic free-body diagram of a motor bogie wheelset due to braking (measurements are in mm)
2.1 Loads acting on an axle
An operating wheelset experiences three forces, those generated by masses in motion, braking and traction. For a powered motor bogie axle with an asymmetric vertical force loaded on its journal bearings, the force due to the masses of the unsprung parts, wheel-rail contact force, lateral force and braking are the most prominent acting on an axle. An axle can be subjected to torsional loading during driving, accelerating, and braking. A railway axle with two brake discs attached to its wheel hub is considered in the calculations of the current study. Type of the rolling stock used in this study is high-speed motor bogies and long-distance trains. The maximum normal design payload for a vehicle is 239.136 kN, and the weight of the vehicle body is 283.755 kN. The maximum braking force used in this study is for emergency braking under a deceleration of 1.25 m/s2. The specific load values used to calculate the internal and external stresses on a motor bogie axle are shown in Table 1 [20].
Table 1. Loads for an axle of a motor bogie
|
Load |
Magnitude (kN) |
|
Vertical force on the more loaded side=P1 |
101.300 |
|
Vertical force on the less loaded side=P2 |
75.528 |
|
Wheel-rail horizontal contact force on the more loaded side=Y1 |
49.509 |
|
Wheel-rail horizontal contact force on the less loaded side=Y2 |
24.754 |
|
Vertical rail contact reaction force on the more loaded side=Q1 |
112.430 |
|
Vertical rail contact reaction force on the less loaded side=Q2 |
63.171 |
|
Balancing force between Y1 and Y2=H |
24.775 |
|
Un-sprung force=Fi |
-1.215 |
|
Friction force between the wheel and brake disk=Γ |
0.250 |
|
Maximum braking force=Ff |
39.200 |
|
The proportion of P braked by the braking system=P' |
75.000 |
2.2 Stress evaluation along an axle
The stress concentration factor of an axle, K, is proportional to the ratio of the fillet or groove radius, the diameter of a cylindrical part, and the ratio of two different adjacent cylindrical parts at the transition fillet or groove (Figure 3). In the current study, these parameters were calculated according to the appropriate standards [3, 4]. Table 2 shows the stress concentration factor at various transition zones of a motor bogie axle. The bore of the hollow axle and other parts that did not change the section and the stress concentration factor was 1.
Figure 3. Expression of a stress concentration factor (a) bottom of the transition between two cylindrical parts and (b) groove bottom [1, 2]
Table 2. Stress concentration factor in various axle sections
|
Region |
A1 |
A2 |
B |
C |
D1 |
D2 |
|
R (mm) |
40 |
8 |
25 |
40 |
15 |
75 |
|
d (mm) |
130 |
130 |
160 |
180 |
184 |
170 |
|
D (mm) |
138 |
152 |
266 |
266 |
200 |
200 |
|
K |
1.01 |
1.16 |
1.19 |
1.21 |
1.06 |
1.02 |
The bending and torsional moments generated by the vertical reaction and braking forces acting on the wheelset were calculated using beam theory. Eqns. (1) and (2) [3, 4] are the bending moments generated by the masses acting on the journal bearings and braking forces acting between the load plane and wheel.
$\mathrm{M}_{\mathrm{x}}=\mathrm{P}_1 \mathrm{y}$ (1)
$\mathrm{M}_{\mathrm{x}}^{\prime}=\mathrm{F}_{\mathrm{f}, \mathrm{x}} \Gamma \mathrm{y}$ (2)
where, Mx is the bending moment generated by masses in motion, M'x is the bending moment caused by braking forces acting on the x axis, Ff,X is the maximum braking force acting vertically, Γ is the friction force between the brake disk and wheel, and y is the distance for any axle section from the vertical force P1.
Eqns. (3) and (4) [3, 4] are the bending moments generated by the masses in motion and braking forces between two wheels.
$\mathrm{M}_{\mathrm{x}}=\mathrm{P}_1 \mathrm{y}-\mathrm{Q}_1(\mathrm{y}-\mathrm{b}+\mathrm{S})+\mathrm{Y}_1 \mathrm{R}-\sum_{\mathrm{i}} \mathrm{F}_{\mathrm{i}}\left(\mathrm{y}-\mathrm{b}+\mathrm{S}-\mathrm{y}_{\mathrm{i}}\right)$ (3)
$M_x^{\prime}=F_{f, x} \Gamma\left(b-S+y_i\right)$ (4)
where, b is the distance between the vertical centerline and the vertical force on axle journals, S is the distance between the wheel tread and the vertical centerline, R is the nominal radius of the wheel tread, and yi is the distance between one wheel's tread and the force Fi.
Eq. (5) is the torsional moment between two wheels generated by braking forces acting tangentially to the wheels. The torsional moment between the vertical force load plane and the wheel is zero.
$\mathrm{M}_{\mathrm{y}}^{\prime}=0.3 \mathrm{P}^{\prime} \mathrm{R}$ (5)
where, M'y is the torsional moment due to braking, P' is the proportion of P from the braking system, and R is the nominal wheel radius.
Eq. (6) is the bending moment between the vertical force load plane and wheel generated by braking forces acting along the x-axis.
$\mathrm{M}_{\mathrm{z}}^{\prime}=\mathrm{F}_{\mathrm{f}, \mathrm{Z}} \Gamma \frac{\mathrm{R}_{\mathrm{b}}}{\mathrm{R}} \mathrm{y}$ (6)
Eq. (7) is the bending moment between two wheels generated by braking forces acting along the x-axis.
$M_z^{\prime}=F_{f, Z} \Gamma(b-S) \frac{R_b}{R}$ (7)
where, M'z is the bending moment due to braking acting on the z axis, Ff,Z is the maximum braking force acting horizontally and Rb is the radius of applied brake force.
The resultant moment, MR, is given by Eq. (8).
$M_R=\sqrt{M X^2+M Y^2+M Z^2}$ (8)
where, MX is the sums of the bending moment acting on the x axis and MZ are the sums of the bending moments acting on the z axis, MY is the summation of torsional moments.
The current study considered normal, shear, and equivalent stresses at various sections along a hollow axle. The normal and shear stresses are respectively expressed by Eqns. (9) and (10).
$\sigma_{\mathrm{n}}=\frac{32 \times \sqrt{\mathrm{MX}^2+\mathrm{MZ}^2} \mathrm{~d}}{\pi\left(\mathrm{d}^4-\mathrm{d}^{\prime 4}\right)}$ (9)
$\tau=\frac{16 \times \mathrm{MY} \times \mathrm{d}}{\pi\left(\mathrm{d}^4-\mathrm{d}^{\prime 4}\right)}$ (10)
Eq. (11) [3, 4] is the equivalent stress on the surface of an axle.
$\sigma=\frac{\mathrm{K} \times 32 \times \mathrm{MR} \times \mathrm{d}}{\pi\left(\mathrm{d}^4-\mathrm{d}^{\prime 4}\right)}$ (11)
where, K is the stress concentration factor, d is the external diameter for an axle section and d' is the bore diameter of a hollow axle.
Eq. (12) [3, 4] is the equivalent stress on the bore surface of an axle.
$\sigma=\frac{\mathrm{K} \times 32 \times \mathrm{MR} \times \mathrm{d}^{\prime}}{\pi\left(\mathrm{d}^4-\mathrm{d}^{\prime 4}\right)}$ (12)
Eqns. (13) and (14) [3, 4] are the stress concentration factor of a bottom of the transition between two cylindrical parts and groove bottom.
$\mathrm{K}=\frac{(4-\mathrm{D} / \mathrm{d})(\mathrm{D} / \mathrm{d}-1)}{5(10(\mathrm{r} / \mathrm{d}))^{(2.5(\mathrm{r} / \mathrm{d})+1.5-0.5(\mathrm{D} / \mathrm{d}))}}\quad\quad+1$ (13)
$K=\left[\frac{(4-\mathrm{D} / \mathrm{d})(\mathrm{D} / \mathrm{d}-1)}{5(10(\mathrm{r} / \mathrm{d}))^{(2.5(\mathrm{r} / \mathrm{d})+1.5-0.5(\mathrm{D} / \mathrm{d}))}\quad\quad\quad}\right]\left[\frac{-1.2(\mathrm{r} / \mathrm{d})^2+37(\mathrm{r} / \mathrm{d})}{(\mathrm{D} / \mathrm{d})^6}+1.74\right]+1$ (14)
where, r is the transition fillet or groove radius, d is the diameter of the axle in which the stress concentration is calculated, D is the diameter of the wheel hub as shown in Figure 3.
The methodology for predicting railway axle fatigue life consists of two main steps. First, numerical simulation of the railway axle loading must be done in ABAQUS. Then, the loading spectrum is transferred and repeated up to the fracture point in fe-safe, which is a powerful fatigue life prediction software for FE models.
3.1 Finite element method
Finite element analysis of the railway motor bogie wheelset assembly was performed to examine stress history after press fitting and loading. A three-dimensional FE half-symmetry model of the wheelset was developed using ABAQUS software. As demonstrated in Figure 4, the FE model consists of two components, wheel and axle. A railway wheel and axle are press fitted with an interference 0.2 millimetres, calculated following EN 13260 [21]. The material used in this study is EA4T steel, Young’s modulus (E) is 206 GPa and Poisson’s ratio (γ) is 0.3, which are frequently employed in railroad wheelsets. To achieve precise and accurate FE modelling results, the mesh sensitivity analysis was conducted, and the element size was carefully chosen. Based on the results of the comparison of different mesh sizes, we determined the optimal mesh size that provides a reasonable trade-off between accuracy and computational cost. Specifically, the element size was set to 2 mm at the fillet and notch groove transition, 5 mm at the contact area between the wheel and axle, 10 mm at other parts of the axle, and a 20 mm expected contact area for the wheel. This approach allows for accurate results with a minimal number of elements. The model consists of 256,456 elements (C3D8R), as demonstrated in Figure 4. First-order reduced integration elements are utilized by controlling the hourglass effect to improve the accuracy of results. This prevents potential singularities due to reduced integration and increases computational efficiency in numerical simulations.
Figure 4. FE meshing model of the wheelset
The mating surface between the wheelset was defined as a surface-to-surface contact, where the wheel’s contact surface was the master surface due to its greater stiffness. The master surface nodes could penetrate the slave surface, where the axle’s contact surface was the slave. Small sliding contact formulation was used to ensure that motion between surfaces was small and accurately simulated the press-fitting procedure. The coefficient of friction for the wheelset contact was 0.1 to account for tangential behaviour. A hard contact model was proposed to ensure normal behaviour.
The boundary conditions and loading of the wheelset were set following the EN 13103/4 design standard (Figure 5). The wheel-rail contact nodes were fixed, U1, U2=0, to the contact place of the wheel and track. In this analysis, the loading was applied in a multi-step case. We defined three load steps using a multi-load case function. Step 1 involves applying an interference fit. The second step is an analysis that adds vertical loading and lateral force to the model. Step 3 includes braking forces and torsion loading.
Figure 5. Boundary condition of the FE model wheelset
3.2 Multiaxial strain-life analysis method
A multiaxial strain-life method was used in the current study. It is applicable to both high- and low-cycle fatigue problems with complicated forces and moments that produce multiaxial stress and strain states. The fatigue performance of the axle was examined under various loading conditions to investigate the discrepancy between the results of considering braking effect and not. A typical strain-life analysis has several basic steps. First, the stress determined from numerical analysis using the ABAQUS program is necessary. It is important in obtaining actual fatigue-life estimates. These FE results are then imported into fe-safe. The fatigue material properties, loading history, fatigue algorithm selection, and mean stress correction all have a significant impact on fatigue‑life prediction. Figure 6 illustrates the fatigue analysis procedure used in this investigation.
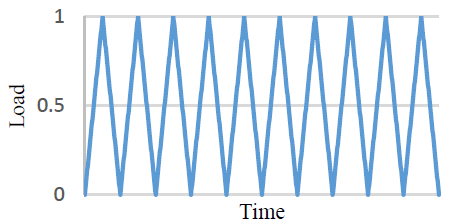
The loading history to which the component has been subjected affects the fatigue-life prediction model. Imported FE results contain multiple linear elastic stress datasets. Each dataset contains the results of a unit-load scenario for a specific load direction. The estimated stress tensor at each node is multiplied by the load history in fe-safe. Moreover, the load ratios are easily assignable. The load case per load ratio is shown in Table 3. Figures 7 and 8 give the loading history diagram applied to each stress dataset. The load histories are assumed to be repeated until the axle fails. Railway axles in service are exposed to variable amplitude loading, which causes variable fatigue damage and overloading due to additional dynamic forces. The bending stresses obtained from FE analysis were utilized as the base load and set with a cyclic amplitude of variable overloading that was applied every fifth cycle, both upward and downward, during axle rotation. A torsional stress load history was set up as a sinusoidal function with a magnitude range of 0 to 1, since torsion is steady [22]. Press fitting is a constant load ratio [23]. Under Neuber's law [24], elastic stress is converted into elastic-plastic stress‑strains, which are then utilized in a strain-life fatigue calculation.
Figure 6. Fatigue analysis procedure
Table 3. Load case vs. load ratio
|
Load Case |
Load Ratio (R) |
|
Press Fitting Force |
Constant |
|
Vertical Force |
R=-1 |
|
Lateral Force |
R=0 |
|
Braking Force |
R=0 |
|
Torsional Moment |
R=0 |
Figure 7. Load spectra for fatigue prediction (R=-1)
Figure 8. Load spectra for fatigue prediction (R=0)
This study used the Brown-Miller method and Morrow mean stress correction with biaxial strain-life algorithm. The Brown-Miller criterion [25] is widely accepted for analysis of ductile metals and provides the highest accuracy estimates of fatigue‑life. The Brown-Miller equation (Eq. (15)) states that the critical plane where maximum fatigue damage occurs is determined by the maximum shear strain amplitude (Δγmax/2) and normal strain amplitude (Δεmax/2). Therefore, the Brown-Miller equation suggests that the combination of shear and normal strain is the primary cause of severe fatigue damage in materials. The complete Brown-Miller equation can be written as a result of the mean stress correlation.
$\frac{\Delta \gamma_{\max }}{2}+\frac{\Delta \varepsilon_{\max }}{2}=1.65 \frac{\sigma^{\prime}}{\mathrm{E}}\left(2 \mathrm{~N}_{\mathrm{f}}\right)^{\mathrm{b}}+1.75 \varepsilon_{\mathrm{f}}^{\prime}\left(2 \mathrm{~N}_{\mathrm{f}}\right)^c$ (15)
where, Nf=the number of cycles to failure, $\frac{\Delta \gamma_{\max }}{2}$ =shear strain amplitude, $\frac{\Delta \varepsilon_{\max }}{2}$ =normal strain amplitude.
Fatigue damage is determined on each plane using a Rainflow cycle algorithm and Palmgrem-Miner rule [26]. For variable amplitude loading, fatigue damage is calculated by dividing the design life by its available life, and overall damage is summed up. The crack initiation plane is defined as the plane with the shortest life. Values greater than one indicate failure prior to reaching the design life. Table 4 provides information on the EA4T steel's fatigue materials properties.
Table 4. Fatigue properties of the EA4T material
|
Ultimate tensile strength |
650.0 MPa |
|
Fatigue strength coefficient (σ') |
811.1 MPa |
|
Cyclic yield strength (σyc) |
385.2 MPa |
|
Cyclic fatigue strength coefficient (K') |
806.3 MPa |
|
Fatigue strength exponent (b) |
-0.069 |
|
Fatigue ductility exponent (c) |
-0.641 |
|
Fatigue ductility coefficient (εf') |
0.658 |
|
Surface finish factor (Kt) |
1 |
Figure 9 shows a moment diagram of an axle evaluated using the EN 13103/4 standard employing Eqns. (1) to (8). The wheelset was assumed to run on a curved track, considering lateral and braking forces. The bending moment MX due to the vehicle's mass between the loading plane and the rolling wheel was also calculated using Eq. (1). It was computed between the two wheels using Eq. (3). The braking system generates moments as three components, x, y and z, which are calculated separately depending on the braking method. Brake imbalance, curvature effects and wheelset hunting generate torque along the y-axis. Frictional braking forces on the disc produce braking moments along the x- and z-axes. Bending moments of the x- and z-components are smaller than the torsional moment in the y-direction. The maximum moment occurred at the axle wheel seat with the transmission of track reaction forces to the axle through the wheel, causing the side of the axle to become more loaded.
Figure 9. Moment diagram of the axle along the longitudinal axis
4.1 Effect of loading cases on the stress concentration of a railway axle
Several static stress analyses were performed and defined considering only the press fitting effect in Loading Case 1, combined press fitting and masses in motion in Loading Case 2 and further combining them with the braking effect in Loading Case 3. Figures 10, 11, and 12 present graphical representations of the corresponding von Mises stress variation and counter plot of the von Mises stress variation of the axle 3D model for each loading condition. The distribution of von Mises stress throughout the axles generated by press fitting is plotted in Figure 10. During the press fitting, displacement and deformation occur on the press fitted seats and wheel hub because the contact pressure increases, causing stress, and the stress concentration rises. The calculated von Mises stress distribution based on FE analysis was zero, except for the wheel seat contact areas, fillets, and groove transitions near the interference fit. As a result, press fitting significantly affected the wheelset's initial residual stresses.
Figure 10. von Mises stress variation of an axle along the longitudinal axis generated by Loading Case 1
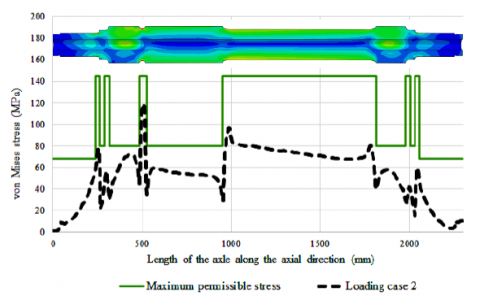
Figure 11. von Mises stress variation of an axle along the longitudinal axis generated by Loading Case 2
Figure 12. von Mises stress variation of an axle along the longitudinal axis generated by Loading Case 3
Figure 13. Comparison of von Mises stress variation of an axle along the longitudinal axis
The von Mises stress from FE analysis throughout the axles generated by the combined loading cases is shown graphically in Figures 11 and 12. The surface of the axle furthest from the natural axis and notch groove, where the most significant stress concentration resided, experienced the highest von Mises stress. In both loading cases (2 and 3), the maximum stress concentration is located at the notch groove transition zone, with values of 114 and 127 MPa. Comparing the analytical and FE analysis results (Figure 13), the maximum stress value of the notch groove transition from FE analysis was 43% higher than the value calculated using the EN standard. These values vary depending on various axle geometry parameters, as described in Section 2.2. Furthermore, the standard does not consider the press-fitting effect. The other sections of both results are very good agreements except for the location of the wheelset contact place and adjacent transitions places.
This was done to validate the safety factor following the EN 13013/4 standard, depending on the type and specific zone of the axle. The results from both theoretical and numerical methods indicate that the stress values are below the maximum permissible stress, as illustrated in Figure 13. Furthermore, the FE numerical method yielded a safety factor of 1.2 at the groove notch transition, indicating that the design is safe and can withstand the applied load. The combination of the braking effect increases stress to the axle by 10%. Thus, it would be misleading to design the axle based on only the masses in motion.
4.2 Multiaxial fatigue-life prediction of a railway axle
Multiaxial fatigue-life prediction was implemented in fe‑safe, a commercial software that functions as a post-processor for structural FEA results, which reads data from a .odb file. Since fatigue cracks typically start at component surfaces, only surface nodes of the axle 3D model were examined. The FE analysis results are output as multiple load cases to accurately account for the effects of various stress histories on axle life. It was necessary to scale the stress to almost the yield‑stress because the axle was designed to have an infinite life, and the working stress was below the permissible level.
Three loading scenarios were taken into consideration to examine the effects of loading conditions and impact of variable amplitude overload on the fatigue-crack initiation. Figure 14 compares the lowest fatigue life between three loading conditions at specific locations with comparative results. The estimated fatigue safety factors show fatigue durability throughout an infinite life cycle in Figure 15. It was calculated as the product of the stress amplitude and the fatigue strength of the material. Figure 16 demonstrates the fatigue damage obtained through fatigue analysis using fe‑safe.
The effect of press fitting in Loading Case 1 showed no fatigue in the motor axle design. It has an infinite fatigue life because of endurance cycle reached 107. Its factor of strength (FOS) was larger than 2 because the stress amplitude was below the permissible level, and the calculated life was greater than the design life. Figure 16 shows no damage will be caused due to that loading.
The generated fatigue-life results showed that fatigue began in Loading Case 2 at the groove notch, location 3, for the motor axle. It resulted from the combined press fitting and masses in motion with overloading applied every fifth cycle. Figure 14 shows the fatigue-life prediction results of axles as log10(life) contours, where life is in cycles, and the minimum value is (105.906=8.05E+05 cycles). As is evident in Figure 14, at location 3, the groove notch region shows the minimum life, and crack initiation occurred here, at the highest stress level. This was determined by the stress at a node for all loading conditions. The crack initiation location is indicated by the red zone in the stress contour where the highest level of stress is present. The minimum factor of strength (FOS) was 0.715 at location 3. The damage contour plot gives the fatigue damage values of a specific plane at a given design life (Figure 16). It shows the maximum fatigue damage was 3.830E-07 and the crack initiation will occur when the fatigue damage is equal to 1 because fatigue life is inverse of the damage.
For Loading Case 3, with three loading conditions, the lowest fatigue life will endure 105.609=4.06E+05 cycles at location 3 before failing. Loading Case 3 for of the log(life‑repeat) cycle was 5% less that of Case 2 at location 3. The factor of strength (FOS) was 0.678 and the percentage difference between the two loading cases remained the same as the log(life‑repeat) cycle. Additionally, in a specific scenario where braking is applied, the maximum damage value experienced a 70% increase (Figure 16).
Figure 14. Estimated fatigue life of a railway axle
Figure 15. Estimated factor of strength of railway axle
(a) Loading Case 1
(b) Loading Case 2
(c) Loading Case 3
Figure 16. The estimated fatigue damage of railway axle
The current paper presents a methodology for analytical and numerical calculation of the strength of railway motor bogie axles according to European standards, which considers the masses of a rail vehicle, lateral forces, and the braking force effect to ensure accurate fatigue-life predictions.
The main results are the following:
·Press fitting caused compression stress on the wheel seat of axle and tensile stress on the adjacent fillet or groove notch transition zone.
·The groove notch is a critical part of the axle, with the operating stress close to the allowable stress. The obtained analytical results are verified by FE calculation results, with deviations of the maximum stress at the groove notch and the FE results due to the residual stress of press fitting.
·Applying several load scenarios and variable amplitude overloading improves the reliability of fatigue-life predictions for accurately assessing fatigue damage under complex multiaxial loading of railway axles.
·The torsional stress does not produce a significant impact on axle fatigue. Nevertheless, the combined bending and torsion stress caused by braking reduces axle fatigue life cycles by 50% (5% in log scale). Therefore, the effect of braking should not be neglected and can be evaluated using the EN method.
·It can be concluded that an axle has an infinite life design because its fatigue life under a combination of various loading scenarios exceeded 107 cycles. When a rotational bending load defined as a variable amplitude and overload was scaled-up by a factor of two and applied at every fifth cycle, the minimum fatigue crack initiation life is 4.06E+05 (1.1E+03 km).
Overall, the presented methodology provides a reliable approach to assessing the fatigue life of railway axles and can aid in the design of new axles with longer life cycles.
This work was financially supported by King Mongkut's Institute of Technology Ladkrabang (Grant No. KDS2019/019).
[1] Günay, M., Korkmaz, M.E., Özmen, R. (2020). An investigation on braking systems used in railway vehicles. Engineering Science and Technology, an International Journal, 23(2): 421-431. https://doi.org/10.1016/j.jestch.2020.01.009
[2] Bosso, N., Gugliotta, A., Magelli, M., Oresta, I.F., Zampieri, N. (2019). Study of wheel-rail adhesion during braking maneuvers. Procedia Structural Integrity, 24: 680-691. https://doi.org/10.1016/j.prostr.2020.02.060
[3] BS EN 13103-1: 2017: Railway Applications - Wheelsets and Bogies - Part 1: Design Method for Axles with External Journals, 2011.
[4] European Committee For Standardization. BS EN 13104: 2009+A2:2012: Railway applications — Wheelsets and bogies — Powered axles — Design method. BSI Standards, 2012.
[5] Beretta, S., Carboni, M. (2011). Variable amplitude fatigue crack growth in a mild steel for railway axles: Experiments and predictive models. Engineering Fracture Mechanics, 78(5): 848-862. https://doi.org/10.1016/j.engfracmech.2010.11.019
[6] Zerbst, U., Beretta, S., Köhler, G., Lawton, A., Vormwald, M., Beier, H.T., Klingbeil, D. (2013). Safe life and damage tolerance aspects of railway axles–A review. Engineering Fracture Mechanics, 98: 214-271. https://doi.org/10.1016/j.engfracmech.2012.09.029
[7] Lundén, R., Vernersson, T., Ekberg, A. (2010). Railway axle design: to be based on fatigue initiation or crack propagation? Proceedings of the Institution of Mechanical Engineers, Part F: Journal of Rail and Rapid Transit, 224(5): 445-453. https://doi.org/10.1243/09544097JRRT384
[8] Náhlík, L., Pokorný, P., Ševčík, M., Fajkoš, R., Matušek, P., Hutař, P. (2017). Fatigue lifetime estimation of railway axles. Engineering Failure Analysis, 73: 139-157. https://doi.org/10.1016/j.engfailanal.2016.12.014
[9] Nguyen-Tajan, T.M.L., Lorang, X. (2017). EURAXLES-A global approach for design, production and maintenance of railway axles: WP1-Advances in fatigue load analysis and reliability assessment of railway axles: EURAXLES-Ein umfassender Ansatz für Auslegung, Herstellung und Instandhaltung von Eisenbahnachsen: WP1–Fortschritte in der Analyse von Ermüdungslasten und Verlässlichkeitsbewertung von Eisenbahnachsen. Materialwissenschaft und Werkstofftechnik, 48(7): 666-686. https://doi.org/10.1002/mawe.201700582
[10] Mancini, G., Corbizi, A., Lombardo, F., Cervello, S. (2006). Design of railway axle in compliance with the European Norms: high strength alloyed steels compared to standard steels. In Proceedings of WCRR, Italy.
[11] Mistry, P.J., Johnson, M. S., Li, S., Bruni, S., Bernasconi, A. (2021). Parametric sizing study for the design of a lightweight composite railway axle. Composite Structures, 267: 113851. https://doi.org/10.1016/j.compstruct.2021.113851
[12] Son, S.W., Jung, H.S., Kwon, T.S., Kim, J.S. (2015). Fatigue life prediction of a railway hollow axle with a tapered bore surface. Engineering Failure Analysis, 58: 44-55. https://doi.org/10.1016/j.engfailanal.2015.08.031
[13] Hirakawa, K., Kubota, M. (2001). On the fatigue design method for high-speed railway axles. Proceedings of the Institution of Mechanical Engineers, Part F: Journal of Rail and Rapid Transit, 215(2): 73-82. https://doi.org/10.1243/0954409011531413
[14] Nwe, T., Pimsarn, M. (2021). Railway axle and wheel assembly press-fitting force characteristics and holding torque capacity. Applied Sciences, 11(19): 8862. https://doi.org/10.3390/app11198862
[15] Nwe, T., Pimsarn, M. (2021). Effect of interference on the press fitting of railway wheel and axle assemblies. In IOP Conference Series: Materials Science and Engineering, 1137(1): 012051. https://iopscience.iop.org/article/10.1088/1757-899X/1137/1/012051
[16] Hirakawa, K., Toyama, K., Kubota, M. (1998). The analysis and prevention of failure in railway axles. International Journal of Fatigue, 20(2): 135-144. https://doi.org/10.1016/S0142-1123(97)00096-0
[17] Traupe, M., Jenne, S., Lütkepohl, K., Varfolomeev, I. (2016). Experimental validation of inspection intervals for railway axles accompanying the engineering process. International Journal of Fatigue, 86: 44-51. https://doi.org/10.1016/j.ijfatigue.2015.09.020
[18] Walia, M.S., Esmaeili, A., Vernersson, T., Lundén, R. (2018). Thermomechanical capacity of wheel treads at stop braking: A parametric study. International Journal of Fatigue, 113: 407-415. https://doi.org/10.1016/j.ijfatigue.2018.04.031
[19] Walia, M.S., Vernersson, T., Lundén, R., Blennow, F., Meinel, M. (2019). Temperatures and wear at railway tread braking: Field experiments and simulations. Wear, 440: 203086. https://doi.org/10.1016/j.wear.2019.203086
[20] Han, S.W., Son, S.W., Jung, H.S. (2012). Weight reduction of an urban railway axle based on EN standard. Transactions of the Korean Society of Mechanical Engineers A, 36(5): 579-590. http://dx.doi.org/10.3795/KSME-A.2012.36.5.579
[21] European Committee for Standardization. BS EN 13260: 2020 Railway applications - Wheelsets and bogies - Wheelsets - Product Requirements. London, United Kingdom: BSI, 2020.
[22] Robert, L.N. (2006). Machine Design an Integrated Approach. USA: Pearson Prentice Hall Publishers, pp. 558-560.
[23] Gokhale, N.S. (2008). Practical finite element analysis. Finite to Infinite.
[24] Simula. fe-safe 2018 Fatigue Theory Reference. Dassault Systèmes Simulia Corp.; 2018.
[25] Kandil, F.A., Brown, M.W., Miller, K.J. (1982). Biaxial low-cycle fatigue failure of 316 stainless steel at elevated temperatures. In Mechanical Behaviour and Nuclear Applications of Stainless Steel at Elevated Temperatures.
[26] Meyers, M.A., Chawla, K.K. (2008). Mechanical Behavior of Materials. Cambridge University Press.