Ali Jabri*![]() | Mohammad Reza Ansari | Mehdi Marefat
| Mohammad Reza Ansari | Mehdi Marefat![]()
© 2023 IIETA. This article is published by IIETA and is licensed under the CC BY 4.0 license (http://creativecommons.org/licenses/by/4.0/).
OPEN ACCESS
The pursuit of clean energy through advancements in thermal engineering and renewable energy research has led to the development of solar collectors and photovoltaic (PV) solar panels, with an emphasis on maximizing both thermal and electrical efficiencies. This study explores a thermal system designed to harness electrical energy from solar panels, provide cooling, and utilize waste heat to enhance the performance of the working fluid for various applications. The solution's accuracy was verified using ANSYS software for fluid simulations and Simulink for efficiency calculations. Results indicate that the average incoming solar flux throughout the summer quarter was highest in Basra, followed by Abadan, Baghdad, and Tehran. Peak output temperatures were observed at midday, with the system exhibiting maximum thermal efficiency during this period. A high degree of temperature convergence was noted, implying optimal system performance. Under identical operating conditions, including solar radiation from 8:00 AM to 5:00 PM and ambient temperature, the electrical performance of the system was assessed across the four cities. A positive correlation between solar radiation and electrical efficiency was observed, with Basra exhibiting the highest thermal and electrical efficiencies. The flow rate through the system's pipes was determined to be 0.0014 kg/s.
photovoltaic thermal system (PVT), CFD analysis, electrical power, transient thermal
The transition from fossil fuels to renewable energy sources, such as solar, geothermal, and wind, has been widely discussed in response to growing concerns about the environmental impacts of fossil fuel consumption and the increasing global demand for energy. Solar energy has garnered significant attention among various renewable energy sources due to its abundant availability and inexhaustible nature [1]. The Earth receives an amount of solar radiation approximately 15,000 times greater than the total global energy consumption [2]. In order to harness this vast energy resource, numerous technologies have been developed for converting solar radiation into different forms of usable energy. Photovoltaic (PV) technology, designed to convert solar radiation into electricity, has emerged as one of the most widely adopted solar systems. Numerous researchers have investigated the efficiency of PV systems, proposing various strategies for their enhancement [3]. Additionally, solar thermal (ST) collectors have been developed to harness solar radiation for heat energy production [4]. These systems involve the absorption of solar radiation by an absorber plate or tube, which subsequently transfers the energy to a working fluid. Various studies have examined the geometry of ST collectors to improve their performance [5], as well as the use of nano-fluids [6] and phase change materials [7].
In this study, four cities—Tehran, Abadan, Baghdad, and Basra—were selected for their favorable climatic conditions (consistent solar radiation throughout the year) conducive to solar energy systems. The motivation for this research lies in evaluating the performance of a recently developed system, known as a series-connected photovoltaic-thermal module and solar thermal collector (PVT-ST), for residential applications in these cities. To achieve this goal, the following objectives were pursued:
Compare the exit temperatures obtained from computational fluid dynamics (CFD) analysis with experimental results.
Compare the electrical efficiencies derived from CFD analysis with experimental findings.
The purpose and significance of this study encompass the examination of the PVT-ST system's applicability in various locations across Iran and Iraq, providing valuable insights for residential energy solutions.
Photovoltaic (PV) cells can only convert a small portion of the Sun's visible radiation into electricity, with the remaining radiation increasing the PV cell's temperature, consequently decreasing its electrical performance and shortening its useful lifespan [2]. To address this issue and recover excess energy absorbed by PVs, photovoltaic-thermal (PVT) modules have been developed, combining both PV and solar thermal (ST) systems [8]. PVT modules can simultaneously generate heat and electricity. However, the widespread use of PVT systems still faces significant limitations, primarily due to their low outlet temperatures. Despite numerous studies attempting to improve PVT performance [9], these systems generate less heat compared to ST collectors, rendering them unsuitable for applications requiring higher working temperatures.
Recently developed PVT-ST systems combine PVT and ST systems to produce more thermal energy. Ma et al. [10] first introduced the PVT-ST system, employing a 2D numerical model to evaluate its performance throughout a year in Shanghai's weather conditions. The study provided monthly average thermal and electrical efficiency alongside maximum and minimum electrical power, which reached approximately 35.8 and 18.20 kWh in July and November, respectively. Similar values were reported for thermal power, with maximum and minimum values in July (35.8 kWh) and January (18.20 kWh), respectively. Ma et al. [11] conducted an analysis using the same 2D numerical model, considering Mashhad, Iran's weather for a single day. The performance of a PVT-ST system with and without a glass cover was examined using the first and second laws of thermodynamics. Their results indicated that the system with a glass cover generated more thermal and exergy output while consuming less electrical power than the unglazed system.
Han et al. [12] quantitatively assessed the performance of PV-ST and PVT-ST systems under fixed operating conditions, with the first system generating only electricity and the second generating thermal power. The PVT-ST system demonstrated improved performance at higher solar radiation and ambient temperatures compared to the PV-ST system. Kazemian et al. [13] conducted a numerical comparison of PVT-ST performance against ST, PV, PVT, and PVT-ST systems for a single day in July in Shanghai, analyzing the effects of various factors such as working fluid mass flow rate, inlet temperature, outside temperature, solar radiation, and wind speed. Their study, which considered only the laminar regime, revealed that the mass flow rate was the primary determinant of the system's thermal and electrical output, followed by solar radiation and working fluid inlet temperature.
Suresh et al. [14] investigated the impact of using a glass cover on the PVT-ST system, both mathematically and experimentally. They determined that when the PVT-ST system was used instead of a PVT system, installing a glass cover could increase the outlet temperature by approximately 2-3℃. However, the power of the PVT-electrical ST system was 23% lower than that of the unglazed system. The study was conducted in Chennai, India, in February for a single day. Previous investigations have exclusively explored the annual feasibility of using PVT-ST systems in Shanghai, China. To assess the viability of implementing PVT-ST systems in various weather conditions and cities, it is crucial to analyze the annual performance of the system in a range of locations.
A one-dimensional mathematical model has been developed for this purpose, evaluating the system's efficiency in terms of thermal and electrical energy. Additionally, the system's performance is examined using the second law of thermodynamics. It is important to note that the electrical output of PV modules accounts for only 10% to 20% of solar radiation, with the majority of the remaining energy being converted into heat and increasing the PV temperature [15]. As the PV temperature rises, the electrical efficiency decreases linearly. ST collectors primarily absorb solar radiation and convert it into moderate temperature thermal energy, which can be directly used for hot water applications, thermal storage, or industrial processes. However, ST collectors alone cannot produce electricity.
A combination of PV modules and ST collectors, referred to as PVT modules, was first proposed by Zondag et al. [16] in 1976 for simultaneous power and heat output. Nevertheless, PVT modules generate lower-temperature thermal energy with lower-temperature working fluids compared to standalone ST collectors [17]. Outlet water temperatures from a typical PVT module are usually less than 40℃, which may be insufficient for residential or public use during periods of inadequate solar radiation (typically in winter, rainy, or cloudy days), necessitating the use of auxiliary energy sources such as electricity to heat the water. Therefore, a PVT module with a series-connected ST collector (abbreviated as PVT-ST) has been proposed, offering an innovative hybrid technology capable of generating both electricity and high-temperature thermal energy [18]. To investigate the system's feasibility, a comparative study between PVT-ST and PVT systems was conducted in four cities—Tehran, Abadan, Baghdad, and Basra—under identical conditions, including glazed PVT modules, PV modules, and ST collectors [19]. The long-term performance of the PVT-ST system, such as daily thermal energy and electricity generation based on each city's weather conditions, was also examined.
3.1 PVT-ST physical model
A PVT-ST diagram is shown in Figure 1 to demonstrate how to supply a residential unit with the necessary electrical and thermal energy. As can be seen, the PVT-ST is made up of two independent PVT and ST components that are joined by a pipeline. From top to bottom, the PVT system is made up of several layers, including the glass cover, PV panel, absorber plate, tubes, and insulation. The ST system consists of an absorber plate, tubes connecting to the absorber plate, insulation, and a glass cover to maximize the absorber plate's sun absorption. Copper and serpentine pipes make up the solar collector. In Table 1, each component's geometrical and thermophysical characteristics are presented. As was already indicated, a working fluid flow is used underneath the PV panel to lower its temperature and consume more heat from the system. However, many applications cannot be used due to the temperature of the working fluid at the output. To raise the level to the proper one, the warmed working fluid therefore enters the ST section. The hot water (red color) enters the home for the domestic use, leave it, and inter the water tanks in as cold water (blue color). The dimensions of the components in the table do not correspond well to the contents in the diagram because the diagram is an approximate illustrative form [20] only to demonstrate the idea and that the table represents the real values.
Figure 1. Schematic diagram of PVT-ST system
Table 1. The geometrical and thermo-physical specifications of the hybrid PVT-ST components [20]
|
Parameter |
Symbol |
Value |
Unit |
|
Glass cover |
|
|
|
|
Thickness |
δg |
0.003 |
m |
|
Length |
L |
0.63 |
m |
|
Width |
W |
0.54 |
m |
|
Density |
ρg |
2200 |
$\frac{\mathrm{kg}}{\mathrm{m}^3}$ |
|
Specific heat |
cp,g |
480 |
$\frac{J}{\mathrm{~kg} \cdot \mathrm{K}}$ |
|
Thermal conductivity |
kg |
1.1 |
$\frac{W}{m \cdot K}$ |
|
Absorptivity |
αg |
0.05 |
- |
|
Emissivity |
$\epsilon_g$ |
0.92 |
- |
|
Transmissivity |
τg |
0.936 |
- |
|
Absorber plate and tubes (copper) |
|
|
|
|
Thickness of absorber |
δab |
0.0003 |
m |
|
Thickness of tube |
δt |
0.001 |
m |
|
Outer diameter of tube |
dt |
0.008 |
m |
|
Length |
L |
0.63 |
m |
|
Width |
W |
0.54 |
m |
|
Density |
$\rho_{a b / t}$ |
8920 |
$\frac{\mathrm{kg}}{\mathrm{m}^3}$ |
|
Specific heat |
$C_{p, a b / t}$ |
385 |
$\frac{\mathrm{J}}{\mathrm{kg} \cdot \mathrm{K}}$ |
|
Thermal conductivity |
$k_{a b / t}$ |
398 |
$\frac{W}{m \cdot K}$ |
|
Absorptivity |
$\alpha_{a b / t}$ |
0.95 |
- |
|
Emissivity |
$\epsilon_{a b / t}$ |
0.88 |
- |
|
PV panel |
|
|
|
|
Thickness |
δpv |
0.0003 |
m |
|
Length |
L |
0.63 |
m |
|
Width |
W |
0.54 |
m |
|
Density |
ρpv |
2330 |
$\frac{\mathrm{kg}}{m^3}$ |
|
Specific heat |
cp,pv |
700 |
$\frac{J}{\mathrm{~kg} \cdot \mathrm{K}}$ |
|
Thermal conductivity |
kpv |
84 |
$\frac{W}{m \cdot K}$ |
|
Absorptivity |
αpv |
0.93 |
- |
|
Reference temperature coefficient |
βpv |
0.0045 |
$\frac{1}{K}$ |
|
Packing factor |
rpv |
0.94 |
- |
|
Reference PV cell efficiency |
ηpv |
1.6 |
% |
3.2 Numerical modeling (ANSYS)
The solar panels were designed using the Solidworks program and the cooling tubes to simulate the real case, where the dimensions were taken from Table 1, which is shown in Figure 2.
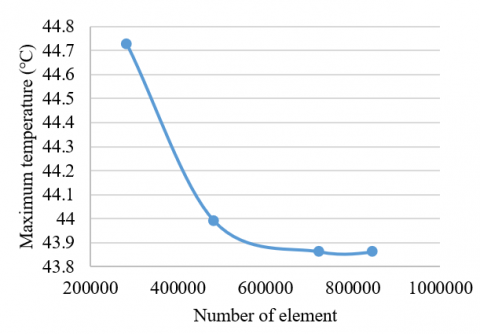
After completing the model design process and starting the simulation using ANSYS CFD program, an engineering program simulates heat and fluid flow systems. Where a suitable mesh must be made for obtaining accurate results that can be compared with practical applications, where the mesh reliability is increased and the mesh is increased until a stable result is reached as shown in Table 2. A hexahedral grid was used with a number of elements up to 967406 as shown in Figure 3 since the maximum temperature in this case was stable and its value was 43.858℃ with a difference between the last two values of temperature equal to 0.0046%. So, the grid sensitivity is achieved because the error between the last value of temperature and the older one is too small as shown in Figure 4.
Figure 2. Geometry of PV simulation
Figure 3. Mesh geometry
Table 2. Mesh independency
|
Case |
Nodes |
Element |
Maximum temperature (℃) |
|
1 |
312054 |
283544 |
44.723 |
|
2 |
524322 |
483522 |
43.987 |
|
3 |
783543 |
723425 |
43.860 |
|
4 |
967406 |
845633 |
43.858 |
Figure 4. Mesh independency
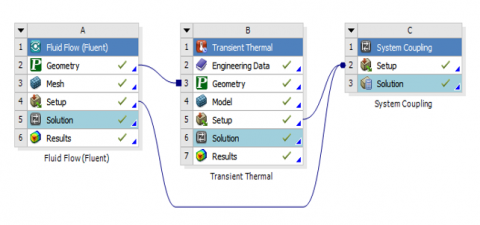
Where the simulation process was carried out using the ANSYS 19.1 program using the instruction coupling method, where the fluids are simulated separately from the solids. The CFD model was used to analyse the temperatures and velocities of the fluid, and then program the solids in relation to the solar panel and the methods of radiation heat transfer and link them together to obtain accurate and reliable results. them in comparison with the experimental results as Figure 5.
Figure 5. FSI method
3.3 Electrical power analysis (Simulink)
Numerous factors affect how much electricity a solar panel can produce. For this simulation study, the two most crucial variables—solar irradiation and panel temperature—are explored. Different solar panel radiation and temperature variables were observed to influence panel voltage and power. Based on testing data and formulation relationships between the PV module's features, the simulation's maximum power of the PV module was calculated (VOC, ISC, TP). The equations for the panel output current (I), panel dark saturation current (IOS), and generating current by solar irradiation (ILG) are as follows when parameters are obtained from the electrical equivalent diagram of a photovoltaic panel:
$\left.I=I_{L G}-I_{O S} \exp \left(\frac{q}{n k T_P}\left(V+I R_f\right)\right)-1\right]-\frac{V+I R_S}{R_{S H}}$ (1)
$I_{O S}=I_{O S}\left(\frac{T_P}{T_R}\right)^3 \exp \left[\frac{q E_{G O}}{A k}\left(\frac{1}{T_R}-\frac{1}{T}\right)\right]$ (2)
$I_{L G}=\left[I_{S C R}+K\left(T_P-25\right)\right] G / 100$ (3)
where, ILGis light current, IOS is reverse saturation current in a p-n diode, RS is series resistance to the cell, RSH is shunt resistance, measured by Ω, TR is reference temperature STC: 25℃. K is Boltzmann's constant=1.38110-23 J/K, q is electron charge=1.60210-19 coulomb, and n is the factor of an ideal diode=1 and 1~2 for a real diode. Finally, qEGO is the band gap energy 1.1 eV of silicon. The operating point (Pmax) at which the output power is maximized:
$P_{\max }=I_{\max } V_{\max }$ (4)
$P_{\max }=I_{s c} V_{o c} F F$ (5)
$F F=\frac{P_{\max }}{I_{s c} V_{o c}}$ (6)
When the produced current is zero, or I=0, the open circuit voltage is equal to the voltage drop across the diode caused by the photocurrent ILG, which is equal to IOS. For VOC, it can be resolved.
$V_{o c}=\frac{k T_R}{e} \ln \left(\frac{I_{s c}}{I_o}-1\right)=V_t \ln \left(\frac{I_{s c}}{I_o}+1\right)$ (7)
where, Vt - thermal voltage (V) given by:
$V_t=\frac{k T_R}{e}$ (8)
The PV array's manufacturer ratings and the published or measured I-V curves of the array can both be used to determine all of the constants in the equations above. For the purpose of this experimental investigation, these formulations are used with MATLAB/Simulink that has been programmed. The photovoltaic effect of semiconductor material is the foundation of photovoltaic cell theory. The photovoltaic effect is a phenomenon in which solar energy is absorbed by a semiconductor material, and subsequently the electron hole that the photon dug separates and generates electromotive force. The photovoltaic cell's I-V characteristic, which is I=f(V, G, t), varies with solar radiation intensity G (W/m2) and cell temperature t (℃).
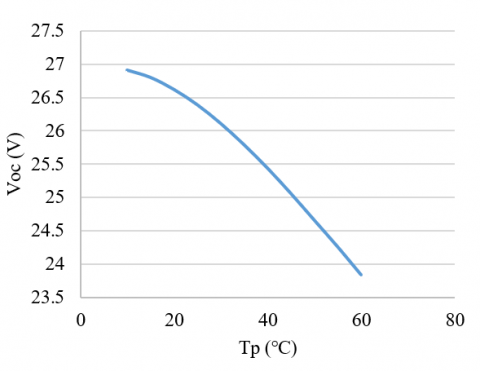
The test data of PV module temperature (TP) versus open circuit voltage (VOC) is linearly regressed, and this is done by:
$V_{O C}=22.384-0.0627 \,T_P$ (9)
where, TP is in ℃, see Figure 6.
Figure 6. Fitting accuracy of change the voltage with surface temperature at constant solar radiation
Additionally, the following graph illustrates the linearity between data on solar radiation (G) and short circuit current (ISC):
$I_{S C}=0.0967+0.0032\, G$ (10)
where, G is in W/m2.
The graph below depicts the link between the panel’s surface temperature after cooling and the value of solar radiation in Baghdad city on a certain day in July at exactly one o'clock in the afternoon. After running the simulation with the Matlab Simulink programme, we may obtain variables such as current, voltage, power, and electrical efficiency. Where out. I is the output current from the panel, out. V is the output voltage, out. P is output power, and finally out. ETA is electrical efficiency as shown in Figure 7.
Figure 7. Simulink programming
4.1 Compare the exit temperatures of CFD analysis with the experimental work
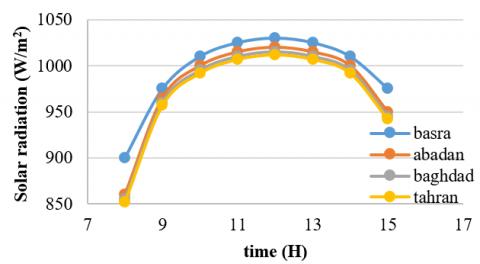
The solar collector is first modelled in the first research. Assuming there is no PV layer, the flux strikes the glass in this manner and travels to subsequent layers via conduction. The weather conditions from Tehran, Abadan, Baghdad, and Basra have been used to verify this geometry. The average value of the incoming flux throughout the summer quarter is displayed in Figure 8. As anticipated, Basra has the largest flux size, followed by Abadan, Baghdad, and Tehran. The peak flow rate was reached at midday in all of the cities, and as the end of the day draws near, the flow rate gradually declines. Tehran, Abadan, Baghdad, and Basra have ambient temperatures that are 29, 37, 36, and 39 degrees Celsius, respectively. Where these diagrams will be used to define them in the simulation process to obtain simulation results that can be compared with the experimental work.
Figure 8. Solar radiation of all cites
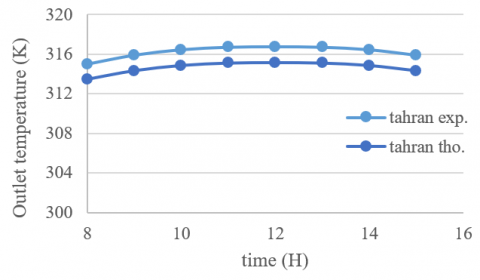
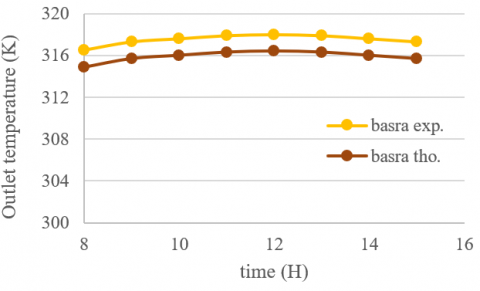
The temperature distribution diagram, thermal efficiency, and temperature contour for the three cities of Tehran, Abadan, Baghdad, and Basra are shown in Figures 9 to 12, respectively. The majority of the output temperature, as expected, is associated with midday. Additionally, the system produces the maximum thermal efficiency at this time. Due to the high input flux and ambient temperature and the decrease in temperatures and the increase in solar radiation at this hour, which increases the electrical efficiency. Figure 12 shows that Basra City would have the maximum thermal efficiency. As for the simulation work, the large convergence in temperatures is noted, which gives an impression of the idealist of the numerical work and its comparison with the experimental work, where the error rate reached 0.5%.
Figure 9. Outlet temperature of PV panels for experimental and numerical for Tehran
Figure 10. Outlet temperature of PV panels for experimental and numerical for Abadan
Figure 11. Outlet temperature of PV panels for experimental and numerical for Baghdad
Figure 12. Outlet temperature of PV panels for experimental and numerical for Basra
Where it is observed through the simulation process a model of the results obtained through the ANSYS program, and accordingly, Figure 13 shows the transfer of temperatures and the method of cooling using the fluid tube of the solar panel.
Figure 13. Outlet temperature of PV panels for piratical and numerical for Basra
Figure 14. Outlet temperature of PV panels for piratical and numerical for Basra
Figure 15. Outlet temperature of PV panels for piratical and numerical for Basra
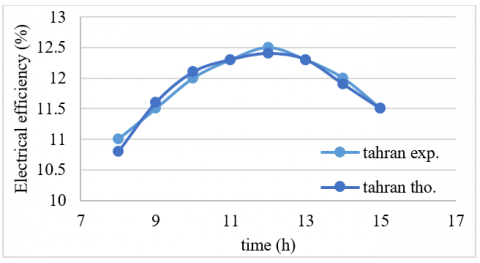
As for Figures 13 and 15, which shows the temperatures in the cooling pipe using the CFD program to solve the fluid mechanics and the method of temperature transmission in them 5.2. Compare the electrical efficiency of CFD analysis with the experimental work. Figures 16 to 19 depict the variations in electrical efficiency at various times of the day and under various solar radiation levels. The PV the higher the solar radiation may absorb more thermal energy. When can be seen, as solar radiation rises, electrical efficiency rises as well. This increase lasts until the radiation peak at 12 o'clock in the morning, after which the received electrical efficiency flux progressively declines as nightfall draws near. Using the Simulink program to find out the electrical efficiency of the used systems, where the convergence between the experimental and numerical work is noted, and the error rate reached 0.5% in all cases.
Figure 16. Electrical efficiency of PV panels for experimental and numerical for Tehran
Figure 17. Electrical efficiency of PV panels for experimental and numerical for Abadan
Figure 18. Electrical efficiency of PV panels for experimental and numerical for Baghdad
Figure 19. Electrical efficiency of PV panels for experimental and numerical for Basra
Additionally, under the same operating conditions—namely, solar radiation from 8:00am to 5:00pm and ambient temperature—the electrical performance of various cities is investigated. The pipe's flow rate is estimated to be 0.0014 kg/s. Basra has the highest thermal and electrical efficiency among the four cities.
In the first study, the solar collector is first modelled. If there isn't a PV layer, the flux hits the glass in this way and moves on to further layers through conduction. This geometry has been validated using data from Tehran, Abadan, Baghdad, and Basra. Figure 8 shows the average value of the incoming flux over the course of the summer quarter. As expected, Basra, Abadan, Baghdad, and Tehran have the biggest flux sizes. In all of the cities, the peak flow rate was attained at noon, and as the end of the day approaches, the flow rate gradually decreases. The ambient temperatures in Tehran, Abadan, Baghdad, and Basra are 29, 37, 36, and 39 degrees Celsius, respectively. When and how these diagrams will be used in the simulation process to define them and produce simulation results that can be compared to experimental work Figures 9 to 12 display, respectively, the temperature distribution diagram, thermal efficiency, and temperature contour for the three cities of Tehran, Abadan, Baghdad, and Basra. As might be expected, the majority of the output temperature is related to noon. Additionally, this is the moment when the system operates at its highest thermal efficiency. Figure 12 demonstrates that Basra City would have the highest thermal efficiency due to the high input flux and ambient temperature. When comparing the simulation work to the experimental work, where the error rate reached 0.5 percent, the large convergence in temperatures is noted, giving an impression of the idealist of the numerical work. Figure 13 illustrates the transfer of temperatures and the method of cooling using the fluid tube of the solar panel and illustrates where it is noticed during the simulation process a model of the findings acquired using the ANSYS program. Regarding Figures 14 and 15, which illustrate the temperatures inside the cooling pipe using the CFD program to resolve the fluid mechanics and the mechanism of temperature transfer in them. The differences in electrical efficiency at various times of the day and under varied solar radiation levels are shown in Figures 16 to 19. The PV can absorb more thermal energy the more solar radiation there is. As sun radiation increases, it is evident that electrical efficiency increases as well. The received electrical efficiency flux increases until the radiation peak at 12 o'clock in the morning, following which it gradually decreases as nightfall approaches. The electrical efficiency of the applied systems was determined using the Simulink program, where the convergence between the experimental and numerical work was documented and the error rate consistently hit 0.5 percent. Additionally, the electrical performance of various cities is examined under the same operational parameters, specifically solar radiation from 8:00 am to 5:00 pm and ambient temperature. The predicted flow rate for the pipe is 0.0014 kg/s. Of the four cities, Basra has the best thermal and electrical efficiency.
1. The average value of the incoming solar flux throughout the summer quarter has been determined. Basra has the largest flux size, followed by Abadan, Baghdad, and Tehran. The majority of the output temperature is associated with midday, and the system produces the maximum thermal efficiency at this time. The large convergence in temperatures is noted, which gives an impression of the ideality of the numerical work. Basra City would have the highest temperature due to the high input flux and ambient temperature. A simulation of how a solar panel works, and the transfer of temperatures and the method of cooling using the fluid tube of the solar panel. Where it is observed through the simulation process a model of the results obtained through the ANSYS program, and accordingly, the heat transfer to and from the solar panels.
2. As can be seen, as solar radiation rises, electrical efficiency rises as well. The PV the higher the solar radiation may absorb more thermal energy. This increase lasts until the radiation peak at 12 o'clock in the morning, after which the received electrical efficiency flux progressively declines as nightfall draws near. Under the same operating conditions, solar radiation from 8:00am to 5:00pm and ambient temperature the electrical performance of various cities is investigated. Basra has the highest thermal and electrical efficiency among the four cities. The pipe's flow rate is estimated to be 0.0014 kg/s.
|
A |
Area (m2) |
|
cp |
Specific heat (J/kg.K) |
|
dt |
Diameter of tube (m) |
|
E |
Energy (W/m2) |
|
$E^{\prime \prime}$ |
Rate of energy (W) |
|
$E x^{\prime \prime}$ |
Rate of exergy (W) |
|
f |
Friction factor |
|
G |
Solar radiation (W/m2) |
|
h |
Convective heat transfer (W/m2.K) |
|
k |
Thermal conductivity (W/m.K) |
|
1 |
Length of tube (m) |
|
m |
Mass flow rate (kg/s) |
|
Nu |
Nusselt number |
|
Pr |
Prandtl number |
|
$R^{\prime \prime}$ |
Thermal contact resistance |
|
Re |
Reynolds number |
|
rpv |
Packing factor |
|
T |
Temperature (K) |
|
t |
Time (s) |
|
$V_{\text {wind }}$ |
Wind speed |
|
Greek letters |
|
|
$\beta_{p v}$ |
Reference temperature coefficient |
|
$\eta$ |
Efficiency (%) |
|
$\mu$ |
Viscosity (pa.s) |
|
$\alpha$ |
Absorptance |
|
$\varepsilon$ |
Emissivity |
|
$\tau$ |
Transmittance |
|
$\delta$ |
Thickness (m) |
|
$\rho$ |
Density (kg/m3) |
|
Subscripts |
|
|
amb |
Ambient temperature |
|
ab |
Absorber plate |
|
cond |
Conduction |
|
conv |
Convection |
|
el |
Electrical |
|
f |
Fluid |
|
g |
Glass cover |
|
in |
Insulation |
|
out |
Outlet |
|
th |
Thermal |
|
pv |
Photovoltaic module |
|
T |
Tube |
|
th |
Thermal |
|
Abbreviations |
|
|
PV |
Photovoltaic module |
|
PVT |
Photovoltaic thermal module |
|
ST |
Solar thermal collector |
[1] Kazemian, A., Khatibi, M., Maadi, S.R., Ma, T. (2021). Performance optimization of a nanofluid-based photovoltaic thermal system integrated with nano-enhanced phase change material. Applied Energy, 295: 116859. https://doi.org/10.1016/j.apenergy.2021.116859
[2] Pathak, S.K., Sharma, P.O., Goel, V., Bhattacharyya, S., Aybar, H.Ş., Meyer, J.P. (2022). A detailed review on the performance of photovoltaic/thermal system using various cooling methods. Sustainable Energy Technologies and Assessments, 51: 101844. https://doi.org/10.1016/j.seta.2021.101844
[3] Hassan, A., Wahab, A., Qasim, M.A., Janjua, M.M., Ali, M.A., Ali, H.M., Javaid, N. (2020). Thermal management and uniform temperature regulation of photovoltaic modules using hybrid phase change materials-nanofluids system. Renewable Energy, 145: 282-293. https://doi.org/10.1016/j.renene.2019.05.130
[4] Suman, S., Khan, M.K., Pathak, M. (2015). Performance enhancement of solar collectors—A review. Renewable and Sustainable Energy Reviews, 49: 192-210. https://doi.org/10.1016/j.rser.2015.04.087
[5] Zhang, D., Tao, H., Wang, M., Sun, Z., Jiang, C. (2017). Numerical simulation investigation on thermal performance of heat pipe flat-plate solar collector. Applied Thermal Engineering, 118: 113-126. https://doi.org/10.1016/j.applthermaleng.2017.02.089
[6] Wole-Osho, I., Okonkwo, E.C., Abbasoglu, S., Kavaz, D. (2020). Nanofluids in solar thermal collectors: review and limitations. International Journal of Thermophysics, 41: 1-74. https://doi.org/10.1007/s10765-020-02737-1
[7] Serale, G., Goia, F., Perino, M. (2016). Numerical model and simulation of a solar thermal collector with slurry Phase Change Material (PCM) as the heat transfer fluid. Solar Energy, 134: 429-444. https://doi.org/10.1016/j.solener.2016.04.030
[8] Maadi, S.R., Khatibi, M., Ebrahimnia-Bajestan, E., Wood, D. (2019). Coupled thermal-optical numerical modeling of PV/T module–Combining CFD approach and two-band radiation DO model. Energy Conversion and Management, 198: 111781. https://doi.org/10.1016/j.enconman.2019.111781
[9] Kazemian, A., Khatibi, M., Ma, T. (2021). Performance prediction and optimization of a photovoltaic thermal system integrated with phase change material using response surface method. Journal of Cleaner Production, 290: 125748. https://doi.org/10.1016/j.jclepro.2020.125748
[10] Ma, T., Li, M., Kazemian, A. (2020). Photovoltaic thermal module and solar thermal collector connected in series to produce electricity and high-grade heat simultaneously. Applied Energy, 261: 114380. https://doi.org/10.1016/j.apenergy.2019.114380
[11] Ma, T., Li, M., Kazemian, A. (2020). Photovoltaic thermal module and solar thermal collector connected in series to produce electricity and high-grade heat simultaneously. Applied Energy, 261: 114380. https://doi.org/10.1016/j.apenergy.2019.114380
[12] Han, Z., Liu, K., Li, G., Zhao, X., Shittu, S. (2021). Electrical and thermal performance comparison between PVT-ST and PV-ST systems. Energy, 237: 121589. https://doi.org/10.1016/j.energy.2021.121589
[13] Kazemian, A., Parcheforosh, A., Salari, A., Ma, T. (2021). Optimization of a novel photovoltaic thermal module in series with a solar collector using Taguchi based grey relational analysis. Solar Energy, 215: 492-507. https://doi.org/10.1016/j.solener.2021.01.006
[14] Suresh, V., Iqbal, S.M., Reddy, K.S., Pesala, B. (2021). 3-D numerical modelling and experimental investigation of coupled photovoltaic thermal and flat plate collector. Solar Energy, 224: 195-209. https://doi.org/10.1016/j.solener.2021.05.079
[15] Florschuetz, L.W. (1979). Extension of the Hottel-Whillier model to the analysis of combined photovoltaic/thermal flat plate collectors. Solar Energy, 22(4): 361-366. https://doi.org/10.1016/0038-092X(79)90190-7
[16] Zondag, H.A., Van Helden, W.G., Bakker, M., Affolter, P., Eisenmann, W., Fechner, H., Tripanagnostopoulos, Y. (2005). PVT roadmap. A European guide for the development and market introduction of PVT technology. Netherlands. https://www.osti.gov/etdeweb/biblio/20788709
[17] Valizadeh, M., Sarhaddi, F., Adeli, M.M. (2019). Exergy performance assessment of a linear parabolic trough photovoltaic thermal collector. Renewable Energy, 138: 1028-1041. https://doi.org/10.1016/j.renene.2019.02.039
[18] Nahar, A., Hasanuzzaman, M., Rahim, N.A., Parvin, S. (2019). Numerical investigation on the effect of different parameters in enhancing heat transfer performance of photovoltaic thermal systems. Renewable Energy, 132: 284-295. https://doi.org/10.1016/j.renene.2018.08.008
[19] Alayi, R., Kasaeian, A., Atabi, F. (2019). Thermal analysis of parabolic trough concentration photovoltaic/thermal system for using in buildings. Environmental Progress & Sustainable Energy, 38(6): 13220. https://doi.org/10.1002/ep.13220
[20] Maadi, S.R., Kolahan, A., Passandideh-Fard, M., Sardarabadi, M., Moloudi, R. (2017). Characterization of PVT systems equipped with nanofluids-based collector from entropy generation. Energy Conversion and Management, 150: 515-531. https://doi.org/10.1016/j.enconman.2017.08.039