Gowram Iswarya*![]() | Beulah Matcha
| Beulah Matcha![]()
© 2023 IIETA. This article is published by IIETA and is licensed under the CC BY 4.0 license (http://creativecommons.org/licenses/by/4.0/).
OPEN ACCESS
The cement manufacturing industry is a major contributor to atmospheric pollution, primarily due to carbon dioxide emissions. Consequently, there is a pressing need to develop eco-friendly concrete capable of mitigating air pollution by sequestering atmospheric carbon dioxide. In this context, the incorporation of Natural Zeolite in concrete has been investigated, as it can absorb environmental carbon dioxide. This study explored the effects of partial cement replacement with Natural Zeolite (5%) and varying percentages of Silica Fume, Metakaolin, and Fly Ash (5%, 10%, and 15%) on the mechanical properties and carbon sequestration potential of High Strength Concrete (HSC). Comprehensive testing was conducted to evaluate the split tensile, compressive, and flexural strengths of the modified HSC. Experimental results indicated that the addition of Natural Zeolite and Metakaolin enhanced the strength of HSC, with Mix 3 displaying a higher 90-day compressive strength compared to the reference mix. The findings suggest that incorporating Natural Zeolite and other supplementary cementitious materials in concrete has the potential to alleviate environmental pollution. The dataset, comprising 900 samples, exhibited no autocorrelation or multicollinearity issues, making it suitable for multiple regression analysis. The statistically significant regression models developed in this study can effectively predict concrete strength.
regression analysis, high strength concrete, natural zeolite, metakaolin, fly ash, silica fume
Portland cement (OPC) is an essential construction material due to its advantageous properties of strength, durability, versatility, availability, sustainability, and economic efficiency. Its widespread utilization globally in construction is a testament to its significance in modern engineering and architecture. According to current statistics, the total global output of Portland cement exceeds 4.10 billion tonnes, the majority of which is utilized in concrete production. The optimal solution to reducing greenhouse gas emissions is the use of various industrial wastes as cement substitutes in concrete production. This aids in the conservation of natural resources and provides an outlet for landfill waste [1, 2]. The ability to produce high-strength concrete (HSC) has been enabled by the availability of reliable water-reducing admixtures and high-strength cementitious materials, representing a relatively new development in concrete technology [3]. Significant reductions in CO2 emissions can be achieved by using pozzolanic materials, industrial wastes such as natural zeolite (NZ) and metakaolin (MK) [4-6], silica fume (SF) [7-9], and fly ash (FA) [10, 11] as partial replacements for cement.
A study shows that adding 5% natural zeolite, fly ash, and pond ash provides adequate strength; the mineral-substituted concrete also has economic and environmental benefits. Concrete's porosity, permeability, and resilience can be improved by adding zeolite and industrial waste without sacrificing other desirable properties [12]. NZ can be used in place of Portland cement. Tensile strength testing shows NZ has a positive impact, especially evident after 90 days of curing [13]. When used in modest amounts, the utilization of NZ and MK minerals has resulted in enhanced concrete strength, making them recommended as cementitious materials [14]. Research on the influence of NZ rock on the mechanical, hygric, and thermal properties of concrete indicates that zeolite functions as a pozzolanic substance. However, higher concentrations create a substantial increase in concrete porosity, significantly impacting concrete properties [15]. Zeolite proportions of 0%, 10% and 20% indicate strength development, with the presence of NZ having no effect on the mechanical and physical characteristics of NZ–cement mixes [16]. Another study shows that the zeolite effect, which includes ion exchange and adsorption functions, has been successfully utilized in novel construction and building materials to address various challenges [17]. Concrete with 8, 13, and 25% zeolite exhibited significantly increased strength for all samples over longer time periods [18].
Research shows metakaolin's reactivity as a pozzolanic mineral addition enhances concrete performance through aggressive interaction with calcium hydroxide. An investigation of steam-cured high-strength concrete with metakaolin inhibited heat-induced volume expansion and drying shrinkage, improving volume stability [19]. Research on the impact of nanoparticles on the hardened properties of ultra-high performance concrete (UHPC) shows that nanoparticles resulted in increased early strength compared to conventional UHPC mixtures [20].
Research on supplementary cementing materials (SCMs), commonly used to enhance concrete durability, shows silica fume has gained widespread adoption relative to other SCMs due to its pozzolanic hydraulic reactivity [6]. Mechanical properties such as compressive strength and secant modulus were enhanced in the short term [7]. Research reveals that adding nano-silica and silica fume to concrete improves mechanical properties and durability [8]. An investigation into the mechanical properties of concrete found the most favorable proportions of nano-silica, Ni ferrite and Cu-Zn ferrite were 3%, 2% and 2% respectively. Concrete samples with nano-silica outperformed those with nano-ferrite by approximately 10%. Furthermore, granite-containing concrete samples outperformed dolomite-containing concrete samples by approximately 10% [21]. In recycled aggregate concrete, adding nano-silica and silica fume enhanced performance at both early and later curing ages [5]. A study assessed the impact of different silica fume content percentages (5%, 10%, 15% and 20%) on plain concrete and coconut fiber-reinforced concrete for pavement applications. Both mixture types exhibited superior properties when 10% and 15% silica fume were incorporated [22]. Other research shows that utilizing natural pozzolan and silica fumes together to produce HSC has technical and economic benefits for certain local concrete applications [9]. Other research shows combining steel fibers with silica fume significantly improves the performance of high-strength concrete subjected to impact and fatigue [10]. The impact of 5% to 30% natural zeolite and silica fume incremental replacements of granulated blast furnace slag (GBFS)-based geopolymer concrete with molarities of 4M, 6M and 8M were studied. Natural zeolite replacements of 10% and 15% exhibited improved strength. An artificial neural network model demonstrated the accuracy of the compressive strength findings [23].
Previous research has provided valuable insights into the materials studied. However, the limited sample size or scope of these studies could limit the generalizability of the findings. Future research could expand the sample size or scope of the studies to increase the generalizability of the findings.
A study of Bolomey and Feret's strength equations determined replacement percentages of fly ash ranging from 15% to 58% to calculate the maximum efficient fly ash content, finding that fly ash increased strength up to an optimum value, after which strength declined [24]. High-volume fly ash has greater replacement levels to achieve satisfactory performance in concrete. The summarized research indicates the beneficial use of industrial wastes to produce sustainable concrete with a reduced carbon footprint [25]. Up to 15% fly ash replacement of cement in an investigation of fly ash and natural pozzolana attained early strength, adequate tensile strength and resistance to thermal cracking in high-strength concrete [26]. Ultra-fine fly ashes with d90 of <9.3 μm (FA1) and 4.6 μm (FA2) were used to replace 0%, 15%, 25%, 35% and 50% of paste and mortar and 0%, 15% and 25% of cement in concrete. FA1 and FA2 with 15% and 25% cement replacements achieved standard mix flexural strength at 91 days [27].
Analysis of experimental data using three design evaluation processes including analysis of variance (ANOVA) and construction of a polynomial regression model for compressive strength illustrates how concrete mixture optimization can be achieved using various parameters [11]. An examination using classical deterministic and stochastic dependencies and regression equations developed a model on concrete design to study the water-binder ratio, binder content, compressive strength and efficiency factor. The model's accuracy presented satisfactory results [28]. Artificial neural network models and multiple regression analysis examined the compressive strength of high-performance concrete (HPC) containing nano-silica and copper slag as partial replacements for cement and fine aggregate respectively, showing a strong correlation with experimental data [29]. A study developed statistical models and design tables for appropriate concrete considering water/binder ratios from 0.3 to 0.5, metakaolin content from 0% to 25% and total binder weight from 350 kg/m3 to 600 kg/m3. The models and design tables allowed quick and accurate prediction and selection of the best mixture amounts for a given application [30]. A review estimated the probability of corrosion over 1 to 200 years for concrete containing metakaolin in various mixing proportions and concrete covers using Monte Carlo simulation, predicting the chloride-induced corrosion period for different metakaolin combinations. The most significant factors influencing this period were identified [31]. A study showed that a statistical model with five-fold cross-validation and combined void ratio and ultrasonic pulse velocity data allowed better prediction of hydraulic conductivity and compressive strength compared to previous concretes [32]. An exploration of the mechanical behavior of high-strength concrete using Python-based machine learning, artificial intelligence approaches and engineering programming showed a strong empirical relationship with the mathematical expressions [33]. An inquiry into the compressive strength and rapid chloride ion permeability at various curing ages using a statistical model showed the developed model accurately described the influence of independent variables on the desired attributes [34]. An examination and assessment of 108 large-scale specimens under uniaxial compression using empirical models predicted the stress-strain curve of tie-confined high-strength concrete. The model results showed excellent agreement with experimental data [35]. Prediction of the compression strength and tensile strength parameters of fly ash and microsilica-based high-performance concrete using hybrid algorithms provided more accurate predictions of experimental data with R2 values of 0.949 and 0.9138 respectively. A Gaussian process model developed to predict concrete materials and properties was shown to be more accurate compared to other popular models such as mean absolute error, Pearson correlation coefficient, root mean square error, Nash–Sutcliffe model efficiency coefficient and scattering index models [36].
Future research could incorporate more advanced or innovative methods or techniques for testing or analyzing the materials. By providing a critical analysis of previous research, this study has identified gaps in existing knowledge and aimed to advance the field.
The present study on the mechanical properties of high-strength concrete with natural zeolite and additives would provide valuable insights into the potential benefits and limitations of using these materials in concrete production and could contribute to the development of more sustainable and durable construction materials.
The mathematical modeling study on the mechanical properties of HSC with natural zeolite concrete and additives provides detailed information on the performance of concrete with different types of additives. This aids the construction sector in designing durable and resilient buildings and infrastructure by applying new materials. The present study aimed to design HSC with acceptable mechanical performance through the partial replacement of cement with varying proportions of NZ, MK.
2.1 Material properties
In this study, OPC 53 grade with 3.15 specific gravity and a fineness of 8.6%, which is <10% according to IS: 1031:1996 (Part 1), was used. Chemical composition of each material was determined using X-ray fluorescence (XRF) analysis, phase composition was determined using Rietveld refined X-ray diffraction (XRD), and physical parameters were recorded in Table 1. All of the mixtures included a superplasticizer (SP) based on modified polycarboxylate ether, with a PH of no less than 6, zero chloride content in accordance with IS 456:2000 [37], 1.08 specific gravity. The aggregate utilized was M sand (specific gravity=2.6), passed through 4.75 mm sieve and coarse aggregate (specific gravity=2.68), passed through 20 mm. The current investigation focuses on to improve the mechanical properties of HSC by addition of natural zeolite and additives. The mathematical modeling analysis is to study the mechanical properties of HSC with varying composition. The data obtained by mathematical modeling will useful in optimizing the mix design of HSC with natural zeolite and additives and predicting its performance in various applications.
2.2 Optimization of mix-design and mix proportions
Studies on high-strength concrete and concrete additives have been conducted by various researchers over time, and each study likely has its unique contributions and limitations. Some potential differences between the above study and previous studies by researchers could include: Research focus, methodology, sample size and materials, results and discussions. It is important to consider the unique contributions and limitations of each study when interpreting the results and applying them to practical applications in the field of concrete technology and materials science.
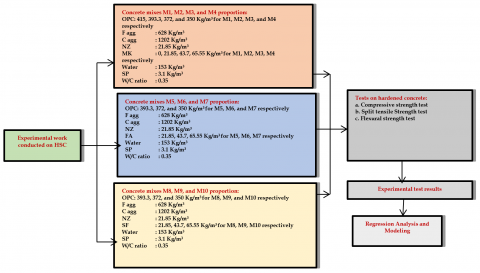
Table 2 shows the proportions of HSC mixtures and calculations made in accordance with IS 10262-2019 for the mix's design [38]. The ten HSC mixtures in Table 2 are meant to maintain the water/cementitious ratio constant by replacing cement with NZ, M, FA, and SF by weight. NZ was used at 5%, and the composition was maintained constant for all mixtures. M, FA, and SF were employed as substitute materials with 5, 10, and 15% each. All of the mixes were prepared and cast at a temperature of 28℃. At the low speed of the mixer, the dry constituents were combined for 4 minutes. Then, the Superplasticizer and water were added until the powder turned quasi-liquid. The mixer speed was adjusted to high intensity for 3 minutes and then low for a minute. The slump value ranges between 50 to 75mm for all the mixes.A flowchart summarizing the study's experimental procedures and regression analysis is shown in Figure 1.
Table 1. The material's physicochemical characteristics
|
S. No |
Physical and chemical properties |
Material |
Metakaolin |
Zeolite |
Silica fume |
Cement |
Fly ash |
|
1 |
Chemical composition (%) |
Silica-SiO2 |
52. 0 |
74.3 |
99.886 |
21.25 |
51.10 |
|
2 |
Alumina-Al2O3 |
46. 0 |
10.52 |
0.043 |
4.33 |
33.73 |
|
|
3 |
Ferric Oxide-Fe2O3 |
0. 60 |
1.60 |
0.040 |
1.85 |
3.84 |
|
|
4 |
Titanium Oxide-TiO2 |
0. 65 |
- |
0.001 |
0.13 |
1.50 |
|
|
5 |
Calcium Oxide-CaO |
0. 09 |
4.25 |
0.001 |
64.30 |
3.78 |
|
|
6 |
Magnesium Oxide-MgO |
0. 03 |
0.6 |
0.000 |
1.81 |
4.14 |
|
|
7 |
Sodium Oxide-Na2O |
0. 10 |
- |
0.003 |
0.17 |
0.46 |
|
|
8 |
Potassium Oxide-K2O |
0. 03 |
- |
0.001 |
0.71 |
1.18 |
|
|
9 |
Loss On Ignition-LOI |
1. 00 |
5.30 |
0.015 |
1.50 |
0.22 |
|
|
10 |
C3S |
56.47 |
- |
- |
- |
- |
|
|
11 |
C2S |
20.66 |
- |
- |
- |
- |
|
|
12 |
C3A |
6.31 |
- |
- |
- |
- |
|
|
13 |
C4AF |
8.29 |
- |
- |
- |
- |
|
|
1 |
Physical properties |
Appearance |
white |
off-white |
white |
grey |
dark grey |
|
2 |
Specific gravity |
2.6 |
2.1 |
2.63 |
3.15 |
2.7 |
Table 2. Mixture proportions of materials in kg/m3
|
S. No |
Material |
Mixture |
|||||||||
|
M1 |
M2 |
M3 |
M4 |
M5 |
M6 |
M7 |
M8 |
M9 |
M10 |
||
|
5%Z |
5%M |
10%M |
15%M |
5%FA |
10%FA |
15%FA |
5%SF |
10%SF |
15%SF |
||
|
1 |
OPC |
415 |
393.3 |
372 |
350 |
393.3 |
372 |
350 |
393.3 |
372 |
350 |
|
2 |
NZ |
21.85 |
21.85 |
21.85 |
21.85 |
21.85 |
21.85 |
21.85 |
21.85 |
21.85 |
21.85 |
|
3 |
MK |
- |
21.85 |
43.7 |
65.55 |
- |
- |
- |
- |
- |
- |
|
4 |
FA |
- |
- |
- |
- |
21.85 |
43.7 |
65.55 |
- |
- |
- |
|
5 |
SF |
- |
- |
- |
- |
- |
- |
- |
21.85 |
43.7 |
65.55 |
|
6 |
F agg |
628 |
628 |
628 |
628 |
628 |
628 |
628 |
628 |
628 |
628 |
|
7 |
C agg |
1202 |
1202 |
1202 |
1202 |
1202 |
1202 |
1202 |
1202 |
1202 |
1202 |
|
8 |
Water-to-cementitious materials ratio (w/cm) |
0.35 |
0.35 |
0.35 |
0.35 |
0.35 |
0.35 |
0.35 |
0.35 |
0.35 |
0.35 |
|
9 |
Water |
153 |
153 |
153 |
153 |
153 |
153 |
153 |
153 |
153 |
153 |
|
10 |
SP |
3.1 |
3.1 |
3.1 |
3.1 |
3.1 |
3.1 |
3.1 |
3.1 |
3.1 |
3.1 |
Figure 1. Flowchart of the methodology
Note: OPC-Ordinary Portland Cement; NZ-Natural Zeolite; MK-Metakaolin; SF-SilicaFume; FA-FlyAsh; F agg-Fine aggregates; C agg-Coarse aggregates; SP-Super Plasticizer
2.3 Experimental tests on hardened concrete
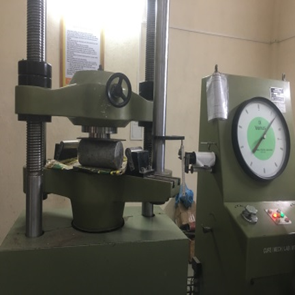
The compressive strength test for concrete cubes of size 150mm, the split tensile Strength test for cylinders of size 300mm×150mm, flexural strength test for beams of size 500mm×100mm×100mm of concrete shown in Figure 2, were conducted in accordance to IS 516-1959 [39]. All the specimens were cured for 3, 7, 28, 60, and 90 days at a temp from 28℃ to 32℃. The observations and findings were documented.
Figure 2. Experimental setup
3.1 Compressive strength
The compressive strength of all samples is shown in Figure 3a. At 90 days of curing, the combination comprising 85%C+5%NZ+10%MK produced the highest compressive strength values. Because MK has a stronger pozzolanic activity than the other materials, the rise in compressive strength occurred sooner in samples with more MK up to specific mixing proportions. The combination with 10% MK as a cement substitute exhibited the best compressive strength values for HSC mixes comprising 5% NZ, with compressive strengths of 41.67, 52.34, 63.4, 65.4, and 72 MPa at 3, 7, 28, 60, and 90 days respectively. These values were more significant than the reference mixture, which exhibited compressive strengths of 30, 40.622, 48.15, 56.5, and 64 MPa at 3, 7, 28, 60, and 90 days respectively. The rest of the mixes have compressive strengths more significant than the reference mix for all the curing days.
Figure 3a. Compressive strength test of concrete
3.2 Split tensile strength test
Figure 3b displays the Split Tensile Strength for all samples. At 90 days of curing, the combination comprising 85%C+5% NZ+10%MK produced the highest Split Tensile Strength values. The combination with 10% MK as a cement substitute exhibited the highest Split Tensile Strength values for HSC mixes comprising 5% NZ, with Split Tensile Strength of 3.3, 3.83, 4.5, 4.95, and 5.3 MPa at 3, 7, 28, 60, and 90 days, respectively. These values were greater than the reference mixture, which exhibited Split Tensile Strength of 3.1, 3.58, 4.02, 4.24, and 4.51 MPa at 3, 7, 28, 60, and 90 days respectively. The rest of the mixtures have Split Tensile Strength greater than the reference mix has split tensile strength for all the curing days.
Figure 3b. Split tensile strength test of concrete
3.3 Flexural strength test
Figure 3c shows the flexural strength of all samples. At 90 days of curing, the combination comprising 85%C+5%NZ+10%MK produced the highest flexural strength values. The combination with 10% MK as a cement substitute exhibited the highest flexural strength values for HSC mixes comprising 5% NZ, with flexural strength of 5.23, 6.03, 7.13, 8.16, and 9.44 MPa at 3, 7, 28, 60, and 90 days, respectively. This was greater than the reference mixture, which exhibited flexural strength of 4.03, 5.31, 6.6, 7.5, and 8.56 Mpa at 3, 7, 28, 60, and 90 days respectively. The rest of the mixtures have flexural strength values greater than the reference mix flexural strength for all the curing days.
Figure 3c. Flexural strength test of concrete
3.4 Regression analysis
For NZ, MK, FA, and SF materials, the present study created nine multiple regression models for compression, split, and flexural tests. For each regression model, the input and output settings were different. Table 3 displays the specifics of each model, with RM denoting the Regression analysis of Models 1 through 9. The primary aim of the regression analysis is to predict the strength of concrete for a specific mix of composition materials through the regression of the Compressive Strength Test (CST_MPa), Split Tensile Strength Test (STST_MPa), and Flexural Strength Test (FST_MPa) against NZ, FA, MK, and SF materials. The present study examined various regression models for the purpose of analysis.
$\operatorname{CSTM}_{M P a}=\alpha+\beta_1 * \operatorname{Day}_t+\beta_2 *$ Meta.$_M+\varepsilon_i$ (1)
$\operatorname{CST} FA_{M P a}=\alpha+\beta_1 * \operatorname{Day}_t+\beta_2 * F_{l y}._M+\mathcal{E}_i$ (2)
$\operatorname{CST}SF_{MPa}=\alpha+\beta_1 * \operatorname{Day}_t+\beta_2 * \operatorname{Sil}._M+\varepsilon_i$ (3)
$STSTM_{M P a}=\alpha+\beta_1 *$ Day$_t+\beta_2 *$ Meta$_{\cdot M}+\varepsilon_i$ (4)
$\operatorname{STST}FA_{M P a}=\alpha+\beta_1 * \operatorname{Day}_t+\beta_2 *$ Fly$._M+\varepsilon_i$ (5)
$\operatorname{STST}SF_{M P a}=\alpha+\beta_1 * \operatorname{Day}_t+\beta_2 *$ Sil.$_M+\varepsilon_i$ (6)
FST $M_{M P a}=\alpha+\beta_1 * Day_t+\beta_2 * \operatorname{Meta}._M+\varepsilon_i$ (7)
FST $FA_{M P a}=\alpha+\beta_1 * Day_t+\beta_2 * Fly_{\cdot M}+\varepsilon_i$ (8)
FST $SF_{M P a}=\alpha+\beta_1 * Day_t+\beta_2 * Sil_{\cdot M}+\varepsilon_i$ (9)
Eqns. (1) to (3) presented the multiple regression models to predict the compressive strength, Eqns. (4) to (6) for split tensile strength, Eqns. (7) to (9) for flexural strength test. The three dependent variables of compressive strength, split tensile strength, and flexural strength; when regressed, the models against NZ, MK, FA, and SF.
$R^2=1-\frac{\text { Sum of squares of residuals }}{\text { Sum of square of predicted values }}$ (10)
The 95% confidence level was utilized to calculate the regression equation coefficients. As a result, the maximum permissible error has been set at 5%. Only input variables with p-value of <0.05 were examined. The model was declared unsuitable if none of the p values of variables met the aforementioned condition. This occurred when the number of observations was insufficient to offer comprehensive information about the variables. According to a rule of thumb, number of input variables must be less than or equal to square root of number of observations.
As the number of input variables was significant, a stepwise regression was performed. The technique of incrementally adding input variables to a regression model depending on their significance until a suitable model was obtained and is known as stepwise regression. A p-value of <0.05 was found in all of the regression models in this investigation, suggesting that statistically significant models were generated.
The F-test ANOVA (Analysis of Variance) was used to check the correctness of the null hypothesis. F value and F-significant were two parameters generated by the F-test. As the F-significant rises, the regression line's goodness-of-fit to the target data will increase. In terms of meaning, the F-value was comparable to the p-value. For a 95% confidence level, the F value should also be <0.05.
The Durbin–Watson statistic (DW Stat) was used to determine autocorrelation, on a scale of 0 to 4, with 2 indicating no connection between the input variables. As a result, a value of 1.5 to 2.5 was preferred for models free of autocorrelation issues [40]. The Durbin Watson statistics in the regression models generated in this study, on the other hand, all values were between 1.5 and 2.5. In addition, all variables were tested for multicollinearity using VIF (variance inflation factors). According to the rule of thumb, it should be less than 10. However, in the present dataset, VIF values for each model were less than 10, indicating that multicollinearity was absent. This meant that the research datasets had no autocorrelation or multicollinearity issues and were suitable for performing multiple regression models.
The Root Mean Squared Error (RMSE) is the square root value of the residual squares average. It ought to be closer to the zero (0) line [41]. The RMSE values for the regression models were determined as 0.497, 0.551, 0.547, 0.273, 0.291, 0.229, 0.486, 0.564, and 0.612, indicating that all RMSE values of the models were acceptable, the compressive strength prediction when regressed with MK, FA, and SF.
The Mean Absolute Percent Error (MAPE), which indicates the fitness and predictability of a regression model, should be less than 20% as a rule of thumb [14, 41]. The MAPE values for models were determined to be 7.548, 9.299, 8.196, 5.897, 6.139, 4.576, 6.731, 7.139, and 9.475, according to the data. The R2 values represent the model's explanatory strength and fitness. Among the models, NZ with MK mix composition Flexural strength (MPa) had the most significant determination coefficient (95%) and F-significant (515.628). R2 values were nearly comparable in almost all models, while Durbin Watson Statistic, RMSE, and MAPE were almost all consistent. The findings from the multiple regression analysis are represented in Table 4 (see Panels A, B, and C).
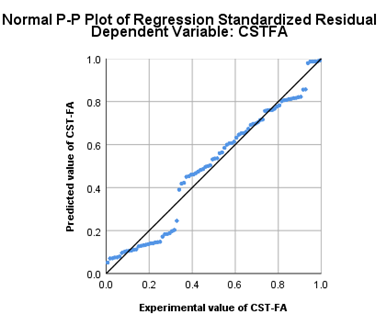
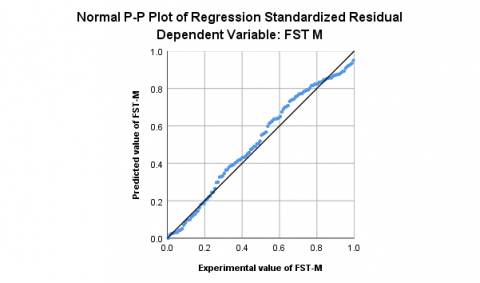
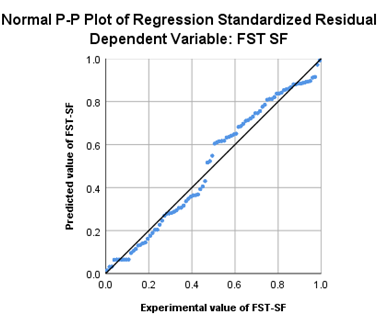
A typical P-P plot of regression standard residual based on the findings of the nine multiple regression models and the data reported in Tables 3 and 4 demonstrate a statistically significant correlation between the dependent variables of predicted and experimental strength of concrete. The relationship is shown in Figure 4(a-i). These graphical representations help to clarify the conclusions by referencing Eqns. (1) to (9).
Table 4 was found to be consistent with the results shown in Figure 4(a-i). The findings presented in Figure 4(a-c) demonstrate a significant correlation between the anticipated and observed outcomes of the set of dependant variables pertaining to compressive strength, as applied to the three distinct materials under examination., Figure 4(d-f) indicated the split tensile strength, Figure 4(g-i) indicated the flexural strength.
CSTM $_{M P a}=0.29$ Day$_t+0.47 \mathrm{Meta}_{\cdot M}+38.39, \mathrm{R} 2=90 \%$
Figure 4a. Model 1 CST_MPa predicted vs. experimental
$\operatorname{CST} FA_{M P a}=0.31$ Day$_t+0.26 F l y_{\cdot M}+38.42, R 2=78 \%$
Figure 4b. Model 2 CST_MPa predicted vs. experimental
CST $SF_{M P a}=0.38$ Day$_t+0.19$ Sil$._M+37.19, R 2=84 \%$
Figure 4c. Model 3 CST_MPa Predicted vs. experimental
$\operatorname{STSTM}_{M P a}=0.17$ Day$_t+0.25 \mathrm{Meta}_{\cdot M}+3.28, \mathrm{R} 2=90 \%$
Figure 4d. Model 4 STST_MPa predicted vs. experimental
STST $FA_{M P a}=0.18 \mathrm{Day}_t+0.10 \mathrm{Fly}_{\cdot M}+3.35, R 2=90 \%$
Figure 4e. Model 5 STST_MPa predicted vs. experimental
STST SF $_{M P a}=0.19$ Day$_t+0.13$ Sil .$_M+3.24, R 2=94 \%$
Figure 4f. Model 6 STST_MPa predicted vs. Experimental
FST $M_{M P a}=0.43$ Day$_t+0.38$ Meta.$_M+4.83, R 2=95 \%$
Figure 4g. Model 7 FST_MPa predicted vs. experimental
FST $F A_{M P a}=0.38 D a y_t+0.59 \mathrm{Fly}_{\cdot M}+4.58, R 2=92 \%$
Figure 4h. Model 8 FST_MPa predicted vs. experimental
FST $SF_{M P a}=0.41$ Day$_t+0.30$ Sil.$_M+4.57, R 2=91 \%$
Figure 4i. Model 9 FST_MPa predicted vs. experimental
Table 3. An overview of the models that have been developed
|
Model ID |
Dependent variable |
Independent variable |
No. of sample |
Equation |
|
RM-1 |
CST_MPa |
Curing days, Cement %, and Metakaolin% |
120 |
1 |
|
RM-2 |
CST_MPa |
Curing days, Cement %, and Fly Ash% |
90 |
2 |
|
RM-3 |
CST_MPa |
Curing days, Cement %, and Silica Fume% |
90 |
3 |
|
RM-4 |
STST_MPa |
Curing days, Cement %, and Metakaolin% |
120 |
4 |
|
RM-5 |
STST_MPa |
Curing days, Cement %, and Fly Ash% |
90 |
5 |
|
RM-6 |
STST_MPa |
Curing days, Cement %, and Silica Fume% |
90 |
6 |
|
RM-7 |
FST_MPa |
Curing days, Cement %, and Metakaolin% |
120 |
7 |
|
RM-8 |
FST_MPa |
Curing days, Cement %, and Fly Ash% |
90 |
8 |
|
RM-9 |
FST_MPa |
Curing days, Cement %, and Silica Fume% |
90 |
9 |
Table 4. The results of a multiple regression analysis (Eqns. (1) to (9))
|
S. No. |
Model |
R2 |
p-value |
F-sig. |
F-value |
DW Stat |
RMSE |
MAPE |
|
|
|
Panel A: The Compressive Strength Test Regression results |
||||||||
|
1 |
RM-1 |
NZ + MK |
90% |
0.000 |
240.094 |
0.000 |
1.566 |
0.497 |
7.548 |
|
2 |
RM-2 |
NZ + FA |
78% |
0.000 |
151.256 |
0.000 |
1.591 |
0.551 |
9.299 |
|
3 |
RM-3 |
NZ + SF |
84% |
0.000 |
225.128 |
0.000 |
1.52 |
0.547 |
8.196 |
|
|
Panel B: The Split Tensile Strength Test Regression results |
||||||||
|
4 |
RM-4 |
NZ + MK |
90% |
0.000 |
256.478 |
0.000 |
1.531 |
0.273 |
5.897 |
|
5 |
RM-5 |
NZ + FA |
90% |
0.000 |
183.894 |
0.005 |
1.554 |
0.291 |
6.139 |
|
6 |
RM-6 |
NZ + SF |
94% |
0.000 |
328.369 |
0.000 |
1.521 |
0.229 |
4.576 |
|
|
Panel C: The flexural strength test regression results |
||||||||
|
7 |
RM-7 |
NZ + MK |
95% |
0.000 |
515.628 |
0.000 |
1.564 |
0.486 |
6.731 |
|
8 |
RM-8 |
NZ + FA |
92% |
0.000 |
226.551 |
0.005 |
1.926 |
0.564 |
7.139 |
|
9 |
RM-9 |
NZ + SF |
91% |
0.000 |
220.189 |
0.000 |
1.518 |
0.612 |
9.475 |
This study investigated the mechanical characteristics of concrete that incorporated a blend of natural zeolite, with metakaolin, silica fume, and fly ash at varying proportions. Based on the findings, the following conclusions have emerged:
The high-strength concrete mixes of different compositions were tested for compressive strengths at different ages and after 90 days of curing, mix 3 (85% C+5% NZ+10% MK) achieved a compressive strength of 72 MPa while the other mixes attained compressive values that were higher than the compressive strength values of the reference mix.The split tensile strength test for high-strength concrete revealed that at 90 days of curing, mix 3 showed the highest value of 5.3 MPa, and the flexural strength test showed a value of 9.44 MPa. All other mixes showed higher strength, too, in comparison with the reference mix strength.
The managerial implications of a study on the mechanical properties of HSC with NZ and additives could include improved concrete mix design, cost reduction, increased sustainability, and a competitive advantage for construction companies.The study has the potential to contribute to the development of more effective and sustainable construction materials, as well as improve our understanding of the mechanical properties of high-strength concrete.
As autocorrelation and multicollinearity are absent in the developed regression models, the models have passed the Durbin–Watson test and have acceptable determination coefficients. Therefore, it can be concluded that the regression models are statistically significant in forecasting concrete strength.
Overall the research has the potential to enrich the study of the stream by providing new insights, addressing gaps in research, offering practical applications, and promoting collaboration among researchers.
The authors would like to acknowledge Dr. JanitaSaji, Prof. Sudhir M. R., and Mr. Bhumiswor Sharma for their assistance and expertise in all aspects of this research.
[1] Badagha, D., Modhera, C.D. (2017). M55 grade concrete using industrial waste to minimize cement content incorporating CO2 emission concept: An experimental investigation. Materials Today: Proceedings, 4(9): 9768-9772. http://dx.doi.org/10.1016/j.matpr.2017.06.264
[2] Wang, Q., Wang, D., Chen, H. (2017). The role of fly ash microsphere in the microstructure and macroscopic properties of high-strength concrete. Cement and Concrete Composites, 83: 125-137. http://dx.doi.org/10.1016/j.cemconcomp.2017.07.021
[3] Price, B. (2003). High strength concrete. Advanced concrete technology (processes). Elsevier Ltd. http://dx.doi.org/10.1016/B978-075065686-3/50289-5
[4] Razak, H.A., Wong, H.S. (2005). Strength estimation model for high-strength concrete incorporating metakaolin and silica fume. Cement and Concrete Research, 35(4): 688-695. http://dx.doi.org/10.1016/j.cemconres.2004.05.040
[5] Kim, H.S., Lee, S.H., Moon, H.Y. (2007). Strength properties and durability aspects of high strength concrete using Korean metakaolin. Construction and Building Materials, 21(6): 1229-1237. http://dx.doi.org/10.1016/j.conbuildmat.2006.05.007
[6] Alanazi, H., Yang, M., Zhang, D., Gao, Z. (2017). Early strength and durability of metakaolin-based geopolymer concrete. Magazine of Concrete Research, 69(1): 46-54. http://dx.doi.org/10.1680/jmacr.16.00118
[7] Kim, S.S., Qudoos, A., Jakhrani, S.H., Lee, J.B., Kim, H.G. (2019). Influence of coarse aggregates and Silica Fume on the mechanical properties, durability, and microstructure of concrete. Materials, 12(20): 3324. http://dx.doi.org/10.3390/ma12203324
[8] Behnood, A., Ziari, H. (2008). Effects of silica fume addition and water to cement ratio on the properties of high-strength concrete after exposure to high temperatures. Cement and Concrete Composites, 30(2): 106-112. http://dx.doi.org/10.1016/j.cemconcomp.2007.06.003
[9] Wongkeo, W., Thongsanitgarn, P., Ngamjarurojana, A., Chaipanich, A. (2014). Compressive strength and chloride resistance of self-compacting concrete containing high level fly ash and silica fume. Materials & Design, 64: 261-269. http://dx.doi.org/10.1016/j.matdes.2014.07.042
[10] Gunasekara, C., Zhou, Z., Law, D.W., Sofi, M., Setunge, S., Mendis, P. (2020). Microstructure and strength development of quaternary blend high-volume fly ash concrete. Journal of Materials Science, 55(15): 6441-6456. http://dx.doi.org/10.1007/s10853-020-04473-1
[11] Wang, S., Baxter, L. (2007). Comprehensive study of biomass fly ash in concrete: Strength, microscopy, kinetics and durability. Fuel Processing Technology, 88(11-12): 1165-1170. http://dx.doi.org/10.1016/j.fuproc.2007.06.016
[12] Canpolat, F., Yılmaz, K., Köse, M.M., Sümer, M., Yurdusev, M.A. (2004). Use of zeolite, coal bottom ash and fly ash as replacement materials in cement production. Cement and Concrete Research, 34(5): 731-735. http://dx.doi.org/10.1016/S0008-8846(03)00063-2
[13] Sedlmajer, M., Hubáček, A., Rovnaníková, P. (2014). Properties of concretes with admixture of natural zeolite. In Advanced Materials Research, 1000: 106-109. http://dx.doi.org/10.4028/www.scientific.net/AMR.1000.106
[14] Gowram, I., Sudhir, M.R., Mohan, M.K., Jain, D. (2021). Efficacy of Natural Zeolite and Metakaolin as Partial Alternatives to Cement in Fresh and Hardened High Strength Concrete. Advances in Materials Science and Engineering, 2021: 4090389. http://dx.doi.org/10.1155/2021/4090389
[15] Vejmelková, E., Koňáková, D., Čáchová, M., Keppert, M., Hubáček, A., Černý, R. (2014). Application of Zeolite as a Partial Replacement of Cement in Concrete Production. In Applied Mechanics and Materials, 621: 30-34. http://dx.doi.org/10.4028/www.scientific.net/AMM.621.30
[16] Perraki, T., Kontori, E., Tsivilis, S., Kakali, G. (2010). The effect of zeolite on the properties and hydration of blended cements. Cement and Concrete Composites, 32(2): 128-133. http://dx.doi.org/10.1016/j.cemconcomp.2009.10.004
[17] Feng, N.Q., Peng, G.F. (2005). Applications of natural zeolite to construction and building materials in China. Construction and Building Materials, 19(8): 579-584. http://dx.doi.org/10.1016/j.conbuildmat.2005.01.013
[18] Sičáková, A., Špak, M., Kozlovská, M., Kováč, M. (2017). Long-term properties of cement-based composites incorporating natural zeolite as a feature of progressive building material. Advances in Materials Science and Engineering, 2017: 7139481. http://dx.doi.org/10.1155/2017/7139481
[19] Shen, P., Lu, L., Chen, W., Wang, F., Hu, S. (2017). Efficiency of metakaolin in steam cured high strength concrete. Construction and Building Materials, 152: 357-366. http://dx.doi.org/10.1016/j.conbuildmat.2017.07.006
[20] Mostafa, S.A., Faried, A.S., Farghali, A.A., El-Deeb, M.M., Tawfik, T.A., Majer, S., Abd Elrahman, M. (2020). Influence of nanoparticles from waste materials on mechanical properties, durability and microstructure of UHPC. Materials, 13(20): 4530. http://dx.doi.org/10.3390/ma13204530
[21] Amin, M., Abu el-Hassan, K. (2015). Effect of using different types of nano materials on mechanical properties of high strength concrete. Construction and Building Materials, 80: 116-124. http://dx.doi.org/10.1016/j.conbuildmat.2014.12.075
[22] Khan, M., Rehman, A., Ali, M. (2020). Efficiency of silica-fume content in plain and natural fiber reinforced concrete for concrete road. Construction and Building Materials, 244: 118382. http://dx.doi.org/10.1016/j.conbuildmat.2020.118382
[23] Shahmansouri, A.A., Yazdani, M., Ghanbari, S., Bengar, H.A., Jafari, A., Ghatte, H.F. (2021). Artificial neural network model to predict the compressive strength of eco-friendly geopolymer concrete incorporating silica fume and natural zeolite. Journal of Cleaner Production, 279: 123697. http://dx.doi.org/10.1016/j.jclepro.2020.123697
[24] Oner, A.D.N.A.N., Akyuz, S., Yildiz, R. (2005). An experimental study on strength development of concrete containing fly ash and optimum usage of fly ash in concrete. Cement and Concrete Research, 35(6): 1165-1171. http://dx.doi.org/10.1016/j.cemconres.2004.09.031
[25] Herath, C., Gunasekara, C., Law, D.W., Setunge, S. (2020). Performance of high volume fly ash concrete incorporating additives: A systematic literature review. Construction and Building Materials, 258: 120606. http://dx.doi.org/10.1016/j.conbuildmat.2020.120606
[26] Nili, M., Salehi, A.M. (2010). Assessing the effectiveness of pozzolans in massive high-strength concrete. Construction and Building Materials, 24(11): 2108-2116. http://dx.doi.org/10.1016/j.conbuildmat.2010.04.049
[27] De Maeijer, P.K., Craeye, B., Snellings, R., Kazemi-Kamyab, H., Loots, M., Janssens, K., Nuyts, G. (2020). Effect of ultra-fine fly ash on concrete performance and durability. Construction and Building Materials, 263: 120493. http://dx.doi.org/10.1016/j.conbuildmat.2020.120493
[28] Dvorkin, L., Bezusyak, A., Lushnikova, N., Ribakov, Y. (2012). Using mathematical modeling for design of self compacting high strength concrete with metakaolin admixture. Construction and Building Materials, 37: 851-864. http://dx.doi.org/10.1016/j.conbuildmat.2012.04.019
[29] Chithra, S., Kumar, S.S., Chinnaraju, K., Ashmita, F.A. (2016). A comparative study on the compressive strength prediction models for high performance concrete containing nano silica and copper slag using regression analysis and artificial neural networks. Construction and Building Materials, 114: 528-535. http://dx.doi.org/10.1016/j.conbuildmat.2016.03.214
[30] Al-alaily, H.S., Hassan, A.A. (2016). Refined statistical modeling for chloride permeability and strength of concrete containing metakaolin. Construction and Building Materials, 114: 564-579. http://dx.doi.org/10.1016/j.conbuildmat.2016.03.187
[31] Al-alaily, H.S., A. Hassan, A.A., Hussein, A.A. (2017). Probabilistic and statistical modeling of chloride-induced corrosion for concrete containing Metakaolin. Journal of Materials in Civil Engineering, 29(11): 04017205. http://dx.doi.org/10.1061/(asce)mt.1943-5533.0002062
[32] Amini, K., Wang, X., Delatte, N. (2018). Statistical modeling of hydraulic and mechanical properties of pervious concrete using nondestructive tests. Journal of Materials in Civil Engineering, 30(6): 04018077. http://dx.doi.org/10.1061/(asce)mt.1943-5533.0002268
[33] Aslam, F., Farooq, F., Amin, M.N., Khan, K., Waheed, A., Akbar, A., Alyousef, R., Alabdulijabbar, H. (2020). Applications of gene expression programming for estimating compressive strength of high-strength concrete. Advances in Civil Engineering, 2020: 8850535. http://dx.doi.org/10.1155/2020/8850535
[34] Abdalla, A.H., Yahia, A., Tagnit-Hamou, A. (2020). Statistical modeling of mechanical and transport properties of concrete incorporating glass powder. Journal of Sustainable Cement-Based Materials, 10(2): 111-128. http://dx.doi.org/10.1080/21650373.2020.1793820
[35] Iswarya, G., Beulah, M. (2021). Use of zeolite and industrial waste materials in high strength concrete–A review. Materials Today: Proceedings, 46: 116-123. http://dx.doi.org/10.1016/j.matpr.2020.06.329
[36] Gupta, S., Sihag, P. (2022). Prediction of the compressive strength of concrete using various predictive modeling techniques. Neural Computing and Applications, 34(8): 6535-6545. http://dx.doi.org/10.1007/s00521-021-06820-y
[37] IS 456. (2000): Plain and Reinforced Concrete. Bureau of Indian Standards, New Dehli, pp. 1-114.
[38] I. Standard, “IS 10262: 2019 ,Concrete Mix Proportioning,” Indian Stand., no. January, 2019.
[39] IS 516-1959. (1959). Method of Tests for Strength of Concrete. Bureau of Indian Standards, pp. 1-30.
[40] Gowram, I. (2022). Experimental and analytical study of high-strength concrete containing natural zeolite and additives. Civil Engineering Journal, 8(10): 2318-2335.
[41] Sharma, B., Srikanth, P. (2021). Research & development premium in the indian equity market: An empirical study. Asian Economic and Financial Review, 11(10): 816-828. http://dx.doi.org/10.18488/JOURNAL.AEFR.2021.1110.816.828