Hussein Hasan*![]() | Sepanta Naimi
| Sepanta Naimi![]() | Mohammed Majeed Hameed
| Mohammed Majeed Hameed![]()
© 2023 IIETA. This article is published by IIETA and is licensed under the CC BY 4.0 license (http://creativecommons.org/licenses/by/4.0/).
OPEN ACCESS
Over recent decades, the adoption of modern techniques and advantageous construction methods has significantly improved the construction process. Building Information Modeling (BIM) is one such critical approach that has demonstrated its considerable effectiveness in estimating cost and material quantities for large-scale projects, such as dams. This research investigates and assesses the essential role and contributions of BIM technology and associated software tools in estimating the cost of dam construction projects, characterized by their high complexity, intricate management, extended construction period, and substantial concrete and steel material requirements. A mixed-methods study incorporating three primary strategies was employed: (A) literature review, (B) quantitative research, and (C) qualitative research approaches. Data were collected through semi-structured interviews and an online survey questionnaire. The key findings from this study's analysis (using an Iraqi dam as a case study) indicate that the implementation of BIM technology and software concepts is highly advantageous, dynamic, and effective in evaluating construction project budgets. Furthermore, the research highlights that accurately estimating the cost of dams can significantly reduce the time, financial investment, and effort needed to assess the budget of construction projects, particularly those involving dams with higher complexity, extended construction periods, challenging management, and intricate activities and tasks. Additionally, the use of BIM approaches was found to substantially mitigate human error in cost estimations and enhance the performance and accuracy of dam cost evaluations.
BIM technology, accuracy, cost estimation, construction projects, questionnaire
Project managers consistently seek advanced techniques and efficient methodologies to reduce time, effort, and cost when evaluating budgets for diverse small- and large-scale construction projects [1]. A significant challenge encountered by senior engineers, project managers, designers, and planners is the assessment of dam construction project budgets due to their increased size, heightened complexity, and substantial construction material requirements [2-5]. As a result, manual approaches employed for estimating dam construction project budgets may not yield high precision and performance [6], potentially leading to various calculation errors, including under- or over-estimation. Moreover, the extensive number of activities associated with large-scale dam construction necessitates substantial time and effort for humans to conduct cost analyses [7]. In this context, numerous intelligent methods for evaluating dam construction costs have been investigated and analyzed, with Building Information Modeling (BIM) technology emerging as a prominent innovative approach [8, 9]. Various BIM software tools, such as the REVIT software package, can accurately calculate concrete volume, required reinforcement steel, and other essential project components, significantly contributing to precise evaluations of a dam's overall cost [10, 11]. Furthermore, BIM software tools can estimate the time required to complete dam projects' activities and facilitate 3D modeling, enabling engineers and project managers to track the execution process of dams over time.
Zhang et al. [12] conducted a study examining and identifying the critical contributions and functional role of BIM technology in managing construction projects and cost estimation related to dam projects. A customized model and integrated method were developed to monitor geometry and coordinate construction activities linked to hydropower construction projects. The research results revealed that utilizing BIM technology, such as the REVIT software tool, significantly facilitated dam construction work. BIM techniques were found to manage construction tasks and building procedures for hydropower dams characterized by extended construction periods, significant requirements for construction standards and professionalism, complex management, challenging cooperation and coordination, and large-scale structural execution. Moreover, it was discovered that the BIM approach enabled project managers to devise active and practical solutions amidst the heightened complexity of such construction projects.
Sari et al. [13] carried out an analysis exploring the beneficial contributions and valuable role of BIM techniques in managing construction projects and cost estimation of dams. A comprehensive review was implemented, highlighting various benefits and critical relevance of BIM technology. The research findings indicated that employing the BIM method proved remarkably advantageous for dam construction projects, as it facilitated better accuracy in managing complex construction procedures, optimal dam operation and maintenance, and efficient design and planning. Additionally, the results confirmed that adopting the BIM technique achieved superior coordination of each construction stage and structural tasks of dam projects, providing an efficient and effective construction process for dams.
Dahal [14] led research work addressing major relevance and remarkable merits of BIM technology implementation. Two approaches were employed to achieve the study goal: a systematic review and a case study of a hydropower dam in Nepal, wherein BIM principles were applied to manage cost estimation. The study outputs affirmed that utilizing the BIM approach in hydropower dam projects effectively and practically managed cost estimation and provided quantity take-offs with higher accuracy. Furthermore, implementing BIM principles resulted in considerable savings in time, effort, and cost required to estimate budgets for hydropower dam construction projects.
Le et al. [15] investigated the critical role of BIM principles and REVIT software in enabling accurate cost estimations for various types of construction projects [15-20]. They determined that employing BIM technology saved significant time, effort, and cost in evaluating construction project budgets. Additionally, it was found that utilizing REVIT software for cost estimation contributed to greater accuracy and fewer human errors compared to traditional methods, such as hand calculations and quantity surveys. In this study, a case study of a selected Iraqi dam is assessed and estimated, with the aim to further demonstrate the advantages of using BIM technology in dam construction cost estimation.
In this study, a mixed-method approach is employed, comprising of (1) qualitative research, (2) quantitative research, and (3) a literature review. Utilizing these two research techniques is essential for collecting comprehensive data associated with the design and analysis of dam projects and addressing the significant role of BIM technology in estimating and managing the case study's cost. The first and third approaches aid in identifying and determining critical aspects to formulate the questionnaire dimensions and articles, which are related to the quantitative cross-sectional descriptive design (the second research approach). The following sections provide further details on these research approaches.
2.1 Qualitative cross-sectional descriptive approach
A qualitative cross-sectional descriptive approach is utilized to actively collect primary data from BIM experts and construction professionals, thereby facilitating the design and development of the research questionnaire with increased accuracy and professionalism. The perspectives of academicians, BIM experts, and construction professionals are invaluable in identifying essential points and useful ideas that outline major dimensions and articles linked to the research questionnaire. Field visits are conducted to engage with academicians, experts, and professionals, and semi-structured interviews are carried out with these key individuals. Subsequently, the scanning tool is developed and beta-tested before full implementation.
2.2 Quantitative cross-sectional descriptive approach
Employing a quantitative cross-sectional descriptive research method, an online survey questionnaire is designed based on selected dimensions and articles, enabling the collection of primary information from the study population. This population comprises senior engineers, construction project managers, and various engineering experts who can provide crucial insights into the significant relevance and primary benefits of BIM principles in estimating dam construction project costs with higher accuracy and fewer errors. Upon collecting responses, the answers are filtered, and the most appropriate responses are selected for analysis using the Statistical Package for Social Sciences (SPSS). The Likert scale is employed to categorize the degree of satisfaction and attitudes of respondents. The major dimensions of the research questionnaire include:
The significance of engineering project management in determining dam construction costs.
The importance of BIM programs in calculating dam costs.
The role of modern technology in cost estimation.
The necessity of determining dam construction costs before the commencement of construction.
2.3 Literature review
A comprehensive literature review is conducted to collect secondary data from various peer-reviewed articles and research publications sourced from ScienceDirect, ResearchGate, Google Scholar, Semantic Scholar, Academia, and SCOPUS. The literature review aims to highlight the beneficial contributions and important relevance of BIM technology and principles in assessing various construction projects with greater accuracy, fewer human errors, and reduced effort, time, and cost.
This section presents the research findings associated with the SPSS analysis of the online questionnaire. The following paragraphs illustrate more details on the SPSS analysis outputs.
3.1 The questionnaire demographic results
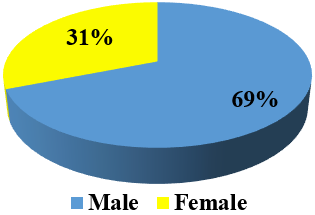
Table 1 describes the data analysis of sample population demographic data according to gender. It can be inferred from Table 1 that more than half of the study sample are male, while around one-third of them represent females.
Table 1. Sample population demographic data results related to gender
|
Gender |
Frequency |
% |
Valid % |
|
|
Valid |
Male |
69 |
69.0 |
69.0 |
|
Female |
31 |
31.0 |
31.0 |
|
|
Total |
100 |
100 |
100 |
|
From the SPSS statistical results represented in Table 1, it can be inferred that the male engineers’ percentage outpaced the ratio of female engineers who participated in this study. The ratio of male engineers corresponded to 69%. At the same time, the portion of female engineers amounts only to 31%. Figure 1 represents a graphical illustration of the data described in Table 1.
Figure 1. A graphical illustration of the SPSS data linked to gender
Furthermore, the research findings provided some additional data in Table 2. Table 2 presents the data analysis of the sample population demographic data according to educational level.
Table 2. Sample population demographic data results related to the level of education
|
Education level |
Frequency |
% |
Valid % |
|
|
Valid |
Bachelor |
19 |
19.0 |
19.0 |
|
Master |
77 |
77.0 |
77.0 |
|
|
Doctorate |
4 |
4.0 |
4.0 |
|
|
Total |
100 |
100 |
100 |
|
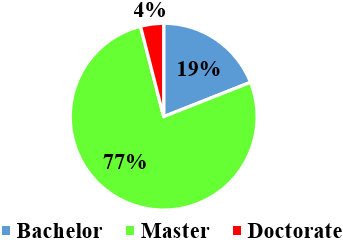
It is concluded from the SPSS statistical data obtained after carrying out the survey in Table 2 that more than 50% of the overall study sample are master’s educated. At the same time, only 4% of them have a doctorate degree. Meanwhile, around one-fifth of the study sample has a bachelor’s degree. Figure 2 describes a graphical illustration of the SPSS data linked to the level of education.
Figure 2. A graphical illustration of the SPSS data linked to the level of education
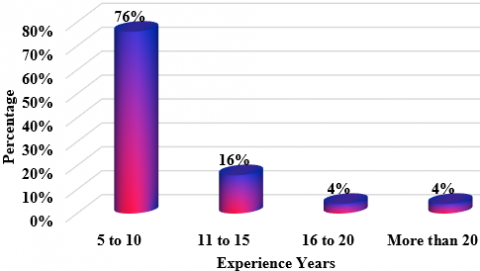
Table 3 illustrates the data analysis of sample population demographic data according to the years of experience. It can be indicated from Table 3 that around three-quarters of the study sample have five to ten years of experience. 16% of the study sample has eleven to fifteen years in construction. On the other hand, only four percent of the study population has sixteen to twenty years in construction, and also only four percent have experience that exceeds twenty years. Figure 3 expresses a graphical illustration of the SPSS data linked to experience years.
Table 3. Sample population demographic data results related to the experience years number
|
Years of experience |
Frequency |
% |
Valid % |
|
|
Valid |
5-10 |
76 |
76.0 |
76.0 |
|
11-15 |
16 |
16.0 |
16.0 |
|
|
16-20 |
4 |
4.0 |
4.0 |
|
|
More than 20 |
4 |
4.0 |
4.0 |
|
|
Total |
100 |
100 |
100.0 |
|
Figure 3. A graphical illustration of the SPSS data linked to experience years
Table 4 represents the data analysis of sample population demographic data according to age.
Table 4. Sample population demographic data results related to age
|
Age |
Frequency |
% |
Valid % |
|
|
Valid |
25-30 |
88 |
88.0 |
88.0 |
|
31-35 |
8 |
8.0 |
8.0 |
|
|
36-45 |
4 |
4.0 |
4.0 |
|
|
Total |
100 |
100 |
100.0 |
|
Table 5. Sample population demographic data results related to qualification
|
Qualification |
Frequency |
% |
Valid % |
|
|
Valid |
Civil engineering |
75 |
75 |
75.0 |
|
Architectural engineering |
13 |
13 |
13.0 |
|
|
Electrical Engineering |
5 |
5.0 |
5.0 |
|
|
Mechanical Engineering |
4 |
4.0 |
4.0 |
|
|
Others |
3 |
3.0 |
3.0 |
|
|
Total |
100 |
100 |
100 |
|
It is concluded from Table 4 that most of the study sample has aged between 25 and 30 years, which corresponds to a percentage of 88%. A lower ratio of the engineers surveyed in this research (corresponding to 8%) is aged 31 to 35 years. At the same time, very few individuals in the study sample have ages between 36 and 45 years, corresponding to only 4%. Thus, the largest portion of engineers who participated has an age between 25 and 30 years old. In contrast, the lowest ratio has an age of between 36 and 45 years old. Table 5 illustrates Sample population demographic data results related to qualification.
Table 6. Arithmetic means, standard deviation, Z-value, and rank of the articles associated with the first dimension
|
Paragraph |
Arithmetic mean |
Standard deviation |
Z value |
|
Control the scope of the project to meet the requirements and according to the specifications |
4.70 |
0.859 |
19.797 |
|
Quality control of project implementation |
4.42 |
1.182 |
12.012 |
|
Take decisions and corrective actions |
4.09 |
1.457 |
7.481 |
|
Execution of dam works within budget limits |
3.88 |
1.506 |
5.843 |
|
Completion of project work on time |
1.60 |
1.341 |
-10.441 |
Table 7. Arithmetic means, standard deviation, Z-value, and rank of the articles associated with the second dimension
|
Paragraph |
Arithmetic mean |
Standard deviation |
Z value |
|
Facilitate the calculation of quantities and prices |
4.61 |
1.053 |
15.288 |
|
Increase the efficiency of cost planning and reduce risks |
4.05 |
1.417 |
7.411 |
|
Ease of sharing information with project parties |
3.22 |
1.801 |
1.221 |
|
Provide information on the cost of the project over the life of the building |
2.39 |
1.858 |
-3.283 |
|
Cost control and projection of sustainable building performance |
1.57 |
1.241 |
-11.521 |
Table 8. Arithmetic means, standard deviation, Z-value, and rank of the articles associated with the third dimension
|
Paragraph |
Arithmetic mean |
Standard deviation |
Z value |
|
Accurately calculate project quantities |
4.01 |
1.586 |
6.369 |
|
Create data to use as a benchmark for future projects |
3.75 |
1.714 |
4.376 |
|
Controlling cost estimates in the long run |
3.11 |
1.874 |
0.587 |
|
The project schedule is not delayed |
2.32 |
1.797 |
-3.784 |
|
Estimating future maintenance costs and dealing with unexpected expenses |
1.41 |
1.138 |
-13.973 |
Table 9. Arithmetic means, standard deviation, Z-value, and rank of the articles associated with the fourth dimension
|
Paragraph |
Arithmetic mean |
Standard deviation |
Z value |
|
Not to exceed the company’s budget |
3.63 |
1.824 |
3.454 |
|
Determine and forecast future expenses |
3.22 |
1.905 |
1.155 |
|
Avoid project losses |
2.44 |
1.855 |
-3.019 |
|
Compare the expected cost to the actual cost |
1.90 |
1.567 |
-7.021 |
|
Estimating and controlling project costs |
1.34 |
1.017 |
-16.319 |
It is inferred from Table 5 that most of the individuals surveyed in the online questionnaire are civil engineers, corresponding to three-quarters of the study sample. At the same time, thirteen percent of the engineers who participated in the questionnaire were architects. On the other hand, lower ratios of participants represent electrical engineers and mechanical engineers, corresponding to 5% and 4%, respectively.
3.2 Analysis results of questionnaire articles
Table 6 presents the arithmetic mean, standard deviation, Z-value, and rank of the articles related to the significance of engineering project management in locating the budget for building dams, which is associated with the first dimension.
It can be noted from Table 6 that the maximum arithmetic mean related to the first dimension, which is “the importance of engineering project management in determining the cost of building dams”, was for the paragraph “Control the scope of the project to meet the requirements and according to the specifications” corresponding to an average of 4.70. This paragraph is located in the first rank (which indicates that all male and female engineers have greatly affirmed and assured its significance and contribution compared with other paragraphs of the same dimension). In comparison, the minimum arithmetic mean recorded for this dimension was 1.60, corresponding to the paragraph “Completion of project work on time,” which is in the fifth rank. The standard deviation of this dimension ranges from 0.859 to 1.506. Table 7 presents the arithmetic mean, standard deviation, Z-value, and rank of the articles related to the significance of BIM technology in calculating the cost of dams.
Table 8 illustrates the arithmetic mean, standard deviation, Z-value, and rank of the articles related to the significance of modern technology roles in calculating the cost. It can be observed from the data presented in Table 7 that the maximum arithmetic mean related to the importance of the BIM software in calculating the cost of dams was for the paragraph “Facilitate the calculation of quantities and prices,” corresponding to an average of 4.61. This paragraph is in the first rank. On the other hand, the minimum arithmetic mean recorded for this dimension was 1.57, corresponding to the paragraph “Cost control and projection of sustainable building performance,” which is in the fifth rank. The standard deviation of this dimension ranges from 1.053 to 1.858.
It is observed from Table 8 that the maximum arithmetic mean related to the importance of modern technology roles in computing the cost was for the paragraph “Accurately calculate project quantities,” corresponding to an average of 4.01. This paragraph is located in the first rank. On the other hand, the minimum arithmetic mean recorded for this dimension was 1.41, corresponding to the paragraph “Estimating future maintenance costs and dealing with unexpected expenses,” which is located in the fifth rank. The standard deviation of this dimension ranges from 1.138 to 1.874.
Table 9 illustrates the arithmetic mean, standard deviation, Z-value, and rank of the articles related to the significance of determining the cost of building dams before construction.
It is noted from Table 9 that the maximum arithmetic mean related to the importance of determining the cost of building dams before construction was for the paragraph “Not to exceed the company’s budget,” corresponding to an average of 3.63. This paragraph is located in the first rank. On the other hand, the minimum arithmetic mean recorded for this dimension was 1.34, corresponding to the paragraph “Estimating and controlling project costs,” which is located in the fifth rank. The standard deviation of this dimension ranges from 1.017 to 1.905. Table 10 illustrates the arithmetic mean, standard deviation, rank, and responses of the twenty articles related to the research questionnaire. Table 10 illustrates the correlation coefficient between each section pertaining to the first dimension, which states, “The Importance of Engineering Project Management in Determining the Cost of Building Dams.”
It can be inferred from Table 10 that the correlation coefficients between different paragraphs associated with the first dimension, “The Importance of Engineering Project Management in Determining the Cost of Building Dams”, are significant at a level of significance of 0.05. Therefore, the first dimension and all its paragraphs are considered valid for what was set to measure and assess the importance of project management in construction. In addition, the SPSS analysis results revealed the correlation coefficient between each paragraph of the second dimension, “The importance of the BIM program in calculating the cost of dams,” as indicated in Table 11.
It can be indicated from Table 11 that the correlation coefficient between each paragraph associated with the second dimension, stating “The importance of the BIM program in calculating the cost of dams,” is significant at a level of significance of 0.05. For this reason, this second dimension and its articles can be considered valid for what was set to measure the importance of modern technologies like BIM principles in calculating the costs of dams. Moreover, the SPSS analysis results revealed the correlation coefficient between each paragraph of the third dimension, “The role of modern technology in calculating the cost,” as indicated in Table 12.
It can be observed from Table 12 that the correlation coefficients between different paragraphs associated with the third dimension, “The role of modern technology in calculating the cost”, showed a considerable validation degree at a level of significance of 0.05. These results can indicate that the third dimension and its articles are considered valid for what was set to measure the critical role of modern technologies in assessing the costs of dams. Furthermore, the SPSS analysis results revealed the correlation coefficient between each paragraph of the fourth dimension, “The importance of determining the cost of building dams before construction,” as indicated in Table 13.
It is noted in Table 13 that the correlation coefficients between various paragraphs associated with the fourth dimension, “The importance of determining the cost of building dams before construction”, indicated a significant validation degree at a level of significance of 0.05. These results can suggest that the fourth dimension and its articles are considered valid for what was set to measure the importance of determining the cost of building dams before construction.
Table 10. The correlation coefficient between paragraphs related to the first dimension
|
Category |
Q1 |
Q2 |
Q3 |
Q4 |
Q5 |
|
|
Control the scope of the project to meet the requirements and according to the specifications |
Pearson Correlation |
1 |
0.852** |
0.716** |
0.651** |
0.158 |
|
Sig. (2-tailed) |
|
0.000 |
0.000 |
0.000 |
0.117 |
|
|
N |
100 |
100 |
100 |
100 |
100 |
|
|
Quality control of project implementation |
Pearson Correlation |
0.852** |
1 |
0.893** |
0.811** |
0.222* |
|
Sig. (2-tailed) |
0.000 |
--- |
0.000 |
0.000 |
0.027 |
|
|
N |
100 |
100 |
100 |
100 |
100 |
|
|
Take decisions and corrective actions |
Pearson Correlation |
0.716** |
0.893** |
1 |
.944** |
.282** |
|
Sig. (2-tailed) |
0.000 |
0.000 |
--- |
0.000 |
0.004 |
|
|
N |
100 |
100 |
100 |
100 |
100 |
|
|
Execution of dam works within budget limits |
Pearson Correlation |
0.651** |
0.811** |
0.944** |
1 |
0.336** |
|
Sig. (2-tailed) |
0.000 |
0.000 |
0.000 |
--- |
0.001 |
|
|
N |
100 |
100 |
100 |
100 |
100 |
|
|
Completion of project work on time |
Pearson Correlation |
0.158 |
0.222* |
0.282** |
0.336** |
1 |
|
Sig. (2-tailed) |
0.117 |
0.027 |
0.004 |
0.001 |
--- |
|
|
N |
100 |
100 |
100 |
100 |
100 |
|
|
**. Correlation is significant at the 0.01 level (2-tailed) |
||||||
|
*. Correlation is significant at the 0.05 level (2-tailed) |
||||||
Table 11. The correlation coefficient between each paragraph related to the second dimension
|
Category |
Q6 |
Q7 |
Q8 |
Q9 |
Q10 |
|
|
Facilitate the calculation of quantities and prices |
Pearson Correlation |
1 |
0.710** |
0.461** |
0.280** |
0.172 |
|
Sig. (2-tailed) |
--- |
0.000 |
0.000 |
0.005 |
0.087 |
|
|
N |
100 |
100 |
100 |
100 |
100 |
|
|
Increase the efficiency of cost planning and reduce risks |
Pearson Correlation |
0.710** |
1 |
0.807** |
0.507** |
0.311** |
|
Sig. (2-tailed) |
0.000 |
--- |
0.000 |
0.000 |
0.002 |
|
|
N |
100 |
100 |
100 |
100 |
100 |
|
|
Ease of sharing information with project parties |
Pearson Correlation |
0.461** |
0.807** |
1 |
0.747** |
0.458** |
|
Sig. (2-tailed) |
0.000 |
0.000 |
--- |
0.000 |
0.000 |
|
|
N |
100 |
100 |
100 |
100 |
100 |
|
|
Provide information on the cost of the project over the life of the building |
Pearson Correlation |
0.280** |
0.507** |
0.747** |
1 |
0.652** |
|
Sig. (2-tailed) |
0.005 |
0.000 |
0.000 |
--- |
0.000 |
|
|
N |
100 |
100 |
100 |
100 |
100 |
|
|
Cost control and projection of sustainable building performance |
Pearson Correlation |
0.172 |
0.311** |
0.458** |
0.652** |
1 |
|
Sig. (2-tailed) |
0.087 |
0.002 |
0.000 |
0.000 |
--- |
|
|
N |
100 |
100 |
100 |
100 |
100 |
|
|
**. Correlation is significant at the 0.01 level (2-tailed) |
||||||
Table 12. The correlation coefficient between each paragraph of the third dimension
|
Category |
Q11 |
Q12 |
Q13 |
Q14 |
Q15 |
|
|
Accurately calculate project quantities |
Pearson Correlation |
1 |
0.941** |
0.710** |
0.463** |
0.227* |
|
Sig. (2-tailed) |
--- |
0.000 |
0.000 |
0.000 |
0.023 |
|
|
N |
100 |
100 |
100 |
100 |
100 |
|
|
Create data to use as a benchmark for future projects |
Pearson Correlation |
0.941** |
1 |
0.829** |
0.541** |
0.265** |
|
Sig. (2-tailed) |
0.000 |
--- |
0.000 |
0.000 |
0.008 |
|
|
N |
100 |
100 |
100 |
100 |
100 |
|
|
Controlling cost estimates in the long run |
Pearson Correlation |
0.710** |
0.829** |
1 |
0.748** |
0.367** |
|
Sig. (2-tailed) |
0.000 |
0.000 |
--- |
0.000 |
0.000 |
|
|
N |
100 |
100 |
100 |
100 |
100 |
|
|
The project schedule is not delayed |
Pearson Correlation |
0.463** |
0.541** |
0.748** |
1 |
0.543** |
|
Sig. (2-tailed) |
0.000 |
0.000 |
0.000 |
--- |
0.000 |
|
|
N |
100 |
100 |
100 |
100 |
100 |
|
|
Estimating future maintenance costs and dealing with unexpected expenses |
Pearson Correlation |
0.227* |
0.265** |
0.367** |
0.543** |
1 |
|
Sig. (2-tailed) |
0.023 |
0.008 |
0.000 |
0.000 |
--- |
|
|
N |
100 |
100 |
100 |
100 |
100 |
|
|
**. Correlation is significant at the 0.01 level (2-tailed) |
||||||
|
*. Correlation is significant at the 0.05 level (2-tailed) |
||||||
Table 13. The correlation coefficient between each paragraph of the fourth dimension
|
Category |
Q16 |
Q17 |
Q18 |
Q19 |
Q20 |
|
|
Not to exceed the company’s budget |
Pearson Correlation |
1 |
0.884** |
0.589** |
0.436** |
0.254* |
|
Sig. (2-tailed) |
--- |
0.000 |
0.000 |
0.000 |
0.011 |
|
|
N |
100 |
100 |
100 |
100 |
100 |
|
|
Determine and forecast future expenses |
Pearson Correlation |
0.884** |
1 |
0.733** |
0.542** |
0.316** |
|
Sig. (2-tailed) |
0.000 |
--- |
0.000 |
0.000 |
0.001 |
|
|
N |
100 |
100 |
100 |
100 |
100 |
|
|
Avoid project losses |
Pearson Correlation |
0.589** |
0.733** |
1 |
0.801** |
0.466** |
|
Sig. (2-tailed) |
0.000 |
0.000 |
--- |
0.000 |
0.000 |
|
|
N |
100 |
100 |
100 |
100 |
100 |
|
|
Compare the expected cost to the actual cost |
Pearson Correlation |
0.436** |
0.542** |
0.801** |
1 |
0.668** |
|
Sig. (2-tailed) |
0.000 |
0.000 |
0.000 |
--- |
0.000 |
|
|
N |
100 |
100 |
100 |
100 |
100 |
|
|
Estimating and controlling project costs |
Pearson Correlation |
0.254* |
0.316** |
0.466** |
0.668** |
1 |
|
Sig. (2-tailed) |
0.011 |
0.001 |
0.000 |
0.000 |
--- |
|
|
N |
100 |
100 |
100 |
100 |
100 |
|
|
**. Correlation is significant at the 0.01 level (2-tailed) |
||||||
|
*. Correlation is significant at the 0.05 level (2-tailed) |
||||||
In order to estimate the cost of dam construction projects, which are characterized by their increased complexity, challenging management, protracted construction period, and a significant quantity of concrete and steel materials required to build these large-scale dams, this research is being conducted. The study relied on a mixed study design with three main methodologies: (1) literature reviews; (2) quantitative research approaches; and (3) qualitative research approaches. Both a short-structured interview and an online survey were used. According to the research analysis of this study, the key work outcomes can be summed up as follows:
1-Utilizing BIM technology and BIM software principles is significantly beneficial, helpful, and practical in estimating the budget of construction projects (like the Iraqi dam in this case study).
2-Evaluating the cost of the dam could reduce considerable levels of time, effort, and budget required to evaluate the cost of construction projects, especially dams, which are characterized by higher complexity, longer construction period, complicated management, and challenging activities and construction tasks.
3-Employing BIM techniques can remarkably mitigate human errors in cost calculations and accomplish better performance and accuracy of dams’ cost evaluation.
[1] Mozafari, M., Milanović, P., Jamei, J. (2021). Water leakage problems at the Tangab Dam Reservoir (SW Iran), case study of the complexities of dams on karst. Bulletin of Engineering Geology and the Environment, 80(10): 7989-8007. https://doi.org/10.1007/s10064-021-02387-z
[2] Wang, L., Yang, H.Q., Zhou, S.H., Chen, E., Tang, S.W. (2018). Mechanical properties, long-term hydration heat, shinkage behavior and crack resistance of dam concrete designed with low heat Portland (LHP) cement and fly ash. Construction and Building Materials, 187: 1073-1091. https://doi.org/10.1016/j.conbuildmat.2018.08.056
[3] Seo, S.N. (2021). Energy revolutions: A story of the three gorges dam in China. In Climate Change and Economics, pp. 113-129. https://doi.org/10.1007/978-3-030-66680-4_7
[4] Naimi, M.R.S. (2016). Proje ve maliyet yönetimi yöntemleriyle kalitenin ve verimliliğin artirilmasinin incelenmesi. İstanbul Aydın Üniversitesi Dergisi, 8(29): 51-65. https://doi.org/10.17932/IAU.IAUD.m.13091352.2016.8/29.51-65
[5] Akbay, C., Naimi, S. (2021). İnşaat projelerinde proje yönetim tekniklerinin kullanilmasi: Aksaray mahmudiye ortaokulu örneği. MAS Journal of Applied Sciences, 6(3): 743-753. https://doi.org/10.52520/masjaps.104
[6] Rabia, M.P., Kumar, D.S. (2022). Applications of building information modelling for water infrastructure development. In Hydrological Modeling, pp. 221-230. https://doi.org/10.1007/978-3-030-81358-1_17
[7] Tahmasebinia, F., Jiang, R., Sepasgozar, S., Wei, J., Ding, Y., Ma, H. (2022). Implementation of BIM energy analysis and monte carlo simulation for estimating building energy performance based on regression approach: A case study. Buildings, 12(4): 449. https://doi.org/10.3390/buildings12040449
[8] Wu, K., Tang, S. (2022). BIM-Assisted Workflow Enhancement for Architecture Preliminary Design. Buildings, 12(5): 601. https://doi.org/10.3390/buildings12050601
[9] Scianna, A., Gaglio, G.F., La Guardia, M. (2022). Structure monitoring with BIM and IoT: The case study of a bridge beam model. ISPRS International Journal of Geo-Information, 11(3): 173. https://doi.org/10.3390/ijgi11030173
[10] Rakhymberdina, M.Y., Grokhotov, E.V., Assylkhanova, Z.A., Toguzova, M.M. (2022). Using space survey materials for modeling hydrodynamic accidents at mining enterprises in kazakhstan. ISPRS Annals of Photogrammetry, Remote Sensing & Spatial Information Sciences, Prague, Czech Republic, pp. 193-198. https://doi.org/10.5194/isprs-archives-XLVI-5-W1-2022-193-2022
[11] Fazeli, A., Dashti, M. S., Jalaei, F., Khanzadi, M. (2020). An integrated BIM-based approach for cost estimation in construction projects. Engineering, Construction and Architectural Management, 28(9): 2828-2854. https://doi.org/10.1108/ECAM-01-2020-0027
[12] Zhang, S., Hou, D., Wang, C., Pan, F., Yan, L. (2020). Integrating and managing BIM in 3D web-based GIS for hydraulic and hydropower engineering projects. Automation in Construction, 112: 103114. https://doi.org/10.1016/j.autcon.2020.103114
[13] Sari, Y.C., Wahyuningrum, C.A., Kresnanto, N.C. (2020). Building information modeling (BIM) for dams-literature review and future needs. Journal of the Civil Engineering Forum, 6(1): 61-68. https://doi.org/10.22146/jcef.51519
[14] Dahal, S. (2019). BIM based design of hydropower in nepal: Lower piluwa small hydropower project. Bachelor thesis. Metropolia University of Applied Sciences.
[15] Le, H.T.T., Likhitruangsilp, V., Yabuki, N. (2021). A BIM-database-integrated system for construction cost estimation. ASEAN Engineering Journal, 11(1): 45-59. https://doi.org/10.11113/aej.v11.16666
[16] Babatunde, S.O., Perera, S., Ekundayo, D., Adeleye, T.E. (2019). An investigation into BIM-based detailed cost estimating and drivers to the adoption of BIM in quantity surveying practices. Journal of Financial Management of Property and Construction, 25(1): 61-81. https://doi.org/10.1108/JFMPC-05-2019-0042
[17] Moses, T., Heesom, D., Oloke, D. (2020). Implementing 5D BIM on construction projects: Contractor perspectives from the UK construction sector. Journal of Engineering, Design and Technology, 18(6): 1867-1888. https://doi.org/10.1108/JEDT-01-2020-0007
[18] Muratova, A., Ptukhina, I. (2019). BIM as an instrument of a conceptual project cost estimation. In International Scientific Conference on Energy, Environmental and Construction Engineering, Petersburg, Russia, pp. 469-477. https://doi.org/10.1007/978-3-030-42351-3_41
[19] Haider, U., Khan, U., Nazir, A., Humayon, M. (2020). Cost comparison of a building project by manual and BIM. Civil Engineering Journal, 6(1): 34-49. http://dx.doi.org/10.28991/cej-2020-03091451
[20] Toan, N.Q., Hang, N.T.T., Duyen, D.H., Nam, T.P. (2020). Application of building information modeling (BIM) for automatic integration of construction costs management information into 3D models in consideration of Vietnamese regulations. IOP Conference Series: Materials Science and Engineering, 869(6): 062007. https://doi.org/10.1088/1757-899X/869/6/062007